0971
Accelerating clinical diffusion-weighted MRI using deep learning: Potential utility in metastatic prostate cancer and malignant mesothelioma1Radiotherapy and Imaging, Institute of Cancer Research, London, Sutton, United Kingdom
Synopsis
Diffusion-weighted MR-imaging (DWI) is an attractive non-invasive tool for staging and response evaluation of myeloma and metastatic bone disease. However, scans can last up to 30 minutes in whole body studies, which can hinder the adoption of DWI in clinical practice, especially in patients who are unwell. Here, we use a deep learning approach to establish that sub-sampled, but rapidly acquired images, could be used to reconstruct ‘clinical-grade’ DWI images, potentially reducing acquisition times (from ~30 to ~5 minutes). Such time savings could reduce scanning costs and spare patient time/discomfort.
Background
Whole-body diffusion-weighted imaging (DWI) is the current state-of-the-art for monitoring patients with metastatic bone disease from advanced prostate cancer (APC)1,2 and myeloma3. There is also evidence that DWI can be a response biomarker for pleural mesothelioma (MPM - a rare cancer affecting the outer lining of the lung caused primarily by asbestos exposure)4. DWI provides surrogate quantification of tumor cellularity through calculation of the Apparent Diffusion Coefficient (ADC), which is derived from images acquired using at-least two different diffusion-weightings (b-values). However, DWI scans can last up to 30 minutes, especially in whole body studies, as images are often acquired 9-12 times for each b-value and then averaged in order to increase the inherently low signal-to-noise ratio (SNR) of the technique (number of excitations, NeX=9-12). Such long acquisition times can hinder the wider adoption of DWI due to scanner availability and patient compliance.Purpose
In this retrospective study, we utilise a uniquely acquired DWI dataset to train a deep-learning neural-network that is able to reconstruct high quality data (NeX = 9-12) from low-quality, but rapidly acquired data (NeX = 1). We test our network for reconstruction of DWI in both APC and MPM.Methods
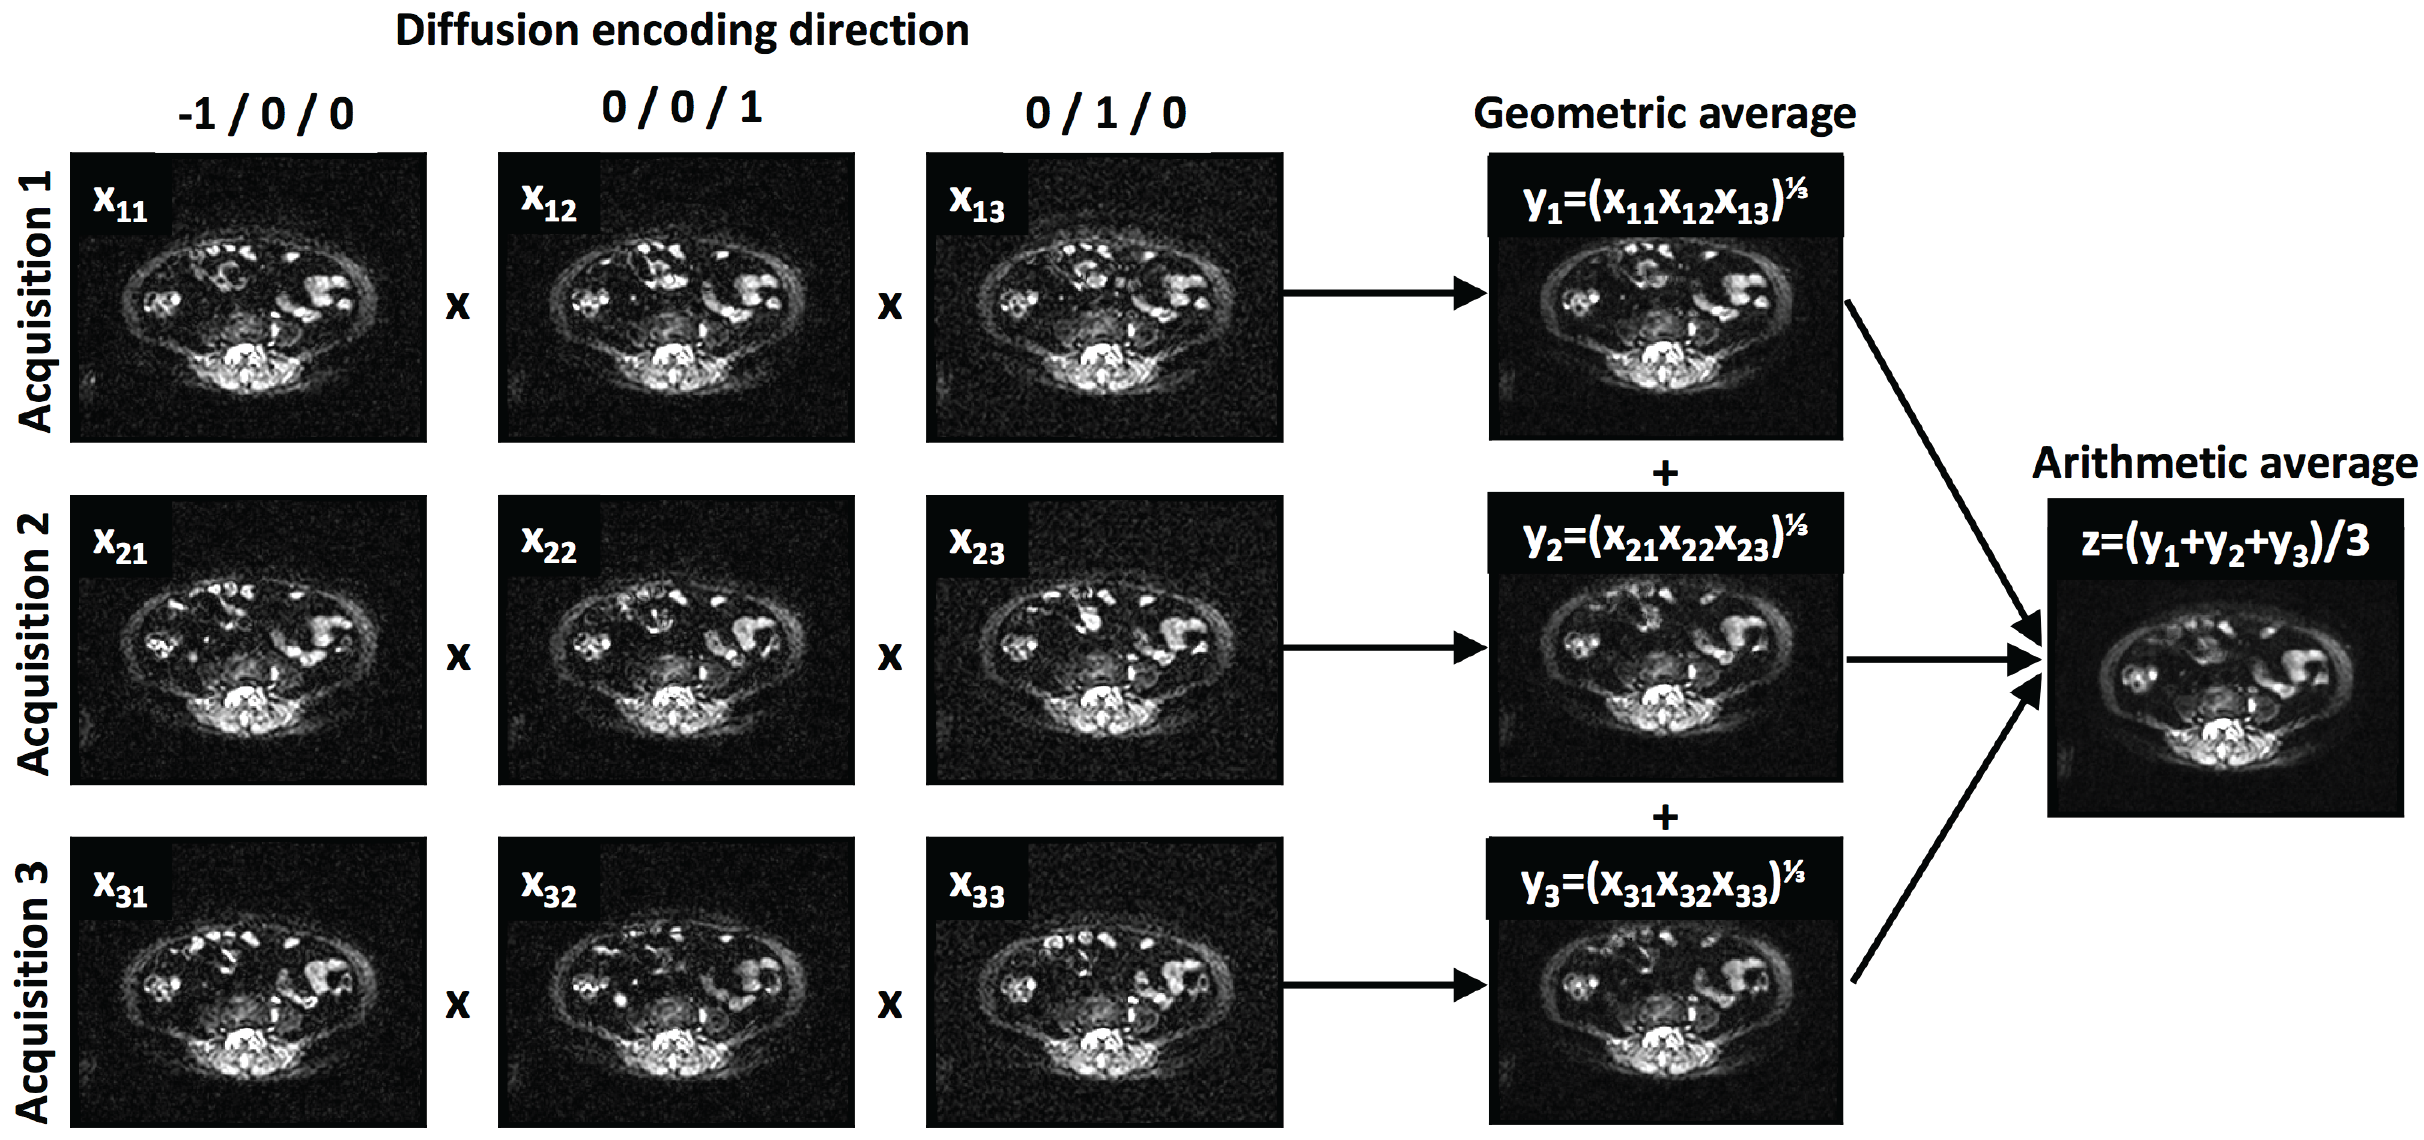
APC Cohort: Whole-body DWI was acquired in 17 patients with suspected APC in the skeleton on a 1.5T MR system (Siemens Aera, Erlangen, Germany). Axial, spin-echo, echo-planar imaging (SE-EPI) was acquired from skull-base to mid-thigh (slice thickness ST=5mm, inversion-time TI=180ms, echo-time TE=79ms, repetition-time TR=12.7s, field-of-view FoV=128x104 pixels (interpolated to 256x208), resolution 1.68x1.68mm2, readout bandwidth BW=1955 Hz/pixel, and GRAPPA parallel imaging with acceleration factor R=2). Images at each axial location were acquired using b-values of 50, 600 and 900 s/mm2 (NeX=1); for each b-value image were acquired using orthogonal b-values (bx,by,bx) ∝ (-1,0,0), (0,1,0), and (0,0,1). Trace-weighted images were computed as the geometric average of these images, and the entire acquisition was repeated three times, such that a final “gold-standard” image (NeX=9) could be calculated as the arithmetic average of the trace images (Figure 1). We developed a deep-learned, de-noising image filter (DNIF) by training a U-Net based architecture5 (random weight initialisation, linear activation function in final layer, ReLu activation in the preceding layers and a mean absolute error cost function). This filter generates NeX=9 quality images from NeX=1 images at each of the three b-values, and ADC maps were subsequently calculated. Patients were randomly split into training/validation cohorts of 14/3 patients (59400/15120 image slices).MPM Cohort: To demonstrate that our DNIF network worked in other diffusion-weighted imaging (DWI) studies, we retrospectively evaluated data from a cohort of patients (28) assessed for the presence of MPM. Axial images were acquired on a 1.5T MR system (Siemens Avanto, Erlangen, Germany) using SE-EPI with b-values = 100, 500 and 800 s/mm2 over the same three orthogonal directions as for our APC study (ST=5mm, TE=92ms, TR=6s, FoV=128x92 linearly interpolated to 256x208, BW=1860 Hz/pixel, R=2). Trace-weighted images were acquired four times and arithmetically averaged to produce gold-standard NeX=12 images. We tested the quality of the previously trained DNIF filter, and also re-trained the model using these data (randomly split into training/validation cohorts of 20/8 patients – 43200/15120 image slices).
Results
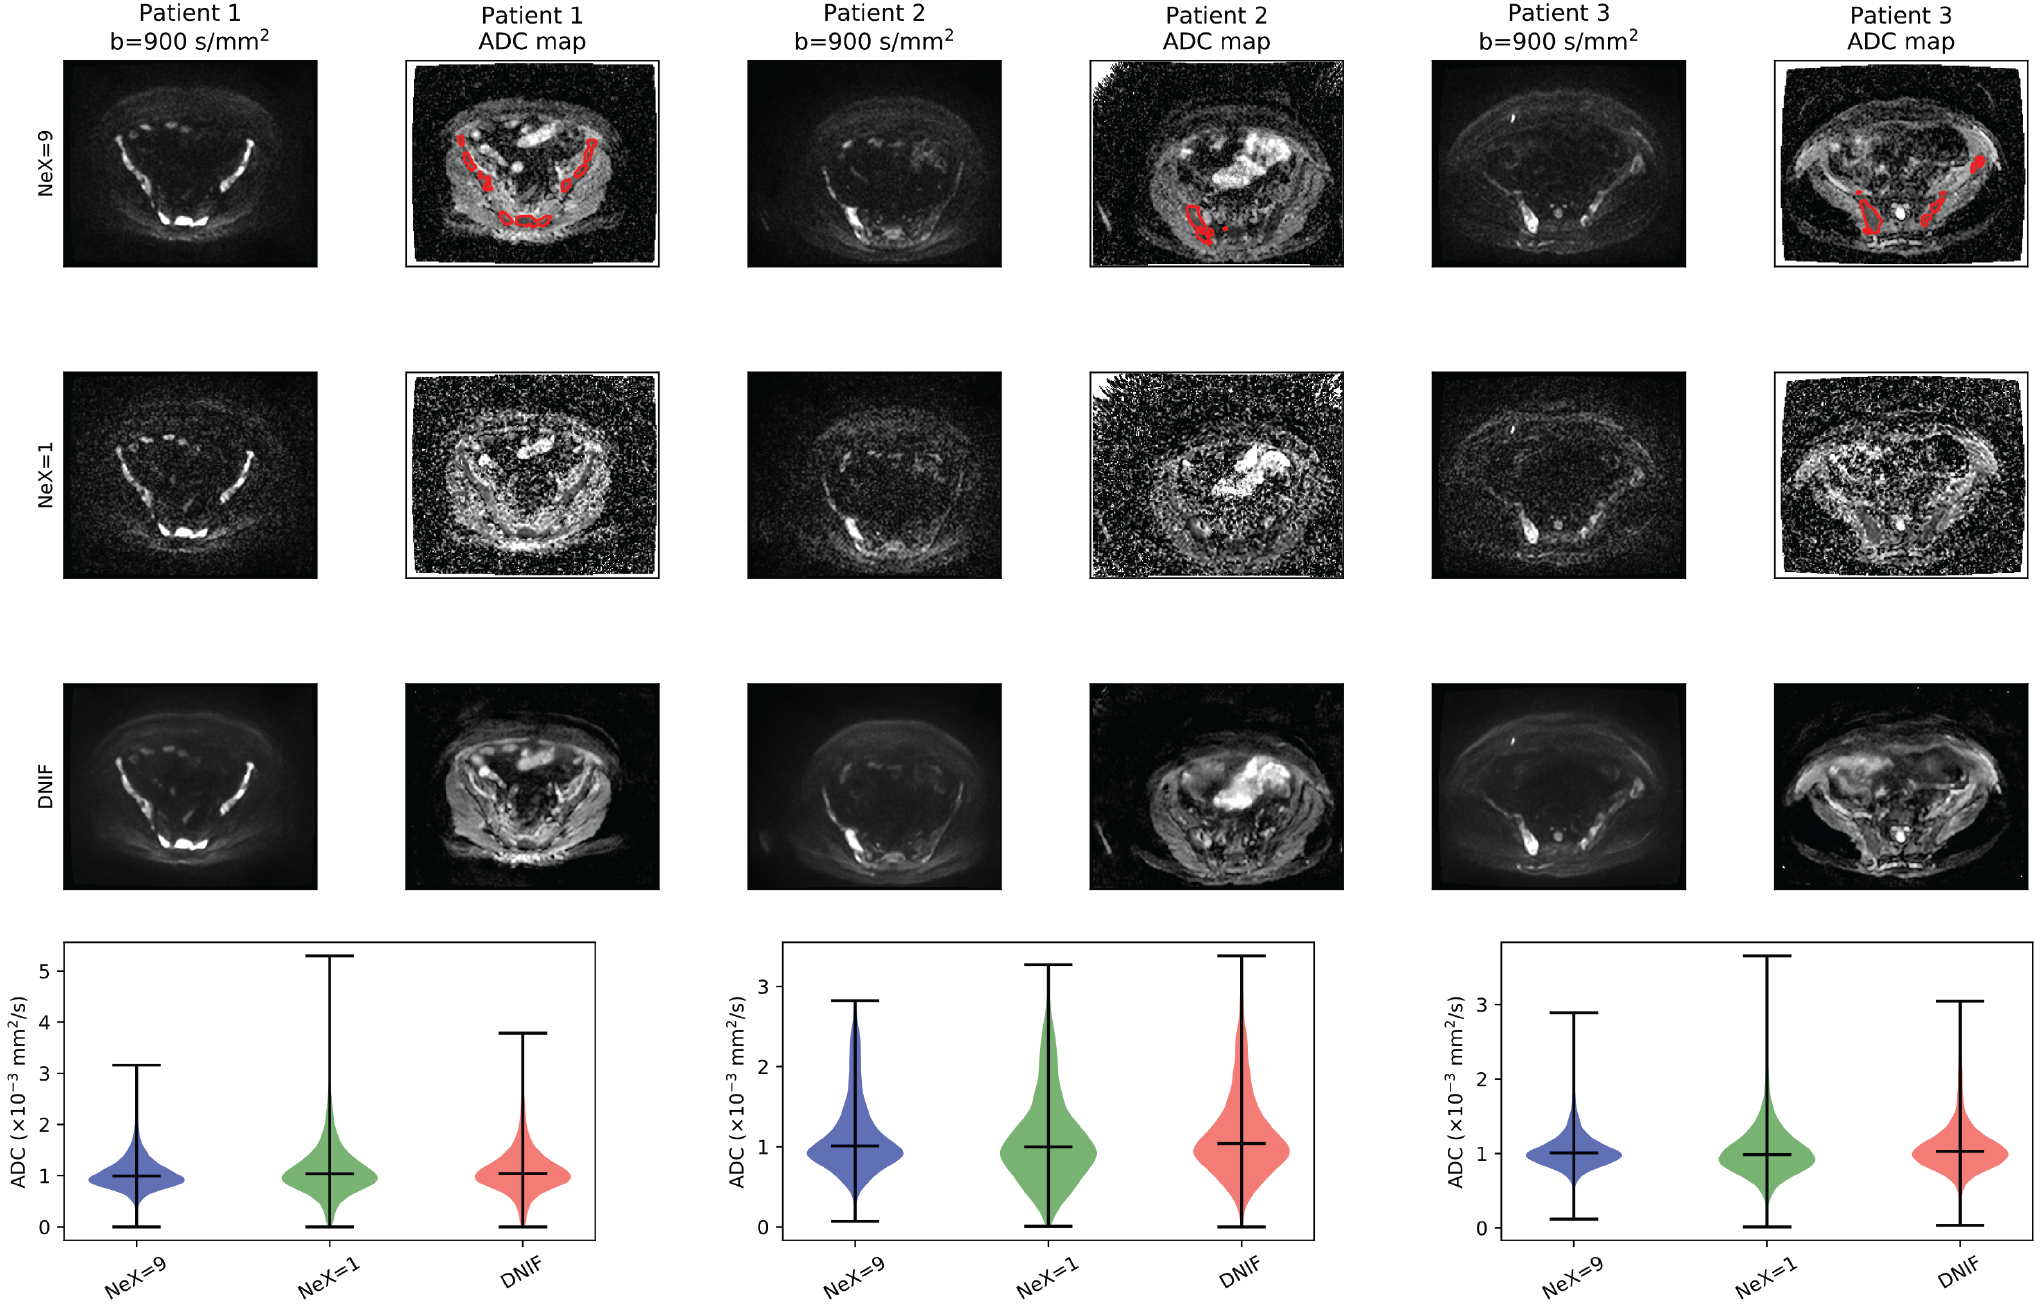
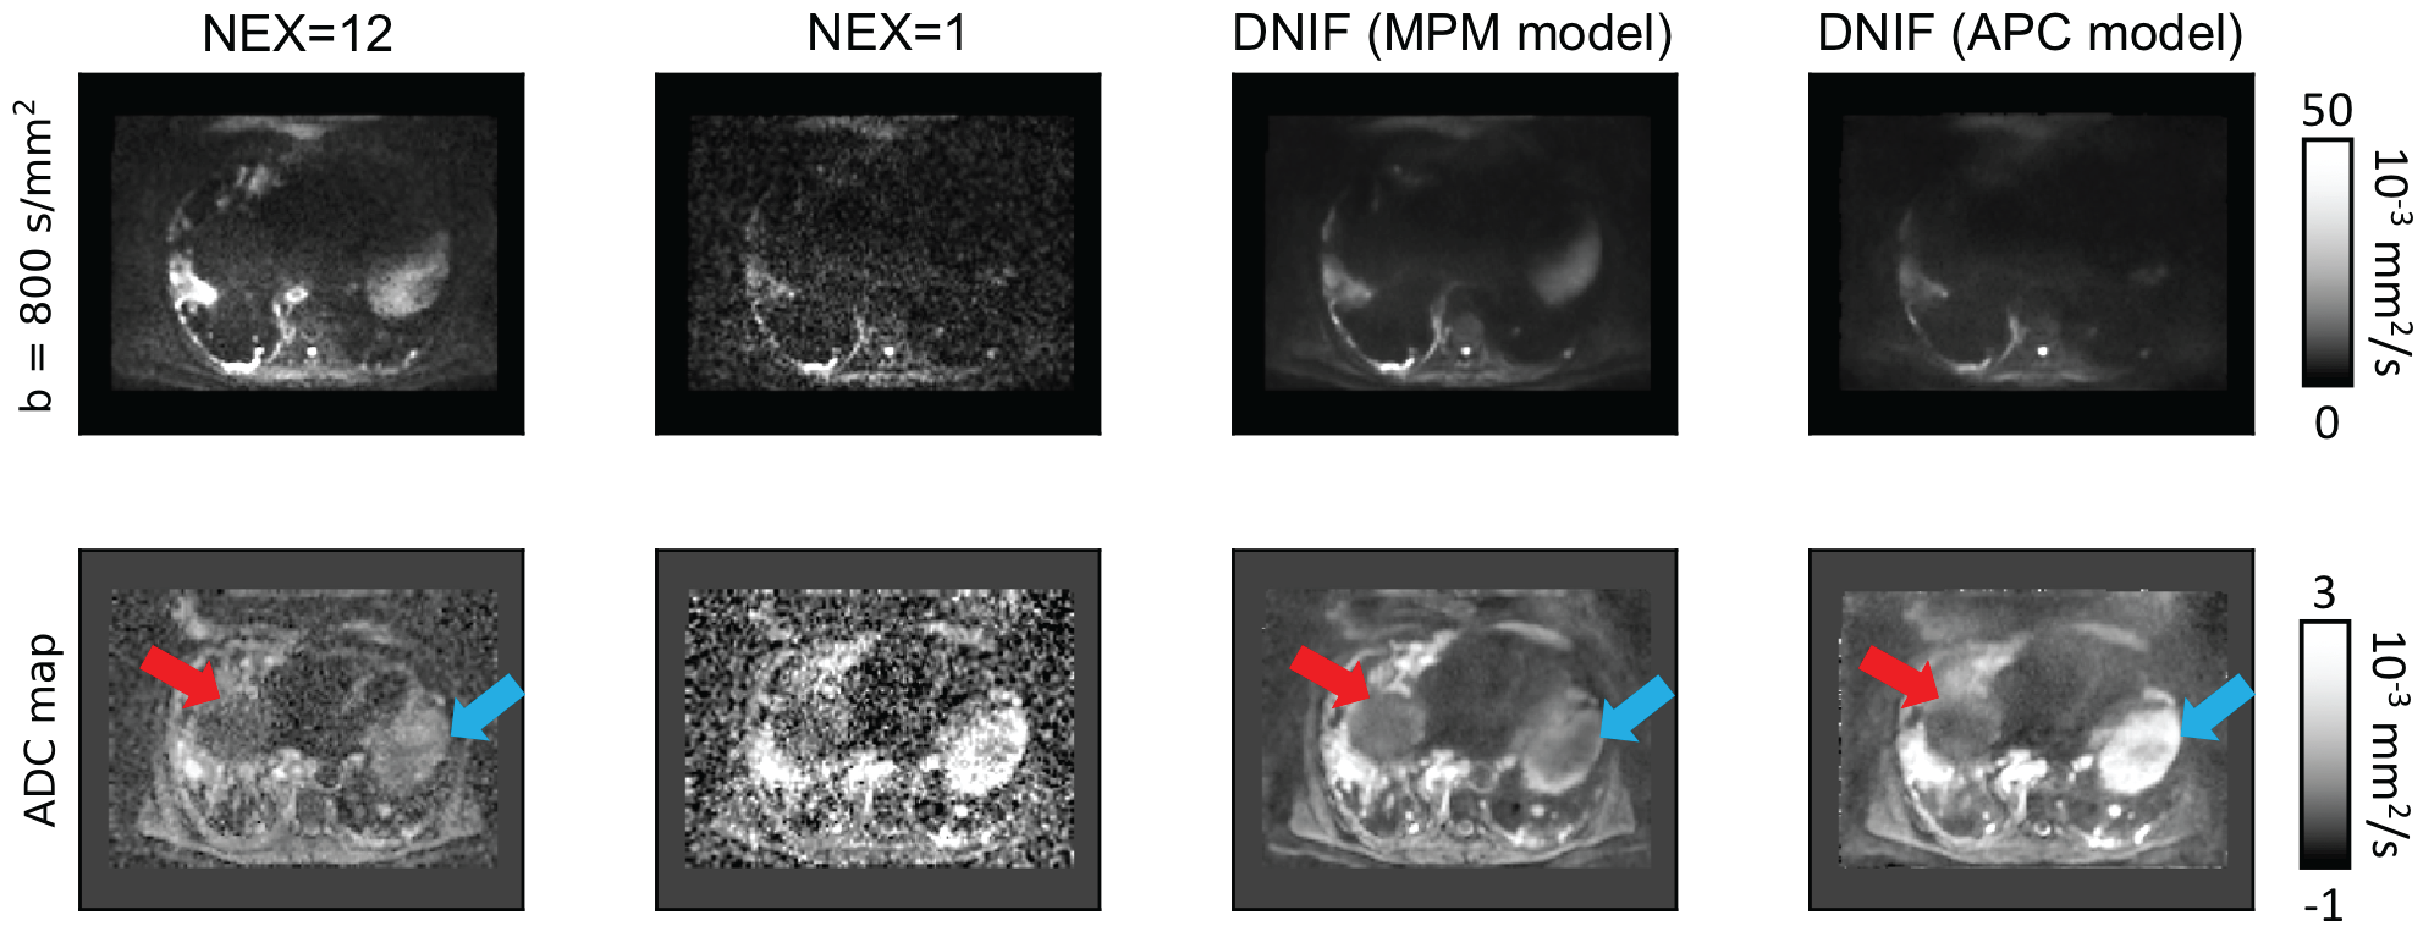
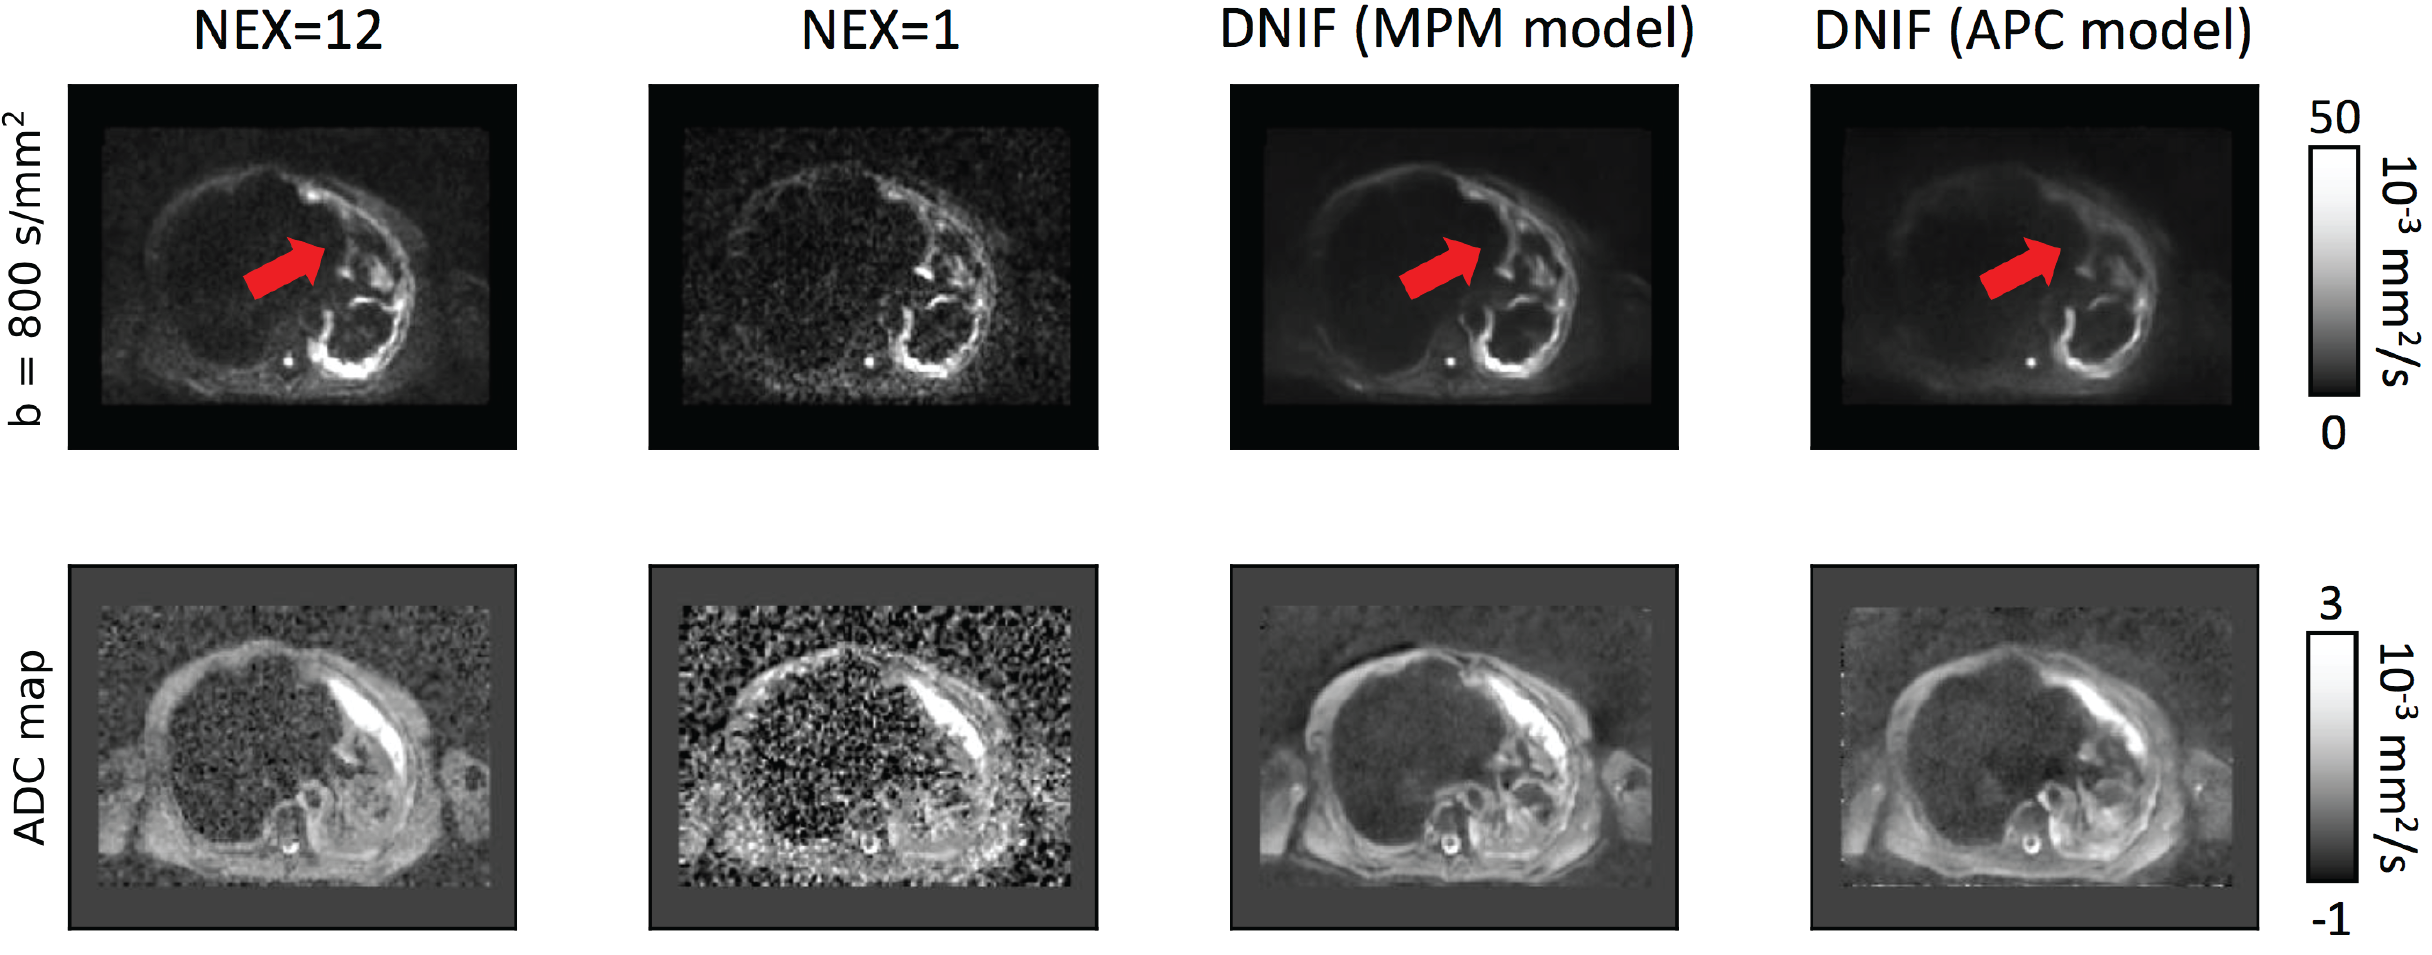
APC Cohort: Example images of the DNIF filter applied to the test patients are illustrated in Figure 2. It is clear that the DNIF filter is able to successfully reduce the influence of imaging noise in the input NeX = 1 image. This noise reduction also leads to superior image quality in calculated ADC maps. Mean ADC values measured within bone disease (segmented using a semi-automated approach3) from DNIF-generated images deviated from mean disease ADC calculated from gold-standard NeX=9 images by an average of 2.2% [range: 0.2-4.4] (within previously reported repeatability limits for mean ADC measurements).MPM Cohort: The quality of DNIF-generated images for 2/8 test patients using b=800 s/mm2 and calculated ADC maps is visually compared to the clinical standard in Figures 3 and 4. While the original DNIF derived from the APC cohort resulted in higher quality images, further improvements could be achieved by re-training our network on the MPM data itself. Equivalent results were seen for all other test patients in this study.
Discussion & Conclusion
By using deep-learning methods it is possible to radically improve the quality of DWI acquired using very fast acquisition times (a potential reduction in acquisitions time by a factors of 9-12 in our examples). The data required to train our network can be acquired on any clinical scanner, and does not require specialised imaging protocols or access to raw data. We also provide initial evidence that the ADC values generated using our DNIF approach may be robust enough for assessing longitudinal changes following therapy, since the calculated ADC using DNIF compared with the ADC derived from conventionally acquired DWI is within the error of measurement repeatability. However, this requires further validation. We have also demonstrated that such networks can be applied to multiple anatomical sites, though further improvements can be made by acquiring training data specific to that disease/region. The time savings afforded by such approaches will reduce scanning durations and costs, rendering DWI appropriate for screening studies and sparing patient discomfort.Acknowledgements
We acknowledge CRUK and EPSRC support to the Cancer Imaging Centre at ICR and RMH in association with MRC and Department of Health C1060/A10334, C1060/A16464 and NHS funding to the NIHR Biomedical Research Centre and the NIHR Royal Marsden Clinical Research Facility, Rosetrees Trust and Children with Cancer UK. This report is independent research funded by the National Institute for Health Research. The views expressed in this publication are those of the author(s) and not necessarily those of the NHS, the National Institute for Health Research or the Department of Health.References
1. Koh, D-M, et al. "Whole-body diffusion-weighted MRI: tips, tricks, and pitfalls." American Journal of Roentgenology 199.2 (2012): 252-262.
2. Blackledge, M. D., et al. "Assessment of treatment response by total tumor volume and global apparent diffusion coefficient using diffusion-weighted MRI in patients with metastatic bone disease: a feasibility study." PloS one 9.4 (2014): e91779.
3. Messiou, C., et al. "Guidelines for acquisition, interpretation, and reporting of whole-body MRI in myeloma: myeloma response assessment and diagnosis system (MY-RADS)." Radiology 291.1 (2019): 5-13.
4. Cheng, L., et al. "Response evaluation in mesothelioma: beyond RECIST." Lung Cancer 90.3 (2015): 433-441.
5. Ronneberger, O., Fischer P., and Brox T. "U-net: Convolutional networks for biomedical image segmentation." International Conference on Medical image computing and computer-assisted intervention. Springer, Cham, 2015.
Figures