0960
Acquiring and predicting MUlti-dimensional DIffusion (MUDI) data: an open challenge1Signal Processing Lab (LTS5), École Polytechnique Fédérale de Lausanne, Lausanne, Switzerland, 2Department of Computer Science, Centre for Medical Image Computing, University College London, London, United Kingdom, 3BCNatal Fetal Medicine Research Center, Barcelona, Spain, 4Queen Square MS Centre, UCL Queen Square Institute of Neurology, Faculty of Brain Sciences, University College London, London, United Kingdom, 5Champalimaud Research, Champalimaud Centre for the Unknown, Lisbon, Portugal, 6AGH University of Science and Technology, Kraków, Poland, 7Laboratorio de Procesado de Imagen (LPI), Universidad de Valladolid, Valladolid, Spain, 8Brigham and Women’s Hospital, Harvard Medical School, Boston, MA, United States, 9Cardiff University Brain Research Imaging Center (CUBRIC), School of Psychology, University of Cardiff, Cardiff, United Kingdom, 10Mary MacKillop Institute for Health Research, Faculty of Health Sciences, Australian Catholic University, Melbourne, Australia, 11Center for Biomedical Imaging, Dept. of Radiology, New York University School of Medicine, New York, NY, United States, 12Center for Advanced Imaging Imaging, Innovation and Research, New York University School of Medicine, New York, NY, United States, 13Centre for Medical Engineering, Centre for the Developing Brain, King's College London, London, United Kingdom, 14Department of Chemistry and Applied Biosciences, ETH Zurich, Zurich, Switzerland, 15Department of Electrical Engineering (ESAT-PSI), KU Leuven, Leuven, Belgium, 16Radiology Department, Centre Hospitalier Universitaire Vaudois and University of Lausanne, Lausanne, Switzerland, 17Laboratory of Neuro Imaging (LONI), USC Stevens Neuroimaging and Informatics Institute, University of Southern California, Los Angeles, CA, United States
Synopsis
The variety of possible combinations of acquisition parameters is key to the versatility of MRI as a diagnostic modality. However, the full exploration of the parameter space defined by b-values, gradient directions, inversion and echo times comes at the expense of the acquisition time. We present the results of an open challenge where different methods were proposed to predict the content of a densely sampled acquisition, which explores such parameter space, from only a subset of parameter combinations. These indicate the possibility of leveraging the redundancy in the data to shorten the acquisition time while minimizing information loss.
Introduction
The variety of combinations of acquisition parameters is one of the key characteristics that place MRI among the most powerful and versatile diagnostic modalities in medical imaging. For instance, different combinations of b-values (b), gradient directions (dir), inversion times (IT), and echo times (TE) lead to the acquisition of images having different contrasts, i.e. images bearing different information. The harnessing of all the possible information form MRI naturally translates to the problem of sampling a high dimensional acquisition parameter space, which quickly leads to the combinatorial explosion of the parameter combinations to use. Although acquisition strategies like ZEBRA1 drastically reduce the acquisition time, a full coverage of the parameter space (b,dir,IT,TE) - yet a subspace of the possible parameters - remains unfeasible within clinical practice. The urge for providing more information within clinically feasible setups motivated the organization of the MUlti-dimensional DIffusion (MUDI) challenge, where participants were called to predict densely fully-sampled data from a limited portion of it. The participants were given the task of defining a subsampling strategy by choosing 500, 250, 100, or 50 volumes from which to predict the remaining ones of the fully-sampled acquisition (1344 volumes). In order to complete the task, each participant was also free to develop the desired prediction method.Methods
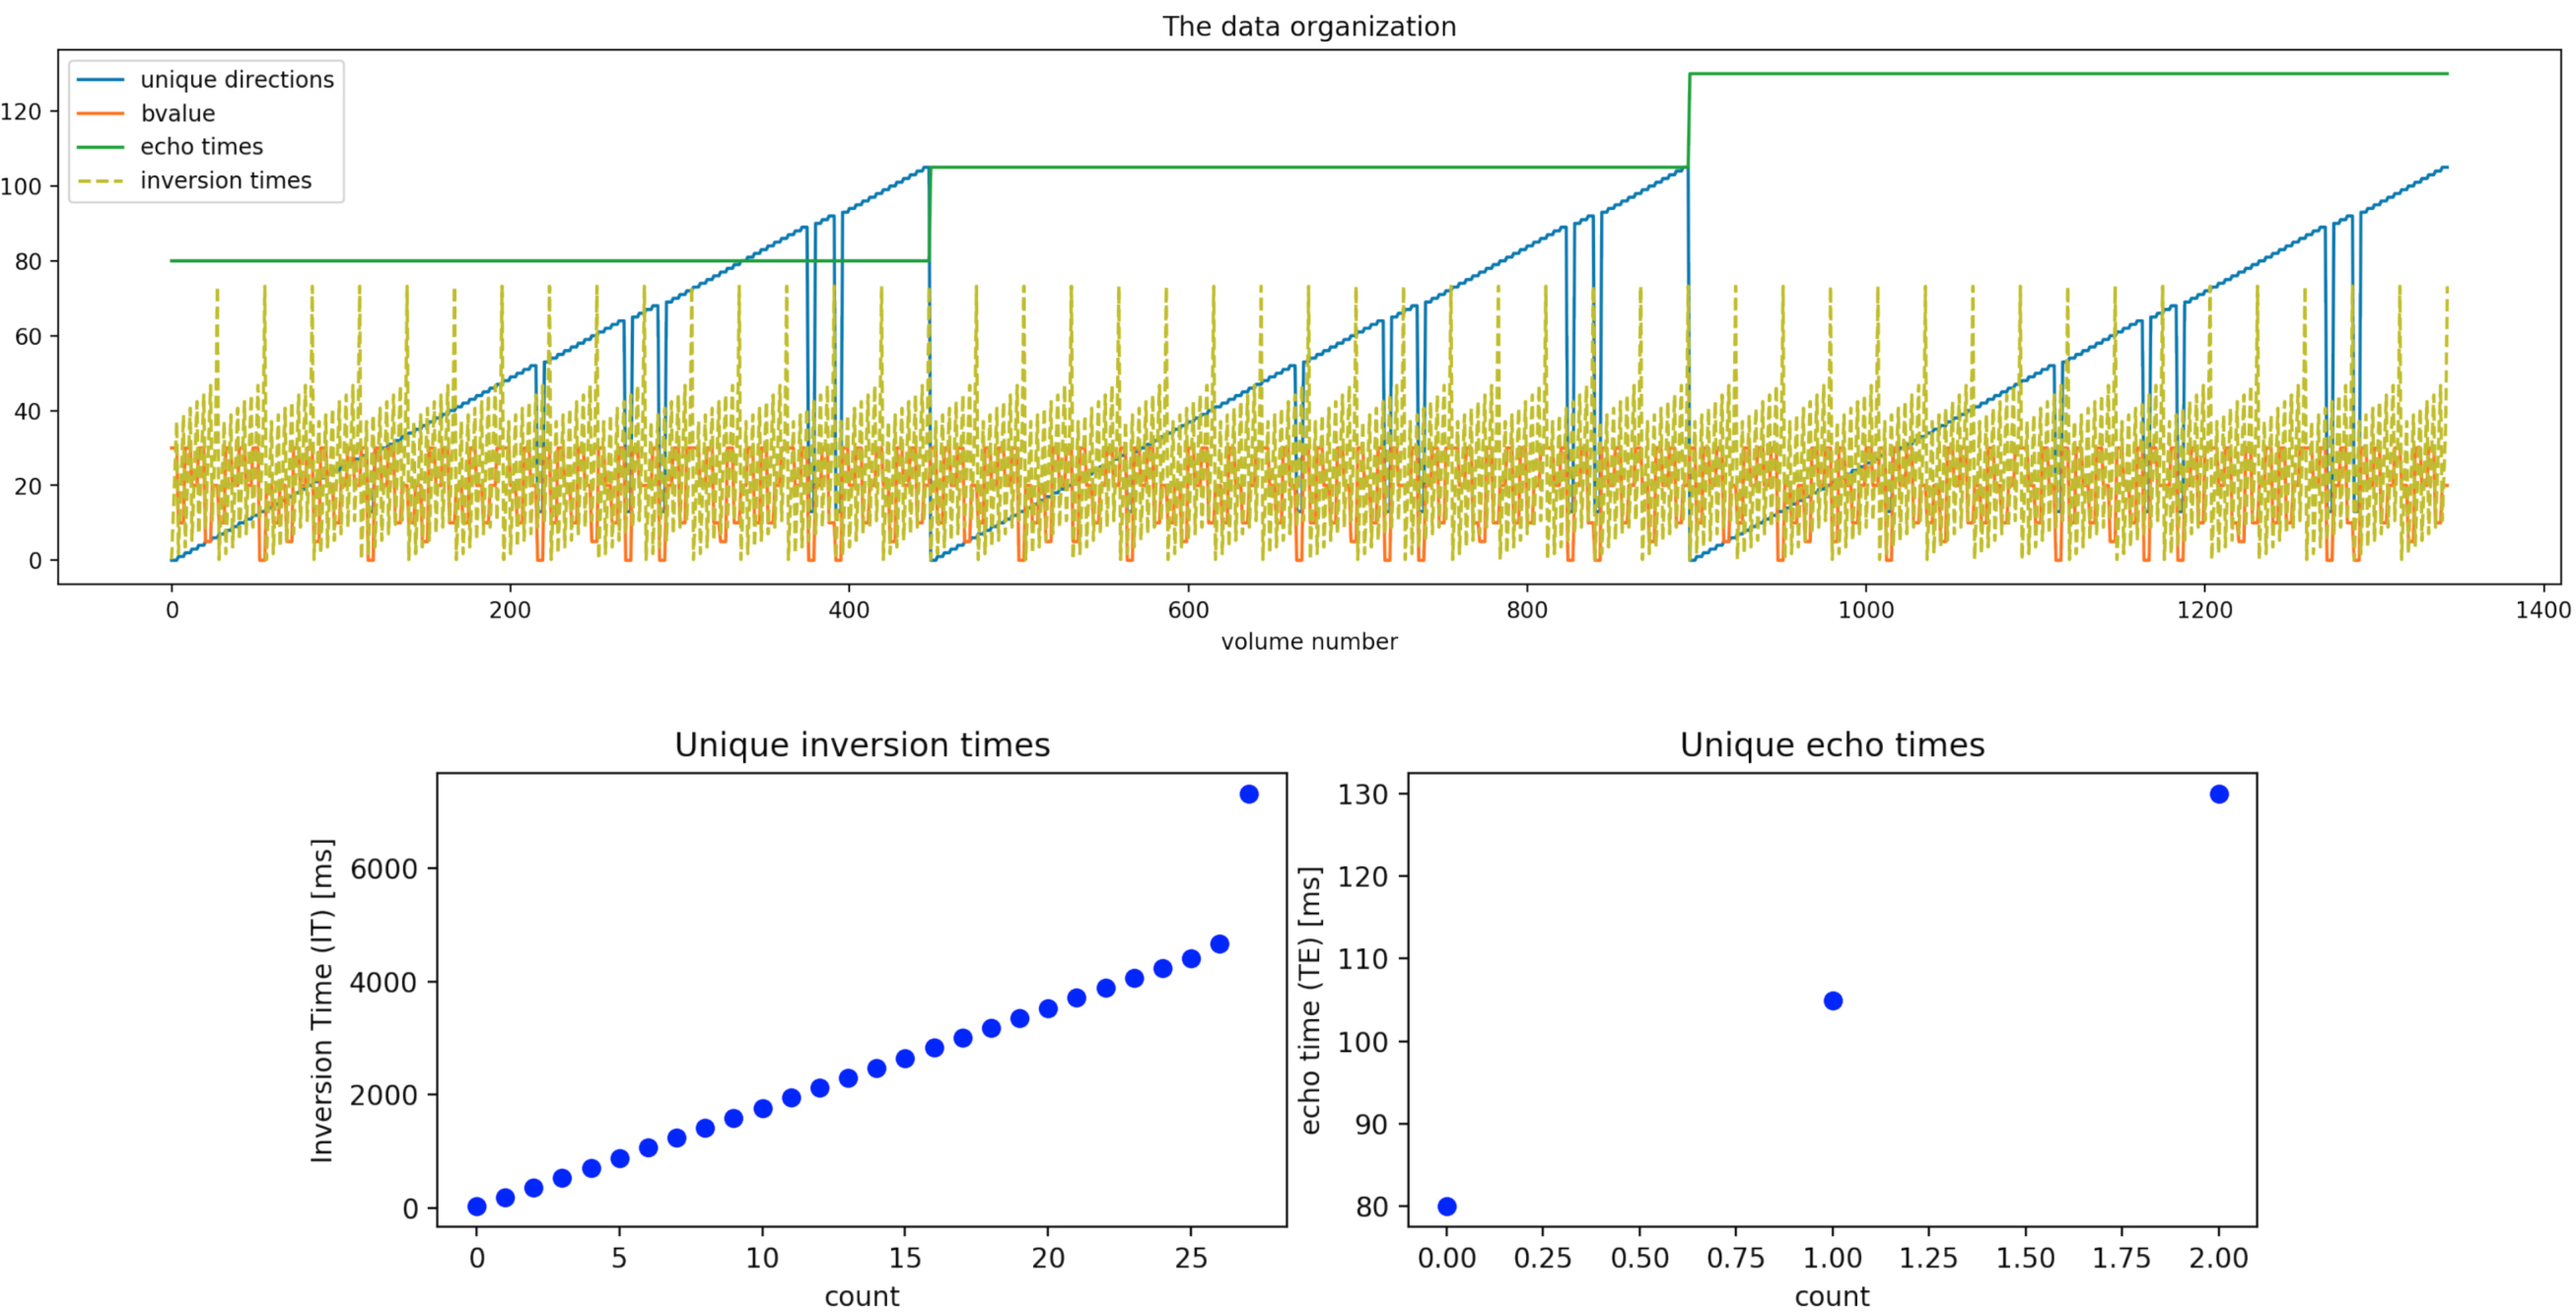
Data. 1344 volumes (Fig. 1) comprising 106 unique gradient directions uniformly spread2 over four b-shells (500, 1000, 2000, 3000 s/mm^2), three TEs, and 28 ITs were acquired from five healthy human volunteers (3 f, 2 m, age= 19-46 years), after informed consent was obtained (REC 12/LO/1247), on a clinical 3T Philips Achieva scanner (Best, Netherlands) with a 32-channel adult head coil. Single-shot PGSE EPI with the modifications proposed with the ZEBRA1 sequence was employed. Other parameters include TR=7.5s, Resolution=2.5mm isotropic, FOV=220x230x140mm, SENSE=1.9, halfscan=0.7, Multiband factor 2, TA=52min (including prep time).Preprocessing. Data was reconstructed and denoised in the complex domain3. Ad hoc affine volume registration was performed: collinear magnitude diffusion-weighted images (DWIs) acquired with different pairs (IT,TE) were first co-registered together using the highest IT and lowest TE volume as reference; the 106 reference volumes were then registered together based on a mutual information metric using Dipy4, and the registrations were then propagated across the corresponding collinear DWIs. Data was collected with reversed phase-encode blips to allow for susceptibility-induced distortion correction5,6 using FSL.
Tasks. Three fully-sampled datasets were given to participants as training data, such that they could use them to propose a subsampling strategy based on 500 samples/volumes. In a second phase, participants were asked to provide the indexes of the desired 500 volumes, each having a different set (b,dir,IT,TE). Then, only the 500 volumes of two test subjects were provided to each participant. Finally, participants were asked to submit their prediction of the remaining 1344-500 volumes. Additionally, participants were asked to select X = 250, 100, and 50 volumes subsets of the 500, and again predict the 1344-X remaining ones.
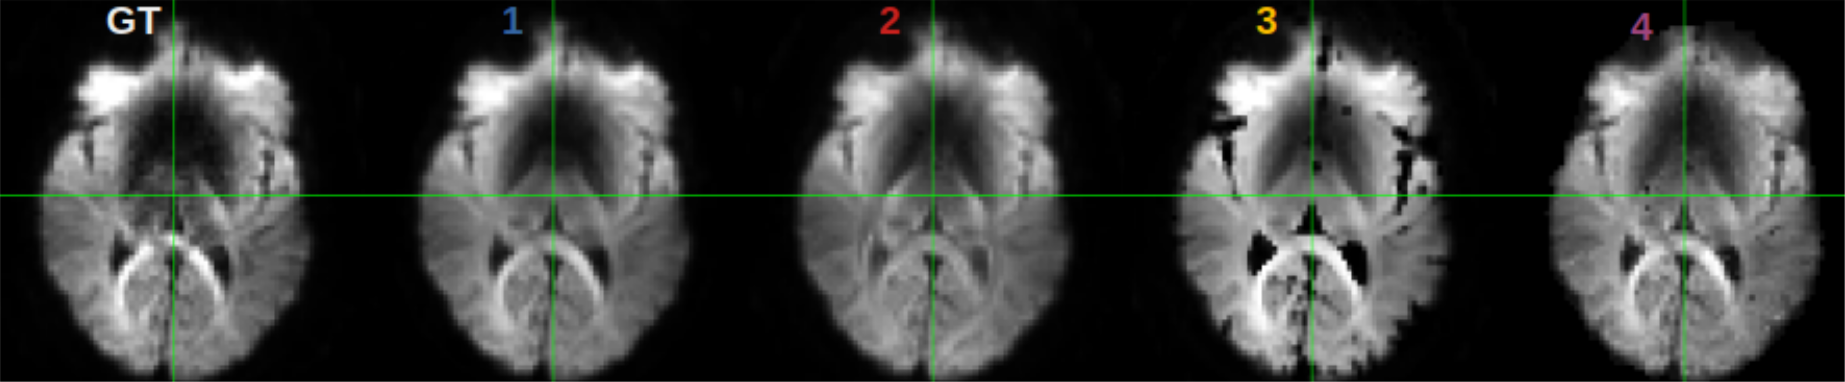
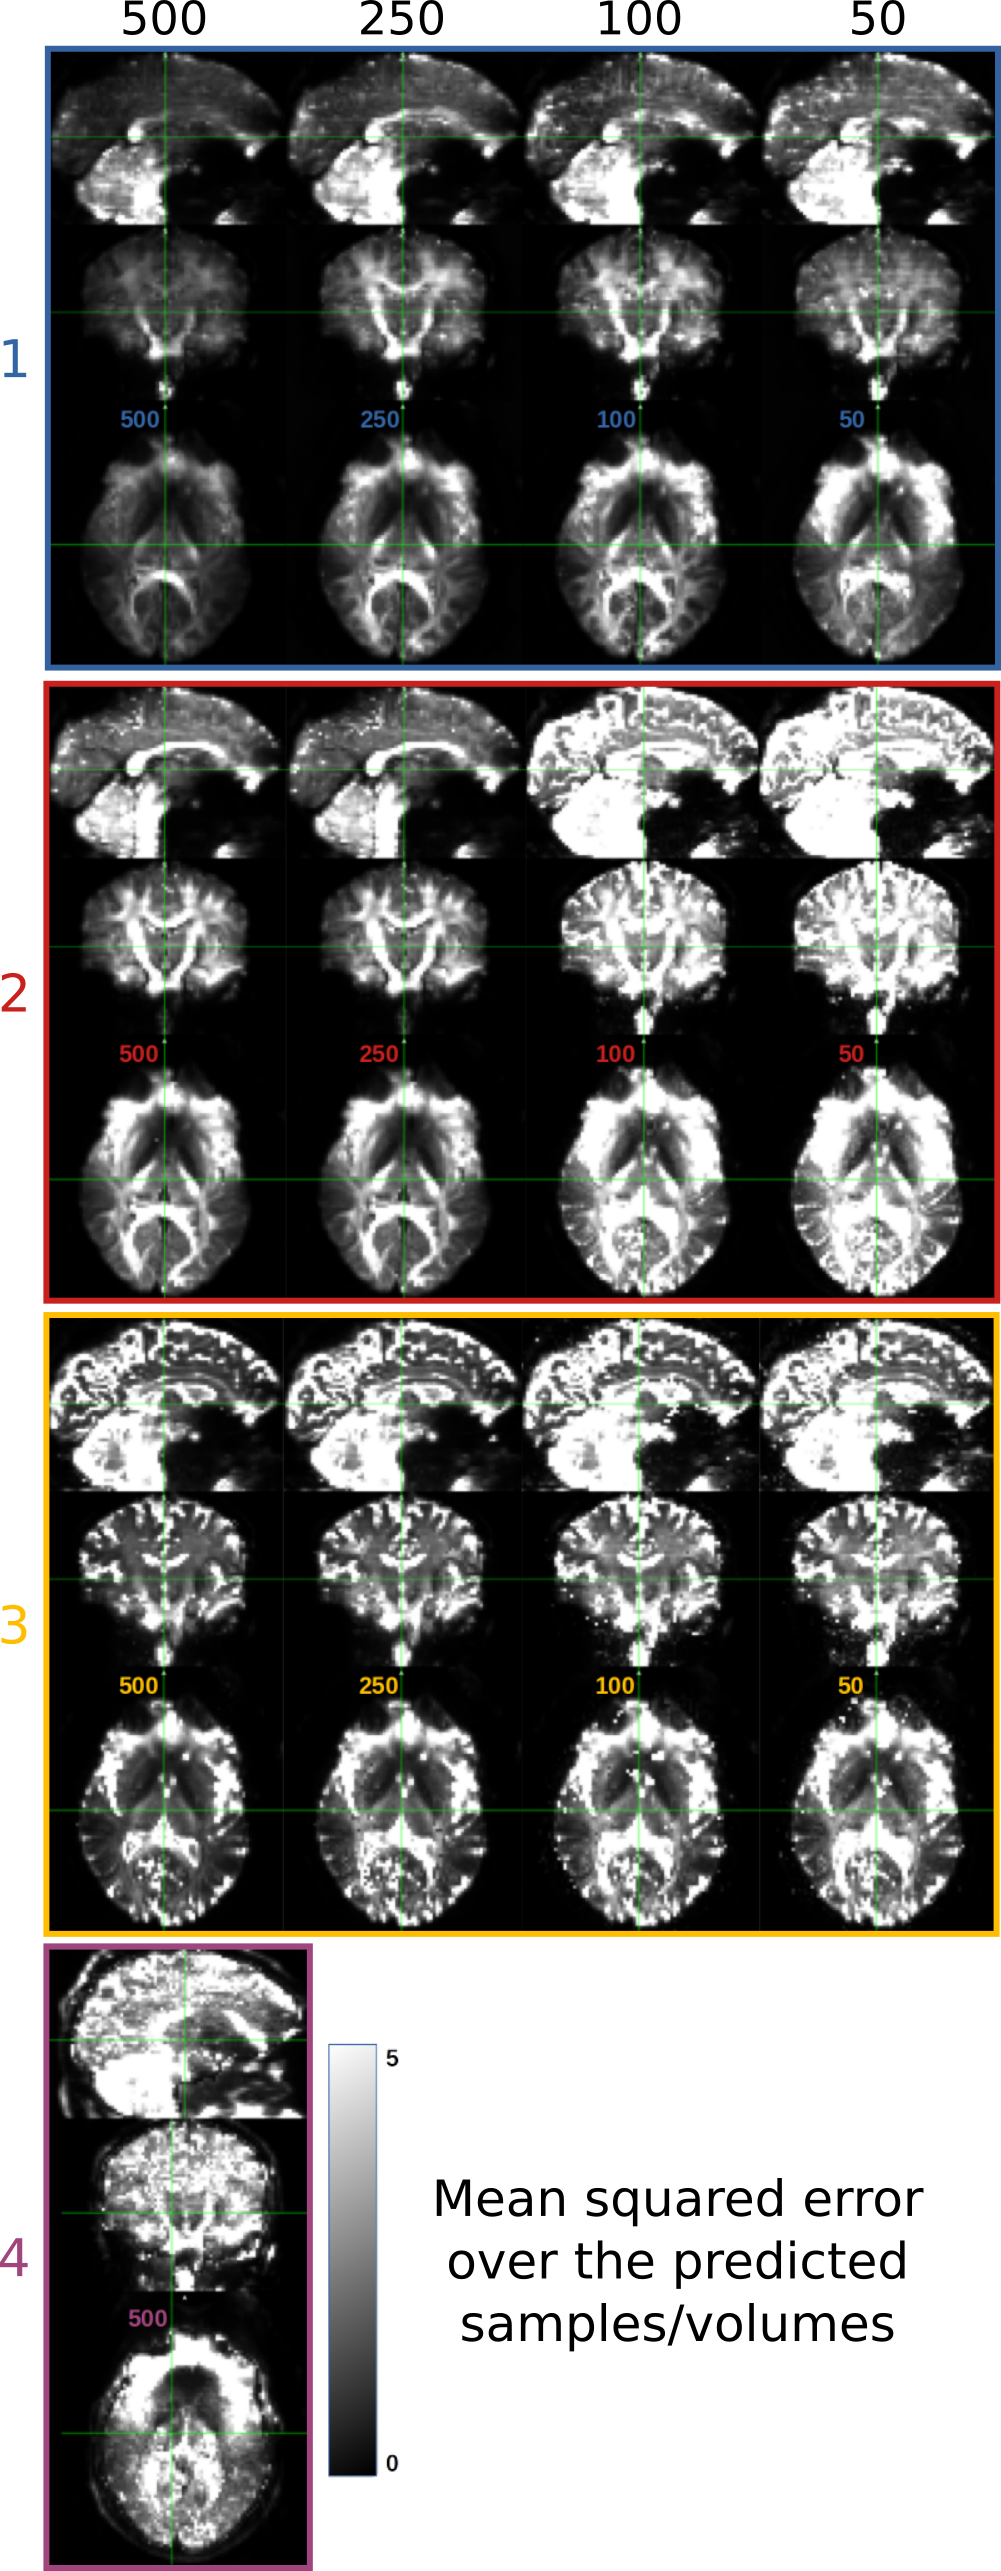
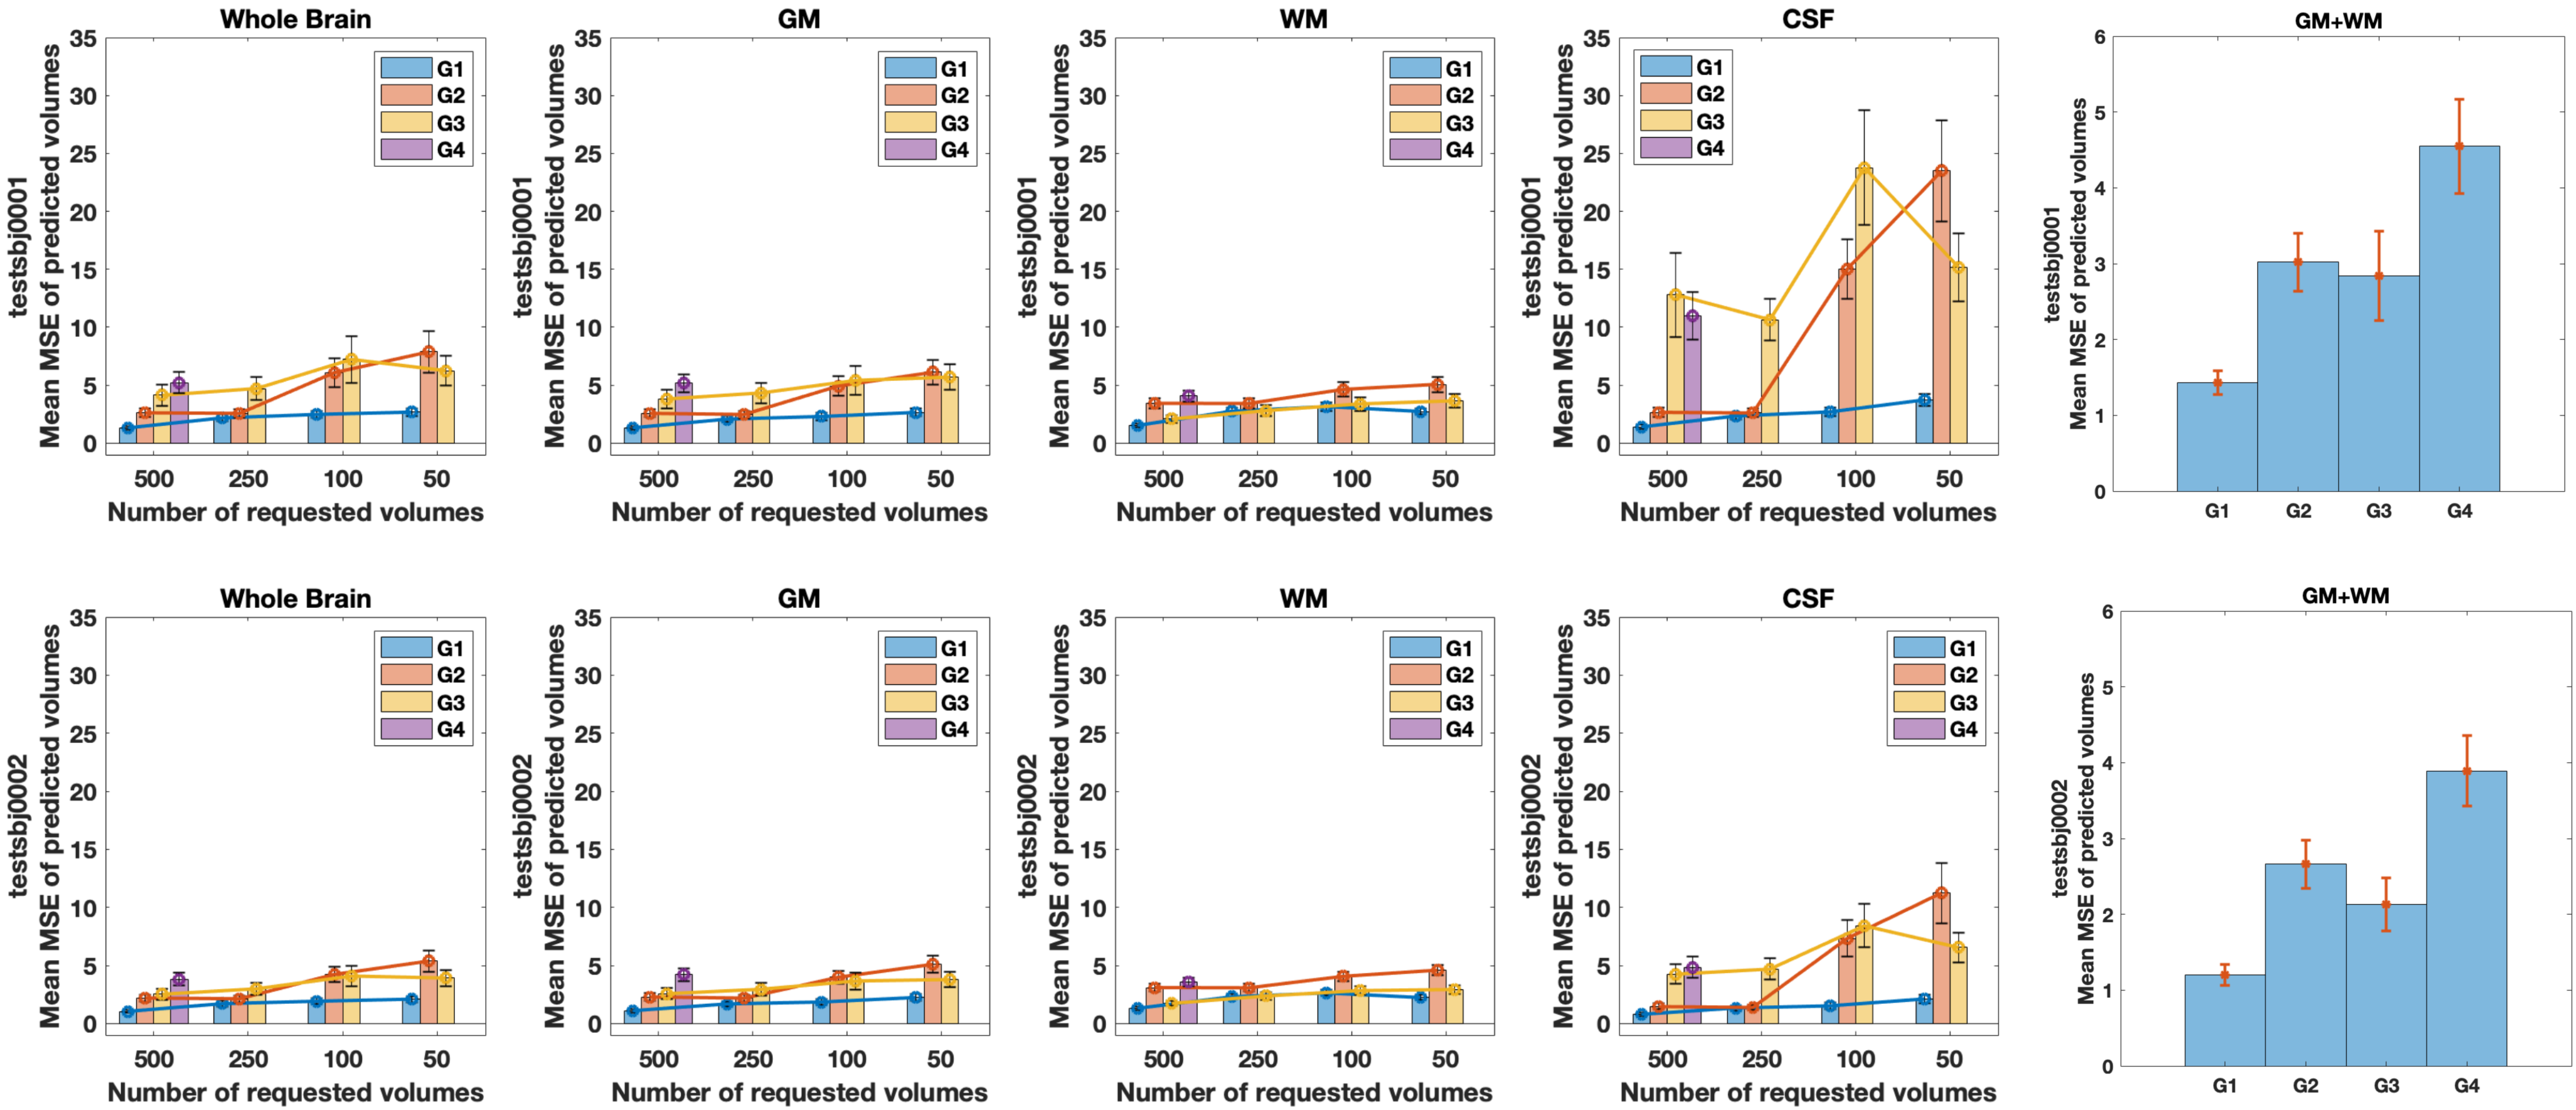
Evaluation. The prediction error was evaluated, for each submission, by calculating the mean squared error (MSE) between the predicted volumes and the corresponding acquired ones that were unknown to the participant. A comparative analysis of the MSE on brain, white matter (WM), gray matter (GM), and cerebrospinal fluid (CSF) masks was performed.
Results
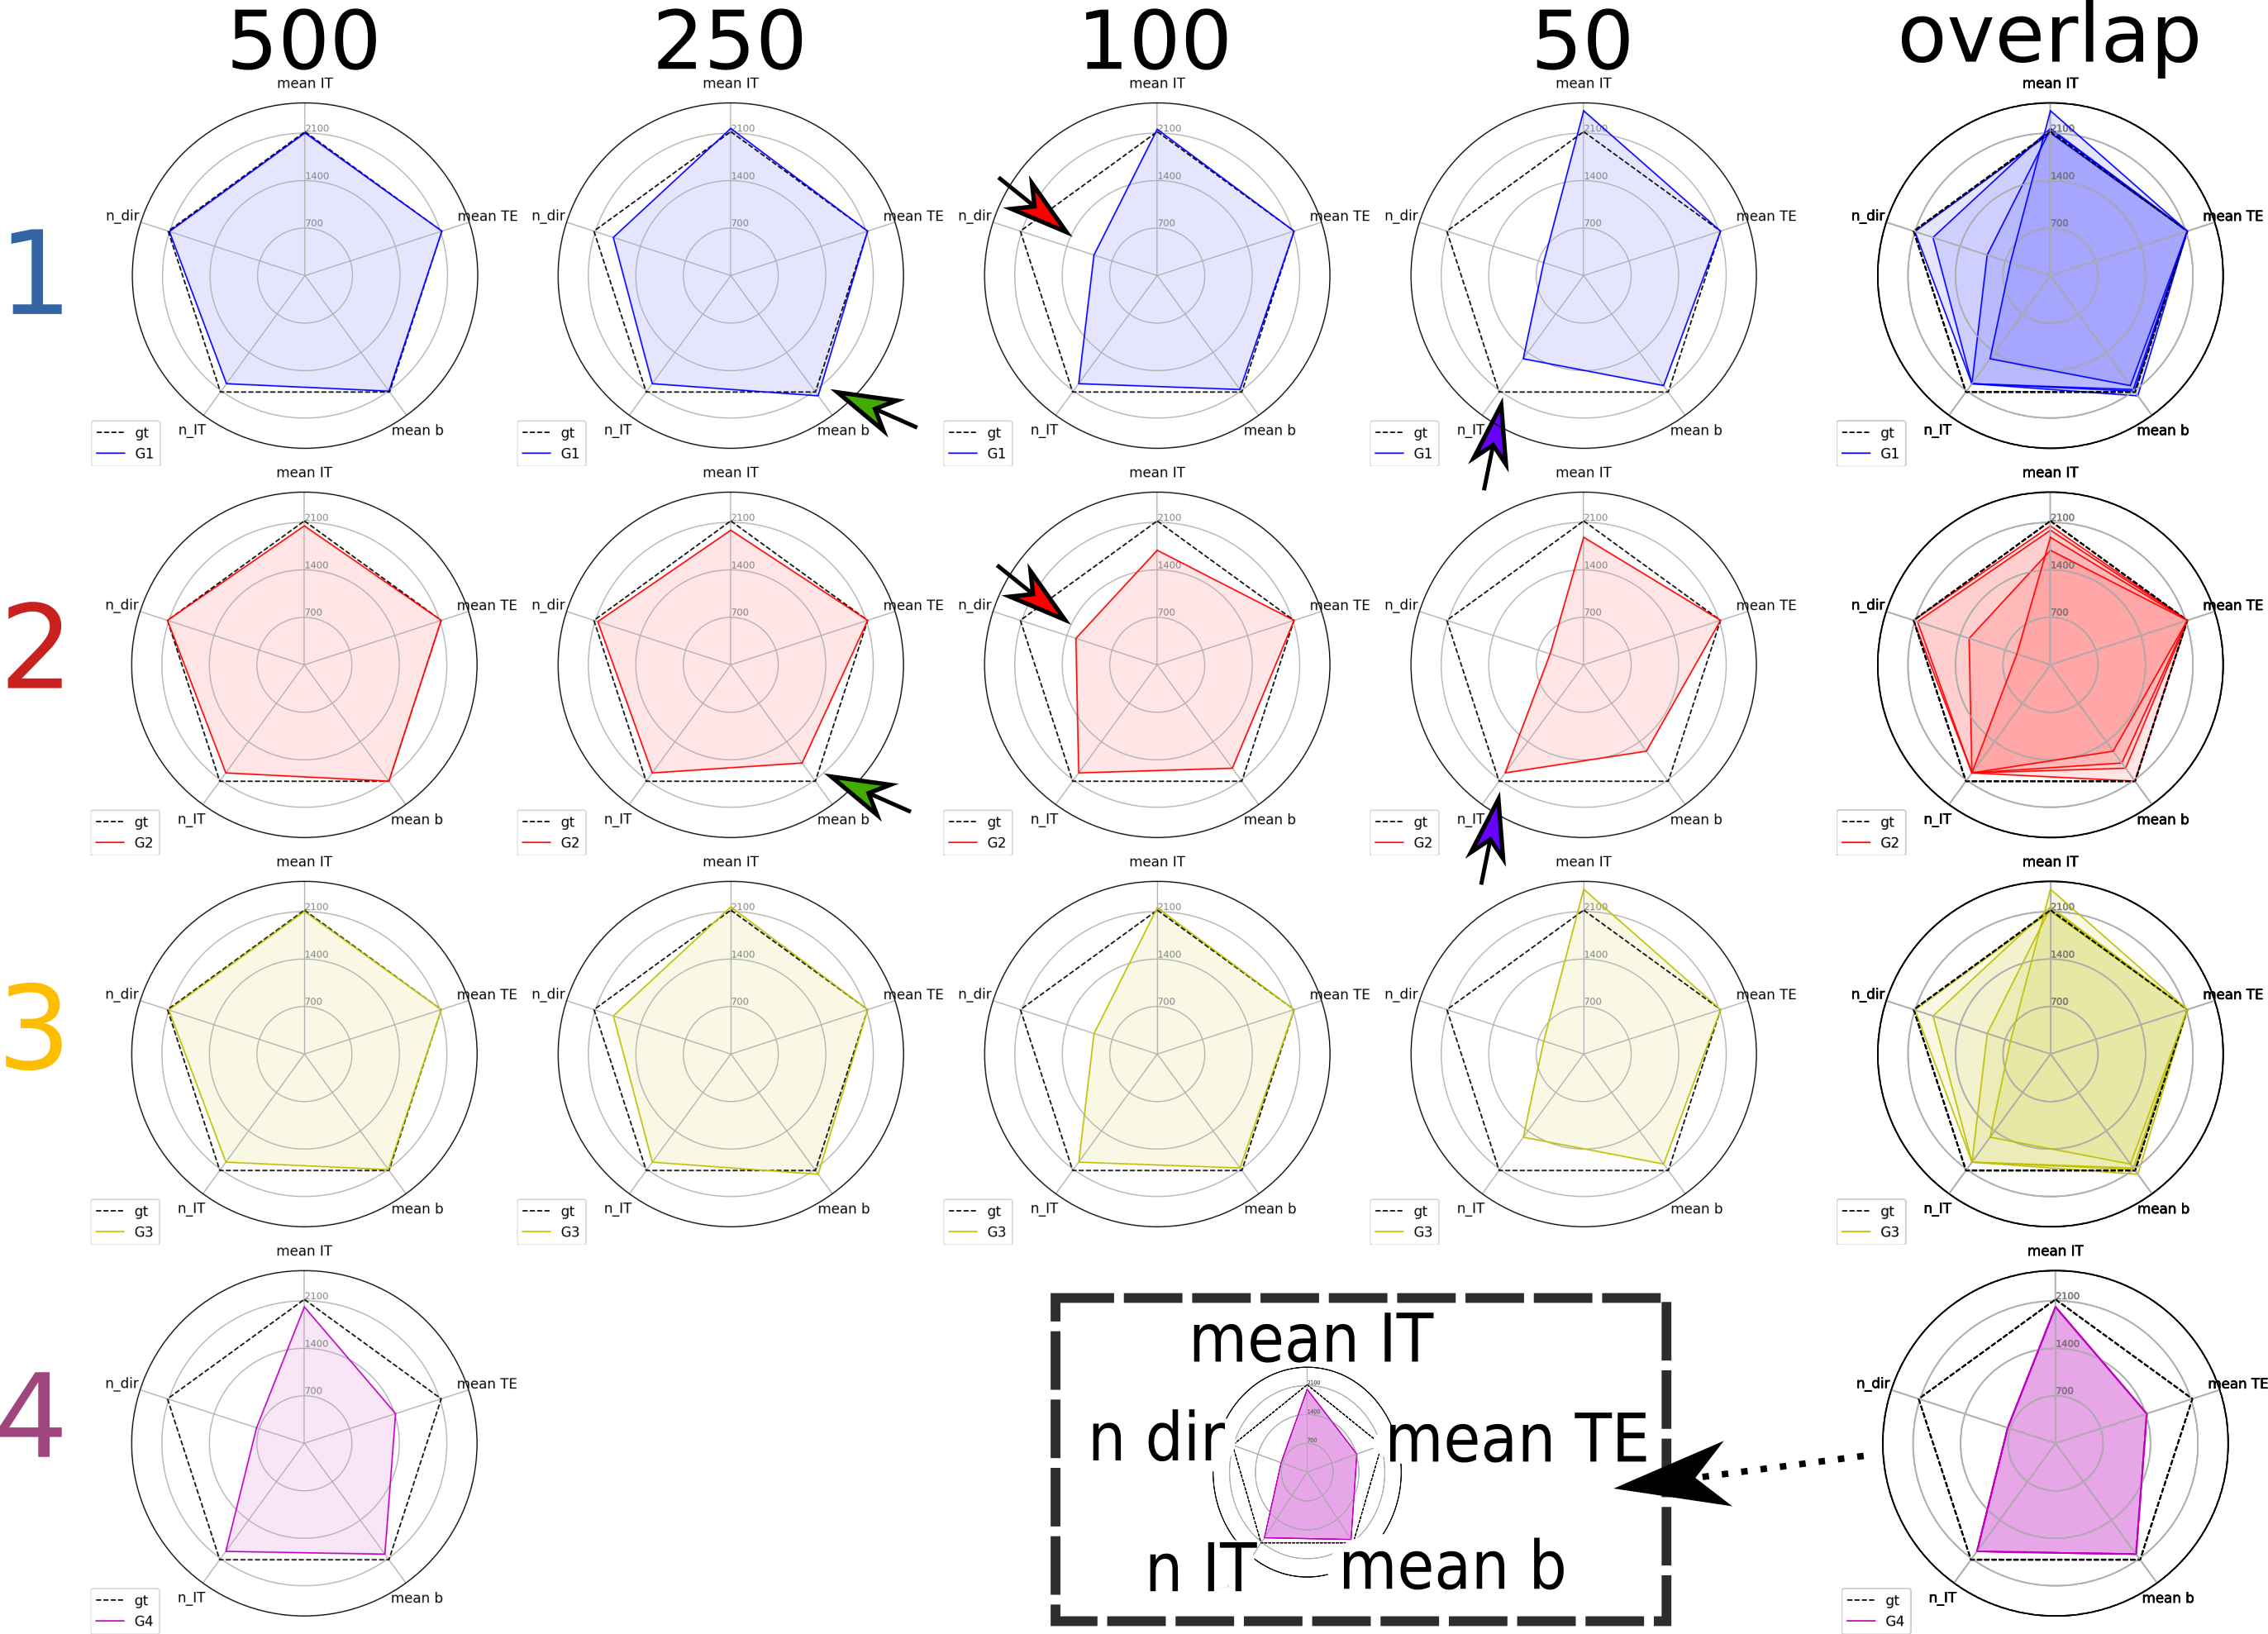
So far four groups have submitted their predictions. Fig. 2 reports charts illustrating the characteristics of the submitted subsampling strategies with respect to those of the fully-sampled datasets. Four different prediction methods were proposed based on:- a combination of two multilayer, feedforward, fully-connected deep neural networks that optimise jointly the task of selecting a subset of measurements and predicting back the fully-sampled signal from those;
- modeling a single relaxation compartment (estimating the inversion efficiency) while representing diffusion through an analytical distribution of diffusivities leading to the inclusion of a Kurtosis term7;
- modeling a single relaxation compartment using DTI8 for diffusion, with measurements selected as in 1;
- modeling moments of the joint relaxation and diffusion probability distribution.
Discussion and conclusion
Results indicate method 1, based on machine learning, as the most predictive and stable so far. The proposed modeling-based strategies, primarily designed to enable more explicit descriptions of the physical phenomenon, might be affected by the difficulty of balancing model complexity and prediction performance. For instance, assuming one relaxation compartment (2 and 3) can oversimplify the fit while including more variability (4) can destabilize it. Nevertheless, the results indicate the possibility of leveraging redundancy in the data, potentially enabling shorter acquisition times, while limiting information loss.Acknowledgements
MPiz acknowledges support from the Swiss National Science Foundation under Sinergia grant number CRSII5_170873. EB-C is partially supported by the Cerebra Foundation for the Brain Injured Child (Carmarthen, Wales, UK). FB and TP acknowledge AGH Science and Technology, Kraków, Poland (16.16.120.773).. MA and DKJ were supported by a Wellcome Trust Investigator Award (096646/Z/11/Z) and a Wellcome Trust Strategic Award (104943/Z/14/Z). SHB is supported in part by the National Institutes of Health (NIH, R01-CA111996, R01-NS082436, R01-MH00380 and P41EB017183). MPal, FG, DCA, TM and SBB acknowledge support from the UK EPSRC (EP/M020533/1, EP/N018702/1, EP/R006032/1), EU Horizon 2020 (634541-2), NIH (Placenta imaging Project); Grant number: 1U01HD087202-01. AI acknowledges support from the Champalimaud Centre for the Unknown. LN is supported in part by NIH grants R21MH116352, R21MH115280, K01MH117346. DC is supported by the Flemish Research Foundation (FWO; grant number 12ZV420N). FZ is supported by the following NIH grants: P41EB015898, R01MH108574, P41EB015902, R01MH119222. JH was supported by the Wellcome Trust (Sir Henry Wellcome Fellowship, [201374/Z/16/Z] [201374/Z/16/B]), and the Wellcome/EPSRC Centre for Medical Engineering [WT 203148/Z/16/Z].References
1- Hutter, J., Slator, P. J., Christiaens, D., Teixeira, R. P. A., Roberts, T., Jackson, L., Price, A.N., Malik, S. & Hajnal, J. V. (2018). Integrated and efficient diffusion-relaxometry using ZEBRA. Scientific reports, 8(1), 15138.
2 - Jones, D. K., Horsfield, M. A., & Simmons, A. (1999). Optimal strategies for measuring diffusion in anisotropic systems by magnetic resonance imaging. Magnetic Resonance in Medicine: An Official Journal of the International Society for Magnetic Resonance in Medicine, 42(3), 515-525.
3 - Cordero-Grande, L., Christiaens, D., Hutter, J., Price, A. N., & Hajnal, J. V. (2019). Complex diffusion-weighted image estimation via matrix recovery under general noise models. NeuroImage.
4 - Garyfallidis, E., Brett, M., Amirbekian, B., Rokem, A., Van Der Walt, S., Descoteaux, M., & Nimmo-Smith, I. (2014). Dipy, a library for the analysis of diffusion MRI data. Frontiers in neuroinformatics, 8, 8.
5 - Andersson, J. L., Skare, S., & Ashburner, J. (2003). How to correct susceptibility distortions in spin-echo echo-planar images: application to diffusion tensor imaging. Neuroimage, 20(2), 870-888.
6 - Smith, S. M., Jenkinson, M., Woolrich, M. W., Beckmann, C. F., Behrens, T. E., Johansen-Berg, H., ... & Niazy, R. K. (2004). Advances in functional and structural MR image analysis and implementation as FSL. Neuroimage, 23, S208-S219.
7 - Jensen, J. H., & Helpern, J. A. (2010). MRI quantification of non‐Gaussian water diffusion by kurtosis analysis. NMR in Biomedicine, 23(7), 698-710.
8 - Basser, Peter J., James Mattiello, and Denis LeBihan. "MR diffusion tensor spectroscopy and imaging." Biophysical journal 66.1 (1994): 259-267.
Figures