0959
Stay on the beat: tuning in on time-dependent diffusion in the heart1Danish Research Centre for Magnetic Resonance, Centre for Functional and Diagnostic Imaging and Research, Copenhagen University Hospital Hvidovre, Hvidovre, Denmark, 2Random Walk Imaging AB, Lund, Denmark, 3Clinical Sciences, Lund University, Lund, Sweden, 4Harvard Medical School, Boston, MA, United States, 5Brigham and Women's Hospital, Boston, MA, United States, 6Physical Chemistry, Lund University, Lund, Sweden, 7Leeds Institute of Cardiovascular and Metabolic Medicine, University of Leeds, Leeds, United Kingdom
Synopsis
Diffusion encoding with general gradient waveforms provides flexibility and experimental efficiency for multidimensional diffusion encoding (MDE). Here we investigate b-tensor shape and spectral content as two independent measurement dimensions for imaging myocardial microstructure. By tuning spectral content, we demonstrate that time-dependent diffusion can be controlled for across b-tensor shapes and that tuning in itself provide a strong image contrast in a clinically feasible setting. For encoding high frequencies alone, our isotropic encoding provides higher experimental efficiency.
Introduction
Diffusion MRI (dMRI) provides useful insight into myocardial microstructure with a number of potential clinical applications. As cardiomyocytes are in the order of 10 µm and above in diameter, time dependent diffusion effects can potentially be large in the range of diffusion times probed by dMRI1. Conventionally performed with pulsed gradients in single directions, diffusion weighting with general gradient waveforms provide flexibility and efficiency for multidimensional diffusion encoding (MDE)2. For instance, by varying the shape of the diffusion encoding b-tensor, multi-Gaussian diffusion can be decomposed into mean shape and variance in size of underlying diffusion tensors3,4. When time-dependent diffusion is considered, not only the b-tensor shape but also the temporal evolution of the gradient waveform can influence the extracted apparent mean diffusivity (MD). Extending on the frequency domain analysis introduced by Stepisnik5, we recently suggested the concept of tuning for designing waveforms with e.g. different b-tensor shape but similar sensitivity to time-dependent diffusion6. Moreover, detuned waveforms can be used to isolate time dependent diffusion independently providing specificity to e.g. both anisotropy and restrictions. Here we investigate the effect of tuning in post mortem pig hearts on a clinical scanner. We demonstrate that tuning provides similar MD across different b-tensor shapes and that detuning gives a consistent contrast.Methods
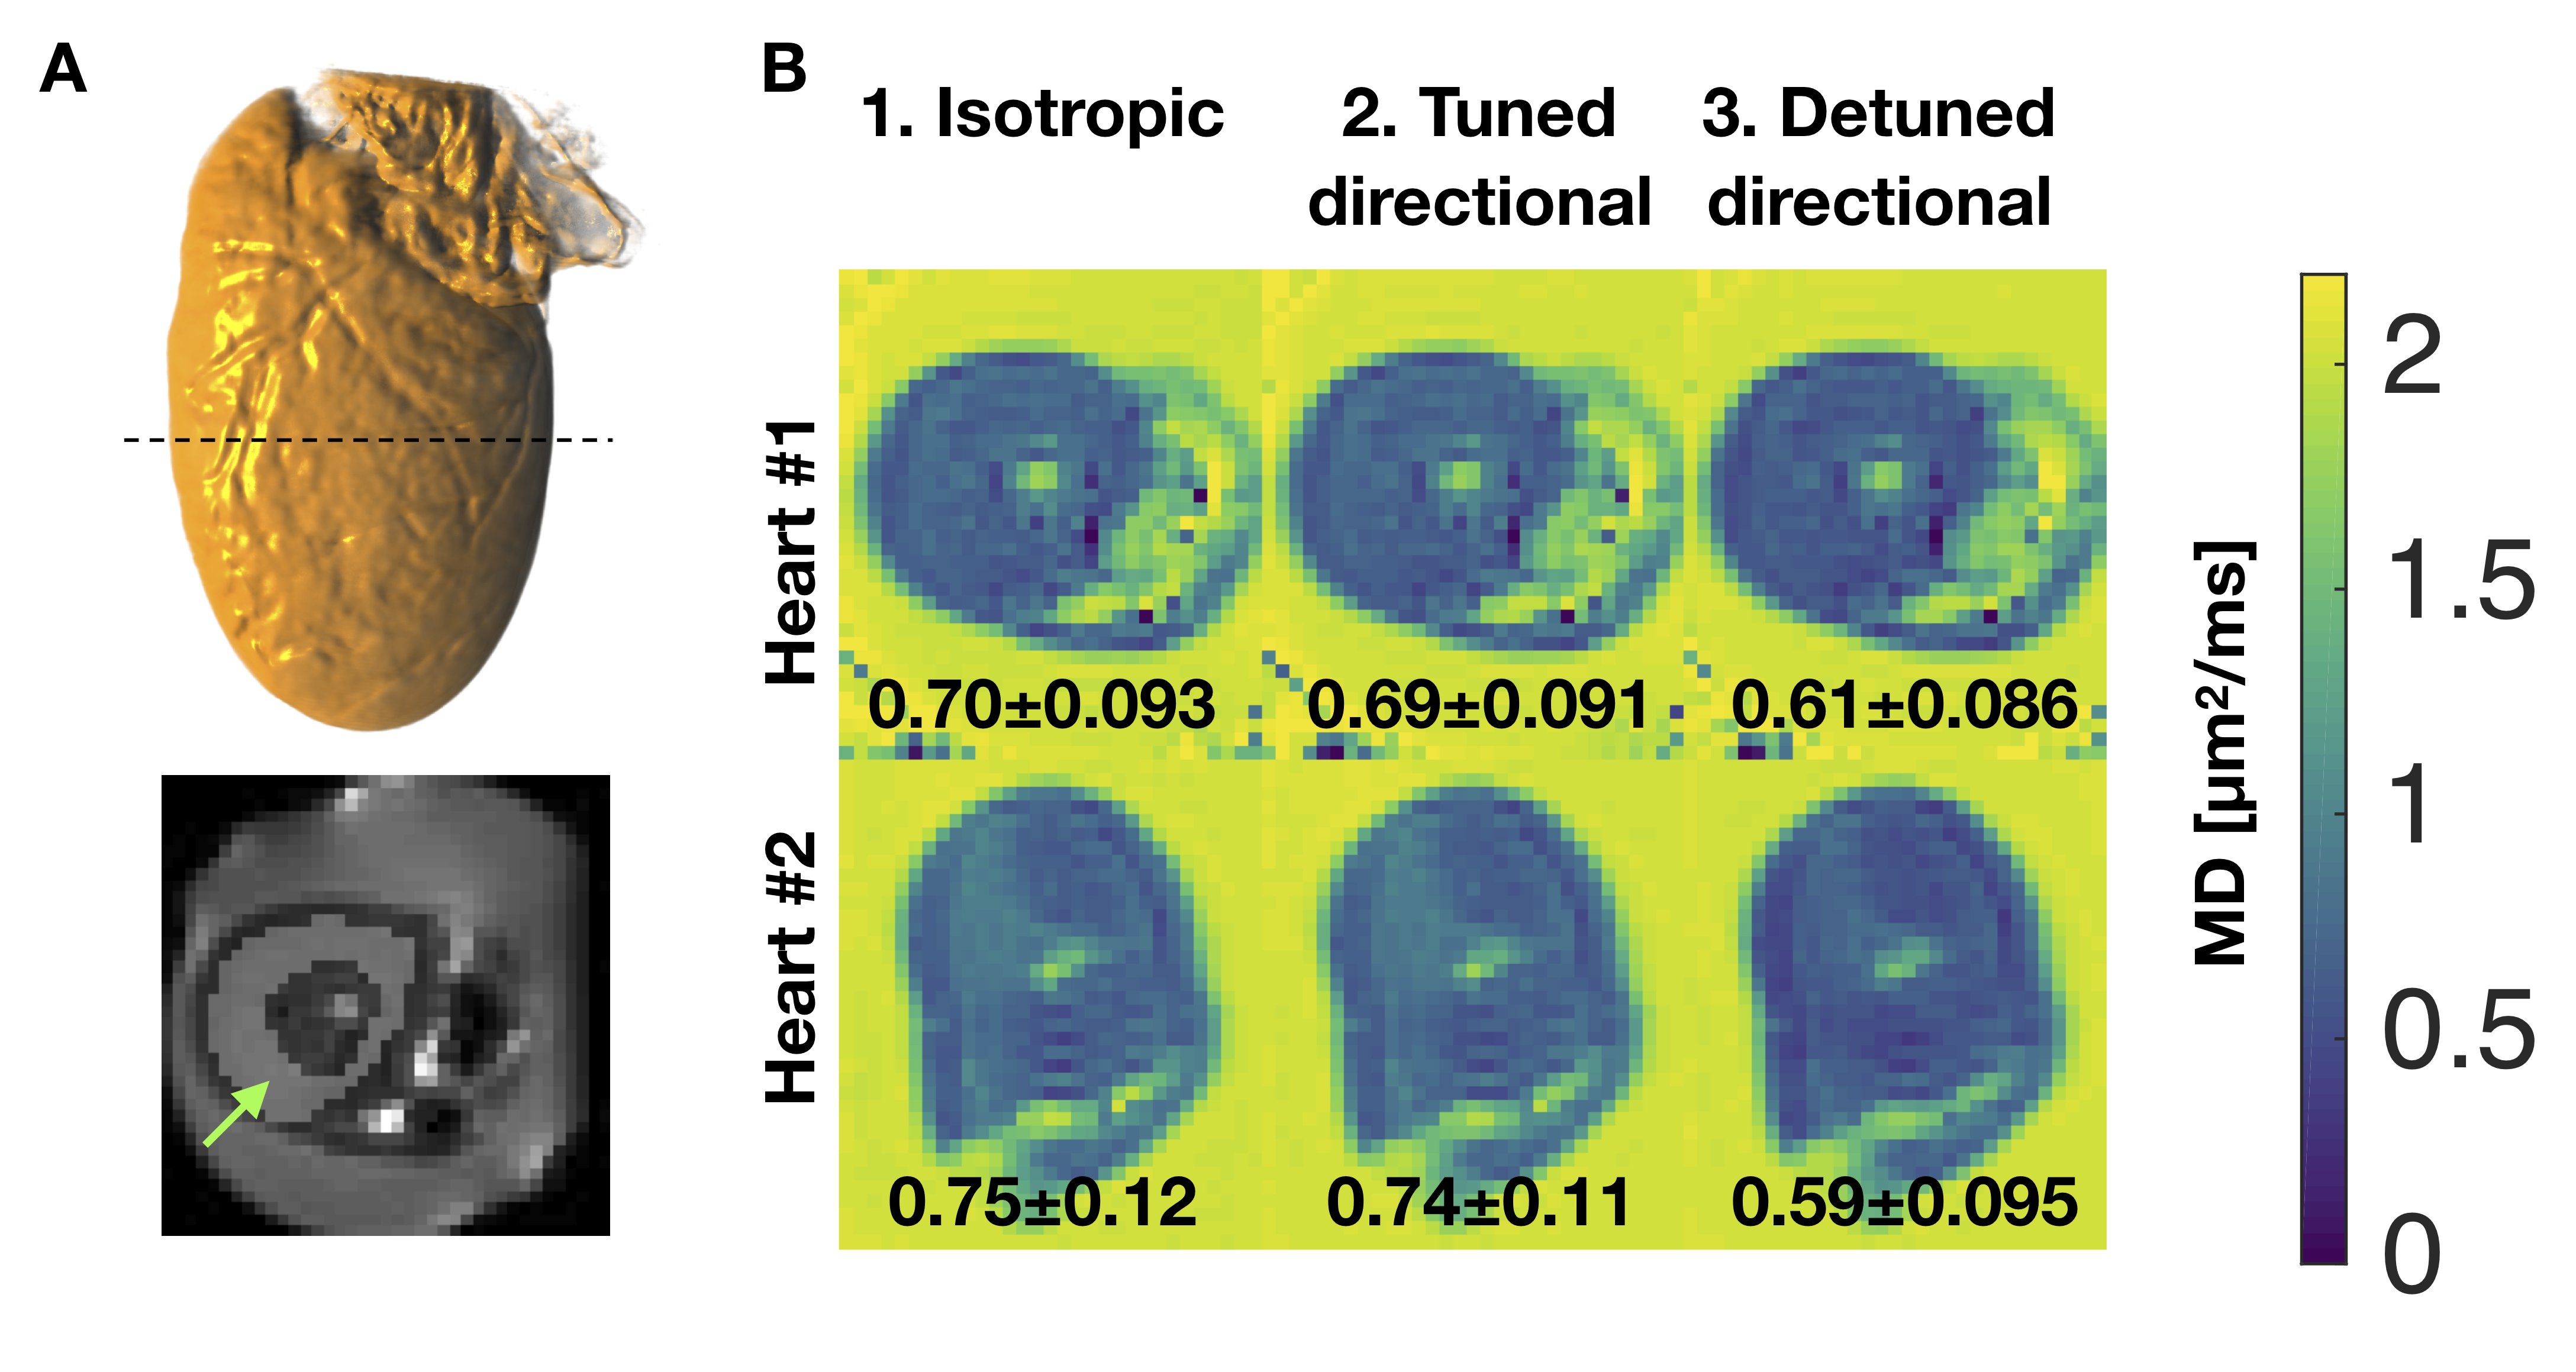
Two pig hearts were sourced from a butcher (Malcolm Michaels, Leeds, UK) and embedded in 1 % agarose PBS gel for imaging. MRI was acquired at room temperature on a Siemens Prisma 3T scanner (Siemens Healthcare AG, Erlangen, Germany) with body and spine RF coils and a prototype single-shot spin echo EPI sequence7: TR = 5 s, TE = 110 ms, partial-Fourier = 6/8, in-plane resolution = 3×3 mm2, slice thickness = 8 mm, FOV = 320×118 mm2, number of slices = 5, with ZOOM-IT excitation. Diffusion weighting was performed with 3 different gradient waveforms shown in Figure 1: 1) Isotropic b-tensor encoding with the numerically optimized magic angle spinning of the q-vector (q-MAS)8, 2) tuned directional encoding and 3) detuned directional encoding6. The respective encoding power spectra are shown in Figure 1D with similar power distribution in 1) and 2) but with significantly more power at lower frequencies for the detuned case 3). The relevant spectrum for the isotropic waveform is the spectral trace, i.e. the sum of three orthogonal axes reflecting its rotationally invariant total encoding power known as the b-value. Gradient duration on each side of the inversion pulse was 40 ms with an 8 ms pause for the refocusing pulse. Diffusion encoding were matched across waveforms and set to b = [0 0.15 0.30 0.45 0.60] ms/µm2. The waveforms were performed with 4 uniform rotations with 4 repetitions. For isotropic encoding, the rotation was performed with respect to an approximately cylindrical symmetry axis found from the projection of the dephasing trajectory along the axis with high encoding power at low frequencies9. From powder averaged data we fitted MD maps and estimates were extracted from manually drawn ROIs covering the myocardial wall of the left ventricle (Figure 2A).Results and Discussion
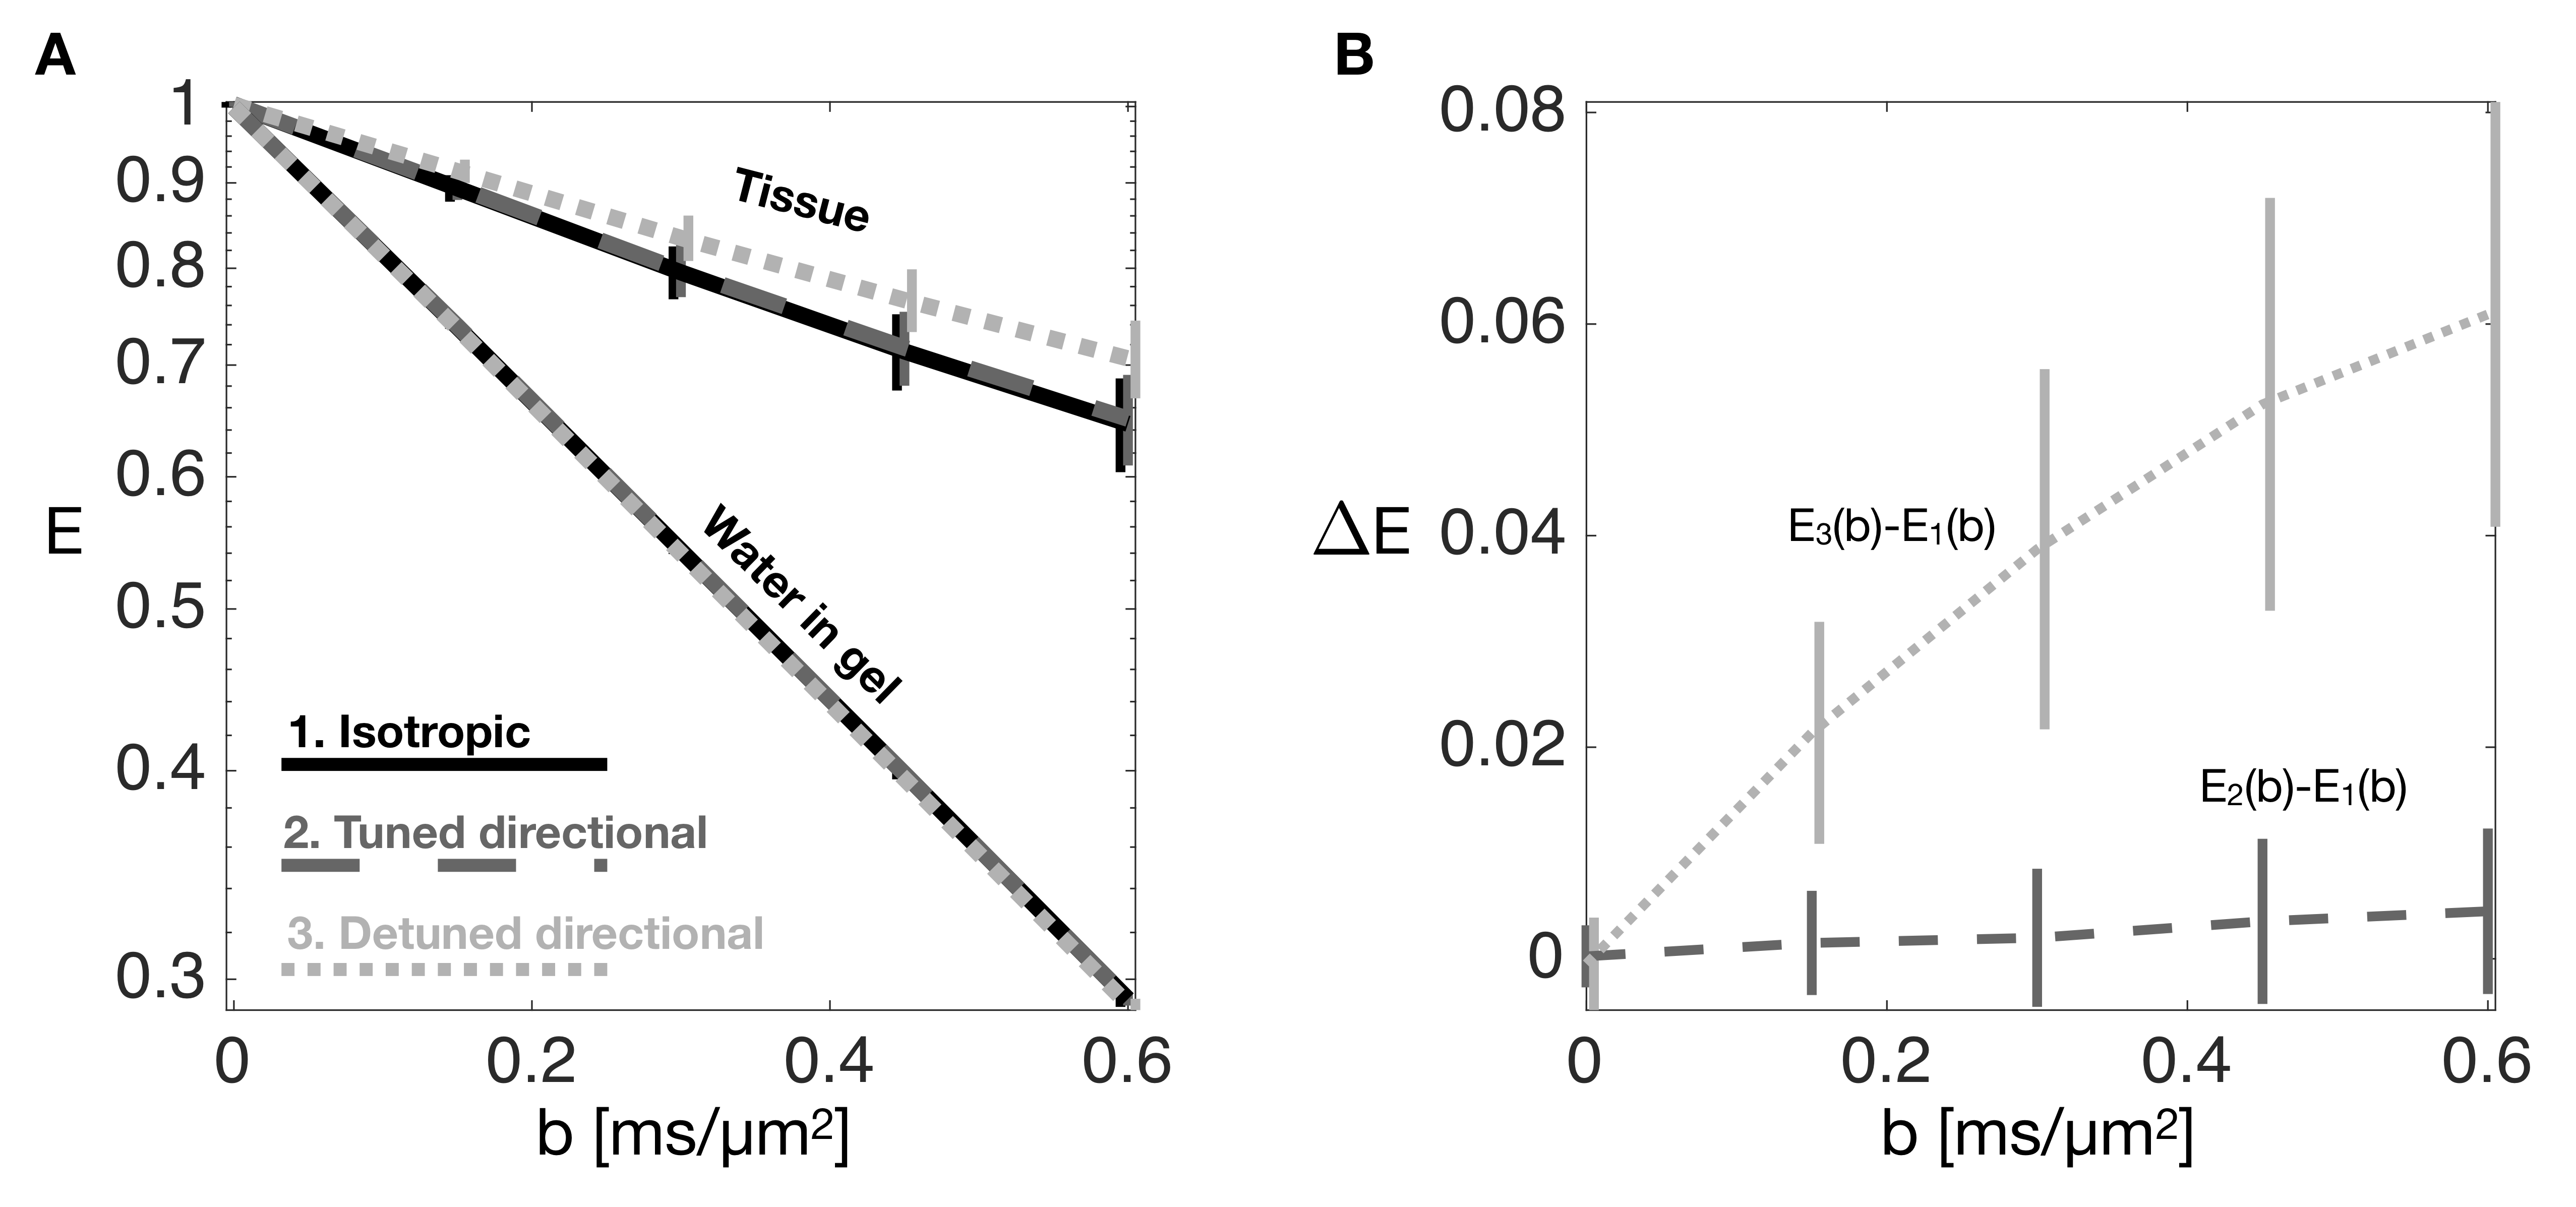
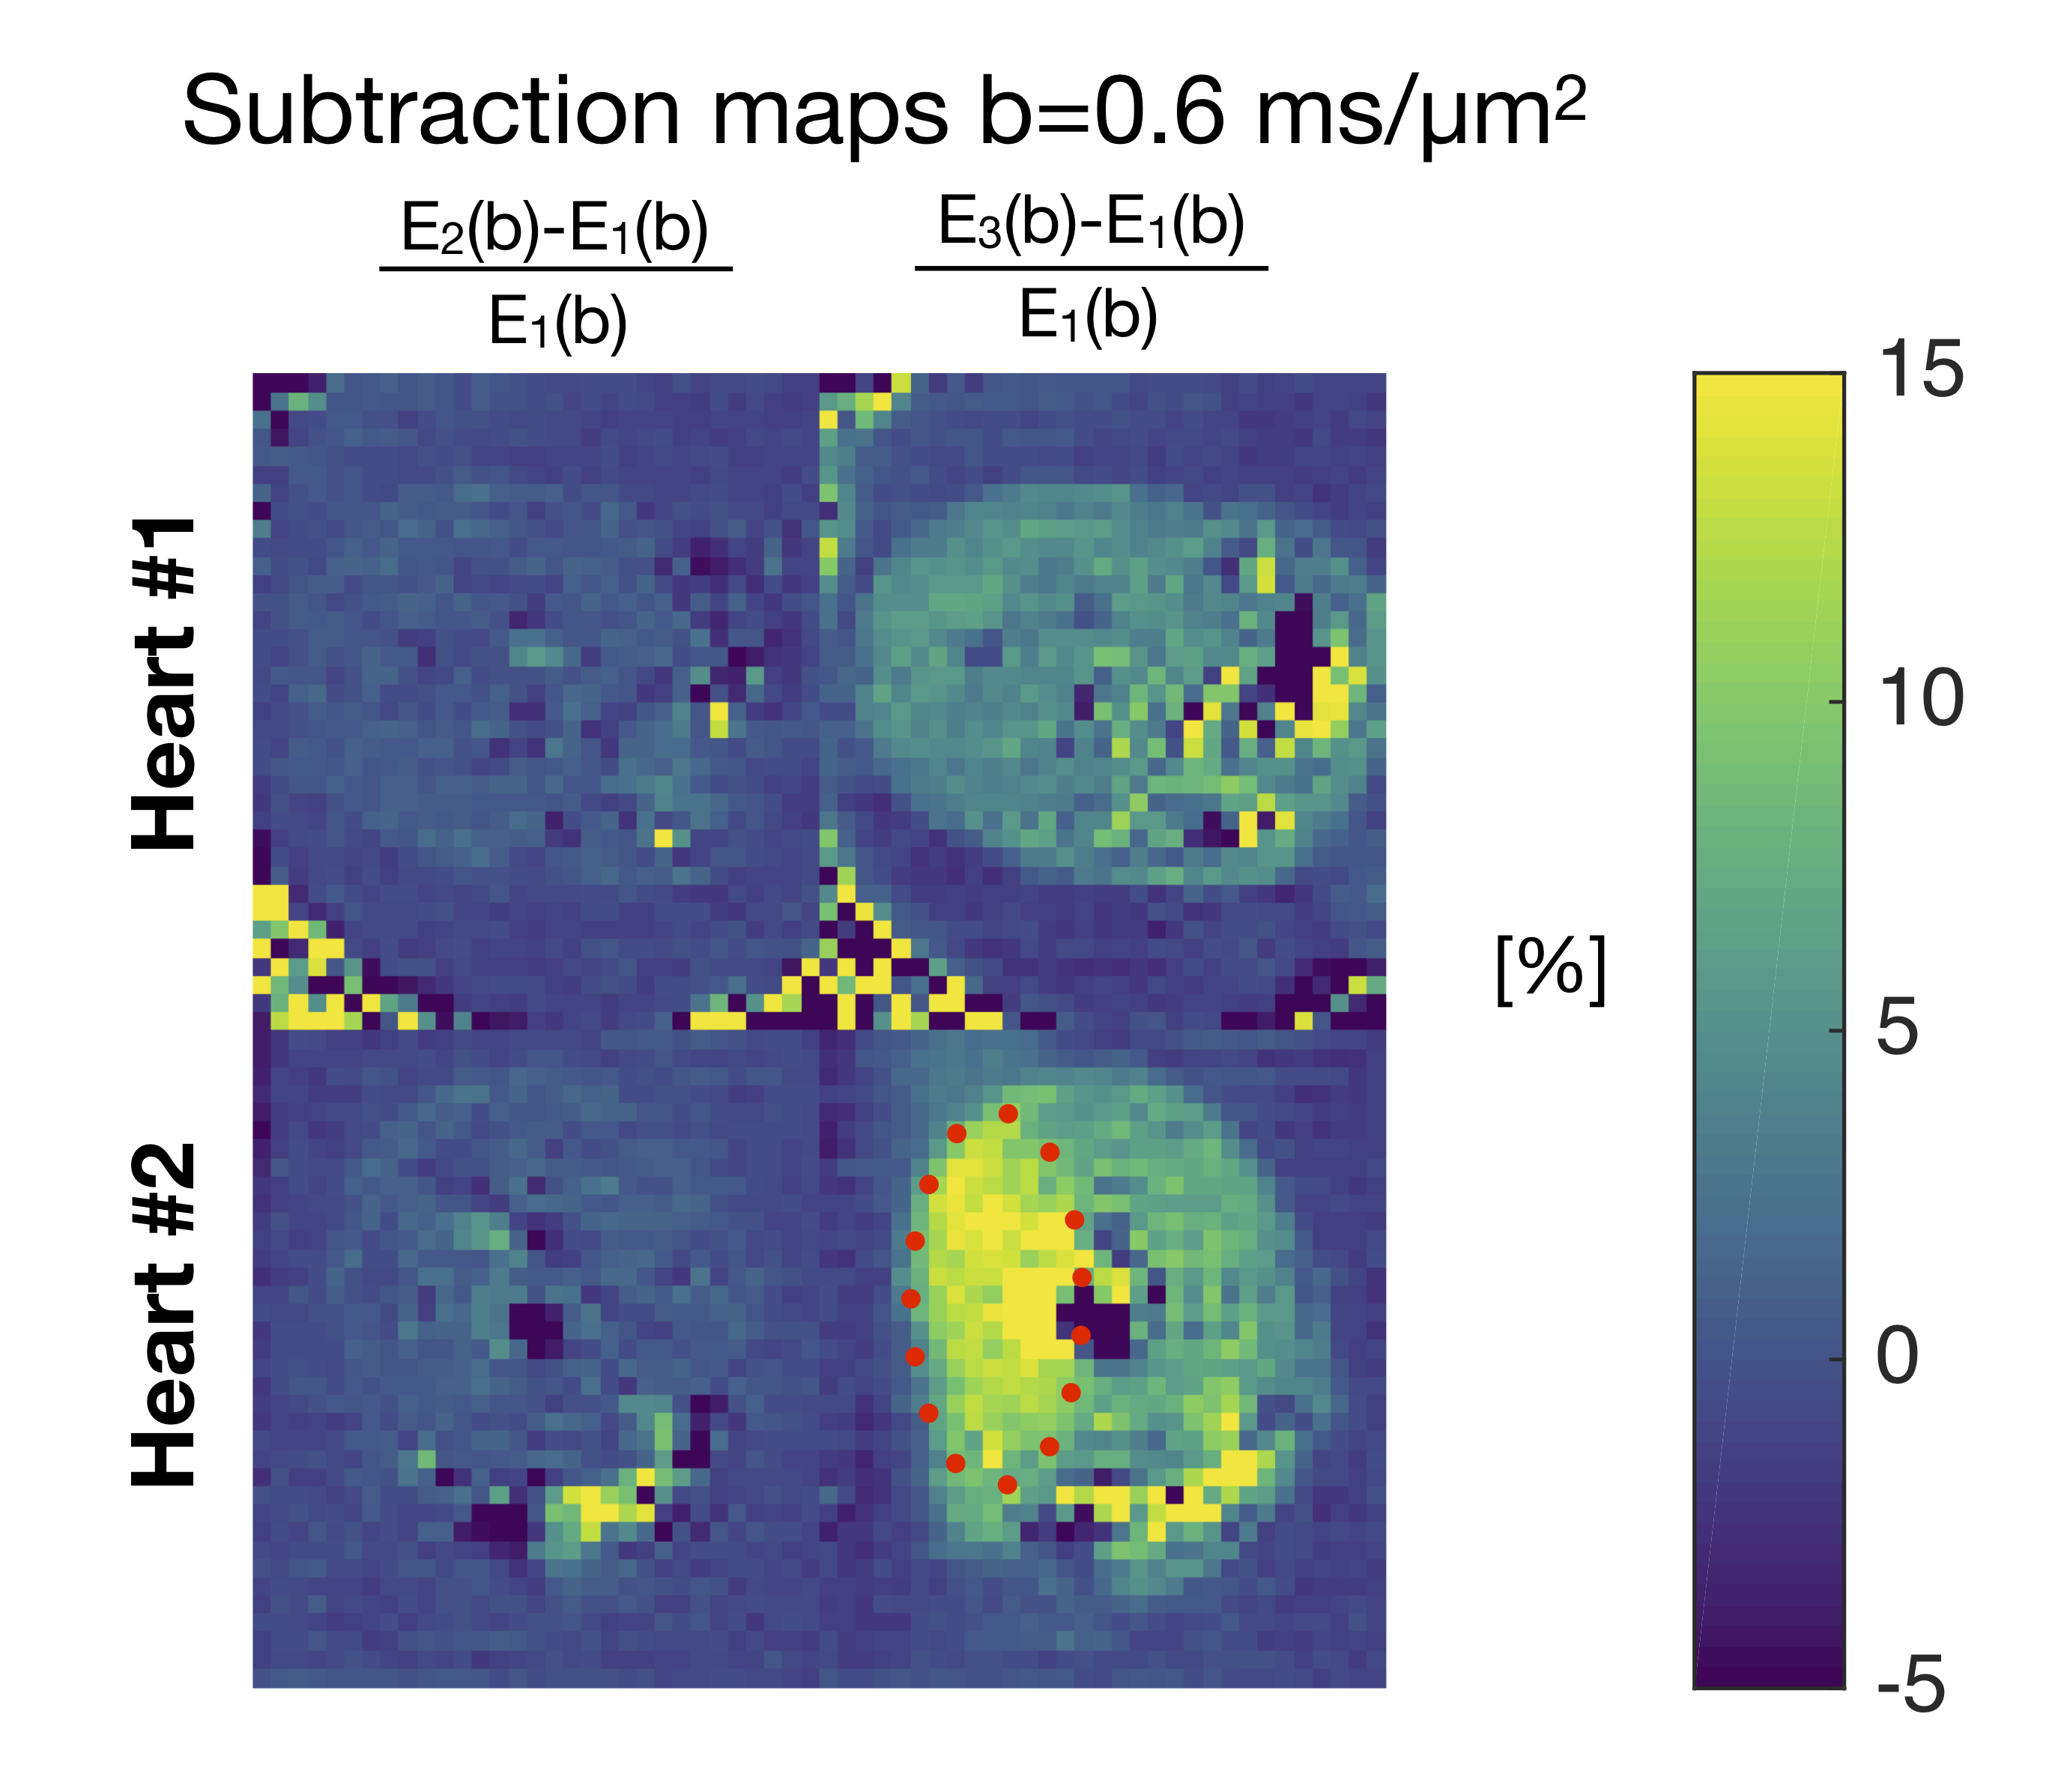
We found similar MD values when estimated from tuned directional and isotropic encodings but significantly lower values in the detuned case (Figure 2B). Normalized signal (E) vs. b curves also show a clear separation in tissue from detuning but not in water in gel (upper curves in Figure 3A). The absolute difference in normalized signal is in the order of 6 % at the highest b-value (Figure 3B). Larger b-values would be required for quantification of microscopic anisotropy from different kurtosis between the tuned directional and isotropic encodings4 as we have previously demonstrated in the heart10. The difference between tuned and detuned encoding provides sufficient contrast to noise to appreciate the effect of time dependent diffusion from raw subtraction of images with isotropic and detuned encodings at the highest b-value (Figure 4). The difference was larger in one heart (#2) and in particular one region (red ellipse). We speculate that this could be due to bruising since the heart was excised. While the effect is subtle in the individual images or MD maps, the contrast between tuned and detuned waveforms may provide a direct readout for changes in microstructure. This effect is apparently only due to changes in time-dependent diffusion as no significant difference is seen between the tuned cases (lower left panel Figure 4). Root mean square displacements are on the order of 10 µm over the encoding period (free diffusion of water) and we thus believe that the effects mainly reflect size and permeability of local restrictions. Considering longer mixing times within the encoding period may further reflect mesoscopic organization as previously shown in skeletal muscles11. However, unlike stimulated echo approaches, modulated spectral content with constant echo time has the benefit to not entangle relaxation effects. A more detailed mapping of time dependence in the heart and strategies for motion compensation could guide optimal future strategies for enhancing the tuning/detuning contrast12. Even when microscopic anisotropy is not considered, isotropic encoding has a general benefit over directional encoding with a factor $$$sqrt{1/3}$$$ lower gradient amplitude in individual axes for the same high frequency spectral power and b-value.Acknowledgements
This project has received funding from the European Research Council (ERC) under the European Union’s Horizon 2020 research and innovation programme (grant agreement No 804746) and was supported by the British Heart Foundation, UK (SI/14/1/30718) and the Swedish Foundation for Strategic Research (ITM17-0267), Swedish Research Council (2018-03697). SL is supported by Random Walk Imaging.References
1. Teh, I., Schneider, J. E., H.J., W., Dyrby, T. B. & Lundell, H. Temporal Diffusion Spectroscopy in the Heart with Oscillating Gradients. in proc. ISMRM, 25, 3114 (2017).
2. Topgaard, D. Multiple dimensions for random walks. J. Magn. Reson., 306,150–154 (2019).
3. Westin, C.-F. et al.Measurement Tensors in Diffusion MRI: Generalizing the Concept of Diffusion Encoding. MICCAI14, 209–216 (2014).
4. Lasič, S., Szczepankiewicz, F., Eriksson, S., Nilsson, M. & Topgaard, D. Microanisotropy imaging: quantification of microscopic diffusion anisotropy and orientational order parameter by diffusion MRI with magic-angle spinning of the q-vector. Front. Phys., 2, 11 (2014).
5. Stepišnik, J. Time-dependent self-diffusion by NMR spin-echo. Phys. B, 183, 343–350 (1993).
6. Lundell, H. et al.Multidimensional diffusion MRI with spectrally modulated gradients reveals unprecedented microstructural detail. Sci. Rep., 9, 9026 (2019).
7. Szczepankiewicz, F., Sjölund, J., Ståhlberg, F., Lätt, J. & Nilsson, M. Tensor-valued diffusion encoding for diffusional variance decomposition (DIVIDE): Technical feasibility in clinical MRI systems. PLoS One, 14, e0214238 (2019).
8. Topgaard, D. Isotropic diffusion weighting in PGSE NMR: Numerical optimization of the q-MAS PGSE sequence. Microporous Mesoporous Mater., 178, 60–63 (2013).
9. Lundell, H. et al.Reducing spectral anisotropy in isotropic b-tensor multidimensional diffusion encoding. in proc. ISMRM, 27, 3503 (2019).
10. Teh, I., Lundell, H., Whittington, H. J., Dyrby, T. B. & Schneider, J. E. Resolving Microscopic Fractional Anisotropy in the Heart. in proc. ISMRM, 24, 800 (2016).
11. Sigmund, E. E. et al.Time-dependent diffusion in skeletal muscle with the random permeable barrier model (RPBM): Application to normal controls and chronic exertional compartment syndrome patients. NMR Biomed., 27, 519–528 (2014).
12. Lasič, S. et al.Motion compensated b-tensor encoding for in vivo cardiac diffusion-weighted imaging. NMR Biomed, in press, (2019).
Figures