0954
Diffusion-weighted phase imaging: towards a tract-specific myelin measure1WIN@FMRIB, University of Oxford, Oxford, United Kingdom
Synopsis
We propose a novel sequence that adds a second asymmetric spin echo after a standard Stejskal-Tanner sequence. This allows the estimation of the off-resonance frequency of the diffusion-weighted signal due to the myelin magnetic susceptibility. Varying the orientation of the diffusion-weighting gradient dephases different fibre populations. In simulations we show that for a sufficiently high b-value (>~3 ms/μm2), the intra-axonal water will dominate leading to a simple relation between the myelin-induced frequency shift and the log g-ratio. This allows the difference in log g-ratio between crossing fibres to be measured and hence estimate the myelination of individual crossing tracts.
Introduction
While a wide variety of myelin-sensitive MRI contrasts1,2 have been proposed, these only give voxel-averaged estimates. Resolving this into myelin estimates for individual crossing fibres would allow more precise estimates of the myelination of individual tracts in health and disease3.Here we propose to measure the myelin-induced frequency offset after diffusion weighting. Diffusion-weighting makes the MRI sequence sensitive to fibre orientations. However, due to its short T2, myelin water becomes invisible after diffusion weighting on most scanners1,2 This invalidates combining diffusion-weighting with those myelin MRI contrasts that rely on detecting the myelin water properties directly (i.e., its short T16,7, T2*8, T24,9, or magnetisation transfer10–12). However, the magnetic field shift induced by the magnetic susceptibility of myelin also affects the intra- and extra-axonal water13, which are still visible after diffusion weighting. We measure this field shift as a phase offset in an asymmetric-spin echo acquisition after diffusion-weighting.
Here we present and test with Monte Carlo simulations the novel sequence and an analysis method to extract the difference in myelination between crossing fibres.
Sequence
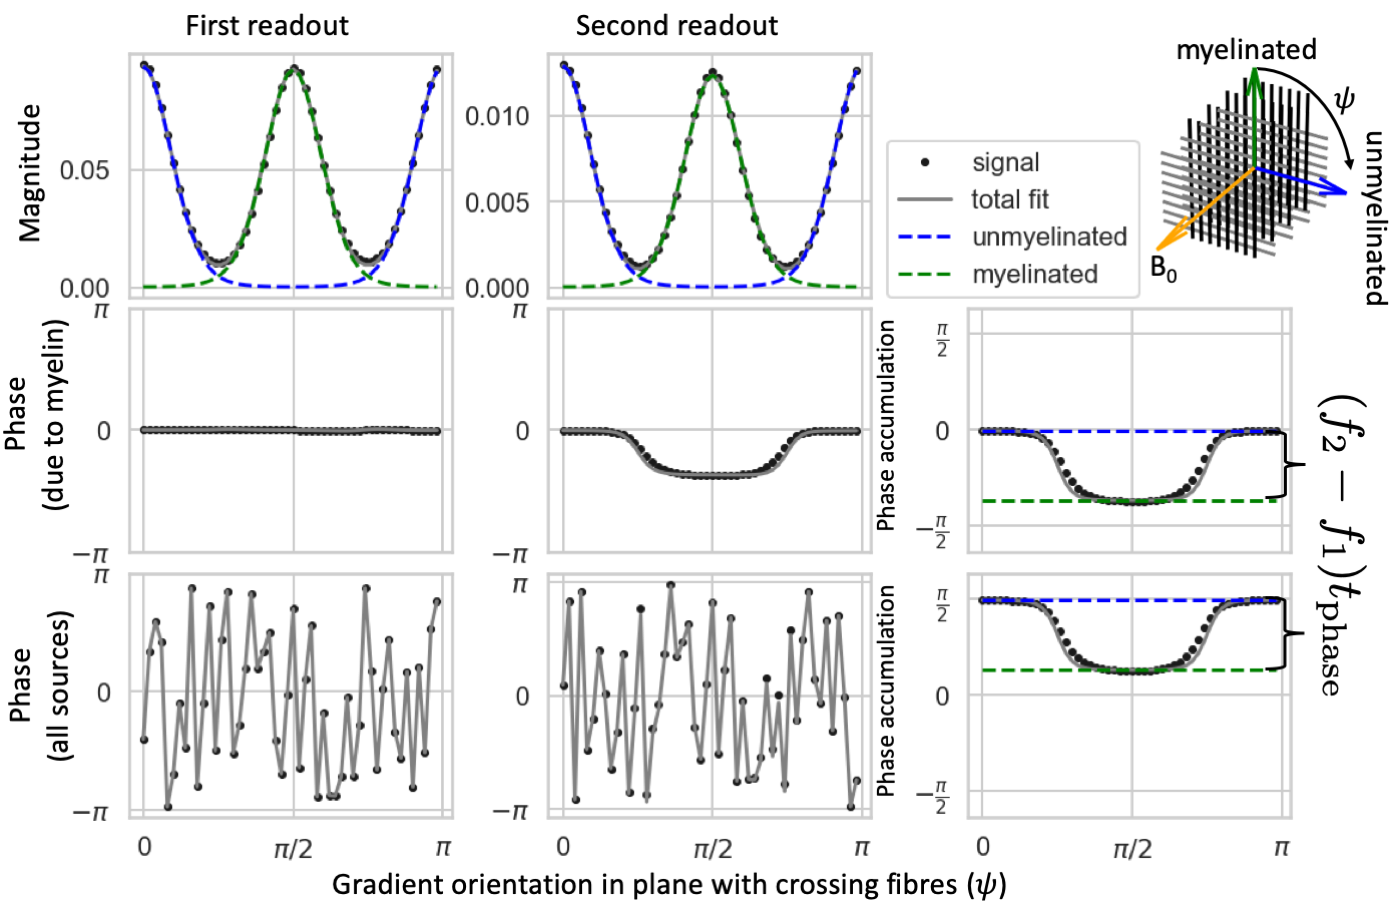
Up to the first echo planar imaging (EPI) readout, the proposed sequence is identical to a Stejskal-Tanner14 sequence (although planar diffusion encoding could also be used). After the first readout an extra refocusing pulse is added followed by a second EPI readout, which is delayed with a time $$$t_{\rm{}phase}$$$ from the second spin echo (Figure 1A). The phase difference between the first and second readout is determined by the off-resonance frequency, but unaffected by phase offsets caused by bulk motion during the diffusion weighting15,16.Imaging the off-resonance frequency after diffusion-weighting has two distinct advantages:
- In a crossing fibre configuration, different gradient orientations can be used to distinguish between the myelin-induced off-resonance frequency for each fibre population.
- The diffusion weighting increases the relative contribution of intra-axonal water compared with extra-axonal water17 (with its less restricted diffusion). This simplifies the analysis, because the frequency offset due to myelin susceptibility ($$$f_{\rm{}myelin}$$$) has a flat profile within the axons (Figure 2B)13 and has a simple relation with the g-ratio (i.e., ratio of inner over outer axon diameter): $$\frac{f_{\rm{}myelin}}{f_{\rm{}Larmor}}=-\frac{3}{4}\chi_{\rm{}A}\langle{}\log{}g\rangle{}\sin^2\theta,\tag{1}$$ where $$$\theta$$$ is the angle between the axons and the main magnetic field orientation, $$$\chi_{\rm{}A}$$$ is the anisotropic susceptibility of myelin (-100 ppb13), and $$$\langle{}\log{}g\rangle$$$ is the average log g-ratio.
Simulations
We ran Monte Carlo simulations18 of crossing fibres in Camino19 (see geometry in Figure 2). The signal magnitude is attenuated by the diffusion-weighted gradients, T2 (80 ms20), and T2’ (50 ms21) dephasing (Figure 1B). Ideally, the phase would only be affected by the myelin-induced off-resonance frequency (Figure 1C), but in practice we also expect off-resonance frequency due to non-myelin sources ($$$f_{\rm{}other}$$$) and random phase offsets due to even small motion during the diffusion-weighting ($$$\phi_{{\rm{}DW}}(\hat{\nu})$$$)15,16 (Figure 1D). We minimize the echo time for each b-value assuming an EPI readout time of 50 ms and the maximum gradient strength (80 mT/m) and slew rate (200 T/m/s) of a 3T Siemens Prisma scanner.Fitting the fibre myelination
For diffusion data with a single b-value, the complex signal at the first spin-echo readout ($$$S_{\rm{}SE}$$$) is fitted by:$$S_{\rm{}SE}(b,\hat{\nu})=\sum_kA_{{\rm{}SE};k}e^{-b\hat{\nu}\mathbf{B}_k\hat{\nu}}e^{i\phi_{{\rm{}DW}}(\hat{\nu})}\tag{2},$$
where we estimate for each crossing fibre $$$k$$$ the signal amplitude ($$$A_{{\rm{}SE};k}$$$), the demeaned diffusion tensor ($$$\mathbf{B}_k=\mathbf{D}_k-{\rm{}MD}_k\mathbf{I}$$$)22, and the phase from movement during the diffusion-weighting ($$$\phi_{{\rm{}DW}}(\hat{\nu}$$$). Because this signal is at a spin-echo, there is no phase accumulation due to off-resonance.
Simultaneously, we fit the second asymmetric spin echo signal ($$$S_{\rm{}ASE}$$$) using:
$$S_{\rm{}ASE}(b,\hat{\nu})=\sum_kA_{{\rm{}ASE};k}e^{-b\hat{\nu}\mathbf{B}_k\hat{\nu}}e^{i[\phi_{{\rm{}DW}}(\hat{\nu})+2\pi{}f_kt_{\rm{}phase}]}\tag{3},$$
Both readouts are fitted with a common demeaned diffusion tensor ($$$\mathbf{B}_k$$$), but a different amplitude ($$$A_{{\rm{}SE};k}$$$ and $$$A_{{\rm{}ASE};k}$$$). The off-resonance frequency for each crossing fibre ($$$f_k$$$) is fitted to the phase offset between readouts (Figure 3).
For each fibre population the frequency ($$$f_k$$$) will have a contribution from myelin ($$$f_{{\rm{}myelin};k}$$$; eq. 1) and other susceptibility sources ($$$f_{\rm{}other}$$$). For interleaving fibres, non-myelin susceptibility sources should affect all fibre orientations equally, so we can compare this frequency between two crossing fibres (labeled $$$k$$$ and $$$l$$$) to get:
$$f_l-f_k=f_{{\rm{}myelin};l}-f_{{\rm{}myelin};k}=\frac{3}{4}\chi_{\rm{}A}f_{\rm{}Larmor}\left(\langle{}\log{}g\rangle_k\sin^2\theta_k-\langle{}\log{}g\rangle_l\sin^2\theta_l\right)\tag{4}$$
Estimates of the g-ratio per fibre orientation can be obtained by repeating the measure for different head orientations (i.e., varying $$$\theta$$$) or by adding an extra constraint by estimating the average g-ratio across the whole voxel through different means23,24.
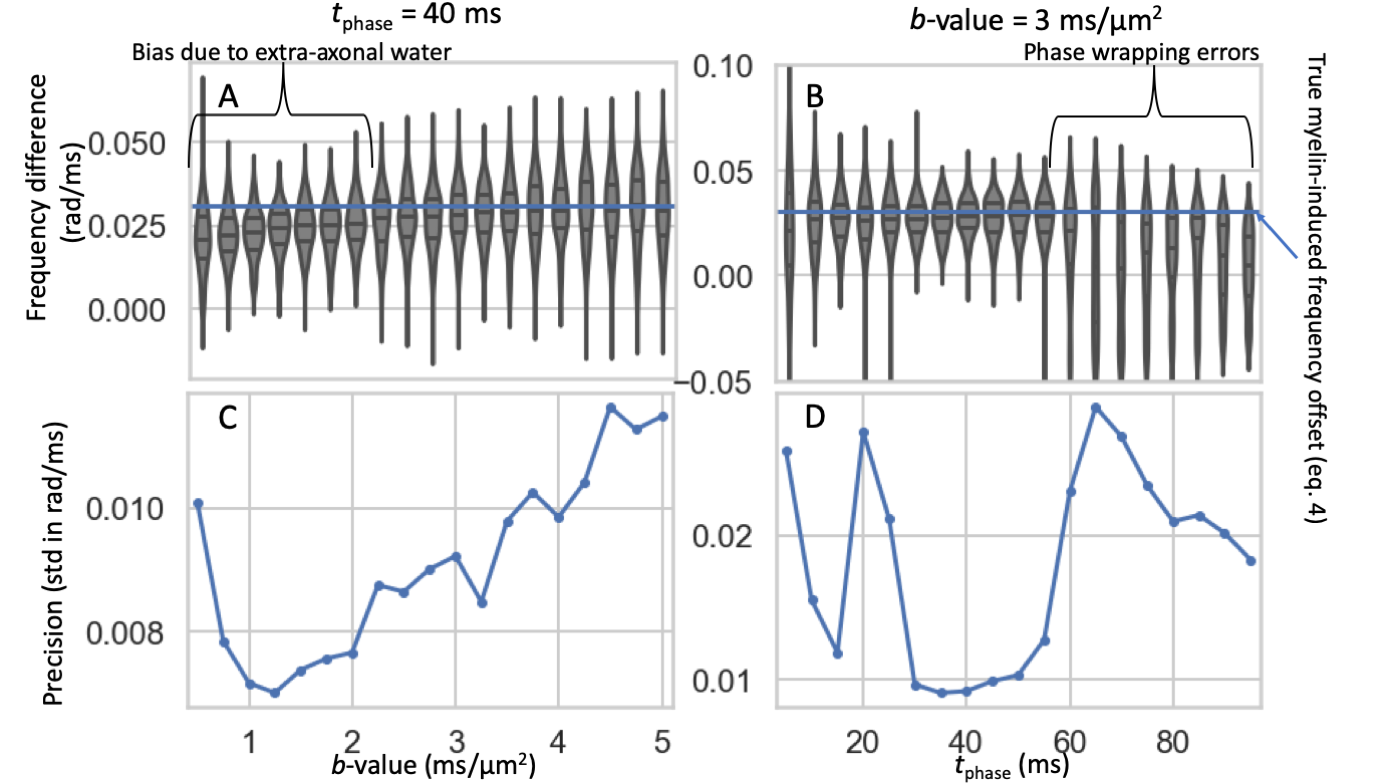
Accuracy and precision
A biased estimate of the frequency difference was found in the simulations due to the extra-axonal water contribution at low b-values (Figure 4A) and phase wrapping errors at long $$$t_{\rm{}phase}$$$ (Figure 4B). When selecting a b-value and $$$t_{\rm{}phase}$$$, these inaccuracies have to be traded off with the low SNR at high b-values (Figure 4C) and the lower phase accumulation at low $$$t_{\rm{}phase}$$$ (Figure 4D).Discussion
While the details of the simulation shown here depend on the assumed microstructural geometry, relaxation properties, and scanner properties, the general features of the proposed sequence illustrated should generalise more broadly. For fast readouts (i.e., $$$<t_{\rm{}phase}$$$) the sequence can be shortened by removing the second refocusing pulse.For interleaving crossing fibres, the off-resonance frequency difference will be purely driven by the difference in the g-ratio between the fibre populations (modulated by angle with the main magnetic field), which allows this difference to be estimated. This represents a first step to not just estimating a voxel-averaged g-ratio, but a fibre-population specific g-ratio.
Acknowledgements
We thank Matt Hall, Matteo Bastiani, and Stamatios Sotiropoulos for helpful discussions.References
1. Alexander, A. L. et al. Characterization of cerebral white matter properties using quantitative magnetic resonance imaging stains. Brain Connect 1, 423–46 (2011).
2. Heath, F., Hurley, S. A., Johansen-Berg, H. & Sampaio-Baptista, C. Advances in noninvasive myelin imaging. Dev Neurobiol 78, 136–151 (2018).
3. Edgar, J. M. & Griffiths, I. R. White Matter Structure: A Microscopist’s View. in Diffusion MRI: From Quantitative Measurement to In-vivo Neuroanatomy (eds. Johansen-Berg, H. & Behrens, T. E. J.) (Elsevier Science, 2014).
4. Stanisz, G. J. & Henkelman, R. M. Diffusional anisotropy of T2 components in bovine optic nerve. Magn Reson Med 40, 405–10 (1998).
6. Travis, A. R. & Does, M. D. Selective excitation of myelin water using inversion-recovery-based preparations. Magn Reson Med 54, 743–7 (2005).
7. De Santis, S., Barazany, D., Jones, D. K. & Assaf, Y. Resolving relaxometry and diffusion properties within the same voxel in the presence of crossing fibres by combining inversion recovery and diffusion-weighted acquisitions. Magn Reson Med 75, 372–80 (2016).
8. Du, Y. P. et al. Fast multislice mapping of the myelin water fraction using multicompartment analysis of T2 decay at 3T: A preliminary postmortem study. Magn. Reson. Med. 58, 865–870 (2007).
9. Whittall, K. P. & MacKay, A. L. Quantitative interpretation of NMR relaxation data. J. Magn. Reson. 1969 84, 134–152 (1989).
10. Henkelman, R. M., Stanisz, G. J. & Graham, S. J. Magnetization transfer in MRI: a review. NMR Biomed 14, 57–64 (2001).
11. Avram, A. V., Guidon, A. & Song, A. W. Myelin water weighted diffusion tensor imaging. Neuroimage 53, 132–8 (2010).
12. Sled, J. G. Modelling and interpretation of magnetization transfer imaging in the brain. Neuroimage 182, 128–135 (2018).
13. Wharton, S. & Bowtell, R. Fiber orientation-dependent white matter contrast in gradient echo MRI. Proc Natl Acad Sci USA 109, 18559–64 (2012).
14. Stejskal, E. O. & J.E, T. Spin Diffusion Measurements: Spin Echoes in the Presence of a Time Dependent Field Gradient. J Chem Phys (1965) doi:10.1063/1.1695690.
15. Anderson, A. W. & Gore, J. C. Analysis and correction of motion artifacts in diffusion weighted imaging. Magn Reson Med 32, 379–87 (1994).
16. Miller, K. L. & Pauly, J. M. Nonlinear phase correction for navigated diffusion imaging. Magn. Reson. Med. 50, 343–353 (2003).
17. Veraart, J., Fieremans, E. & Novikov, D. S. On the scaling behavior of water diffusion in human brain white matter. Neuroimage 185, 379–387 (2019).
18. Hall, M. G. & Alexander, D. C. Convergence and parameter choice for Monte-Carlo simulations of diffusion MRI. IEEE Trans Med Imaging 28, 1354–64 (2009).
19. Cook, P. et al. Camino: open-source diffusion-MRI reconstruction and processing. in 14th scientific meeting of the international society for magnetic resonance in medicine vol. 2759 2759 (Seattle WA, USA, 2006).
20. Whittall, K. P. et al. In vivo measurement of T2 distributions and water contents in normal human brain. Magn. Reson. Med. 37, 34–43 (1997).
21. Alonso-Ortiz, E., Levesque, I. R. & Pike, G. B. Impact of magnetic susceptibility anisotropy at 3 T and 7 T on T2*-based myelin water fraction imaging. Neuroimage 182, 370–378 (2018).
22. Dell’Acqua, F. et al. A model-based deconvolution approach to solve fiber crossing in diffusion-weighted MR imaging. IEEE Trans Biomed Eng 54, 462–72 (2007).
23. Stikov, N. et al. In vivo histology of the myelin g-ratio with magnetic resonance imaging. Neuroimage 118, 397–405 (2015).
24. Campbell, J. S. W. et al. Promise and pitfalls of g-ratio estimation with MRI. Neuroimage 182, 80–96 (2018).
Figures