0951
Pulsed Arterial Spin Labeling and Pseudo-Continuous Arterial Spin Labeling MRI for Diagnosis of Renal Insufficiency1Department of Radiology, Peking University First Hospital, Beijing, China, 2MR Collaboration, Siemens Healthcare, Ltd., Beijing, China, 3Siemens Healthcare GmbH, Erlangen, Germany
Synopsis
Patients with renal artery stenosis (RAS) exhibit changes in renal artery hemodynamics. This study investigated the clinical value of pulsed arterial spin labeling (PASL) and pseudo-continuous arterial spin labeling (pCASL) in diagnosing and grading renal insufficiency in patients with RAS. PASL performed better for measuring renal blood flow (RBF) in the renal cortex to provide differential diagnosis of renal function, while the RBF values obtained with pCASL were more closely correlated with the glomerular filtration rate (GFR). These findings indicate that PASL and pCASL MRI have utility for diagnosing and grading renal insufficiency in patients with RAS.
Introduction
Renal artery stenosis (RAS) is an important cause of hypertension and renal insufficiency; it leads to corresponding changes in renal artery hemodynamics. Unlike contrast-enhanced ultrasound, computed tomography (CT) perfusion, and radionuclide renal dynamic imaging, arterial spin labeling magnetic resonance imaging (ASL MRI) has been used to assess kidney perfusion by measuring blood perfusion of parenchymal microvessels in viscera non-invasively, without ionizing radiation or radioactivity, free of contrast injection and have no burden for patients1,2. However, there are no clear diagnostic criteria for renal insufficiency caused by renal artery stenosis for clinical application of this method2. Based on the glomerular filtration rate (GFR), which is the gold standard obtained via radionuclide tracer3-5, this study aimed to investigate the clinical value of optimized pulsed arterial spin labeling (PASL) and pseudo-continuous arterial spin labeling (pCASL) MRI techniques in the diagnosis and grading of renal insufficiency in patients with RAS.Methods
Thirty-six patients (27 males, mean age: 65.94±10.34 years) with suspected renal artery stenosis and renal insufficiency were enrolled in this study. All MRI data were collected on a MAGNETOM Aera 1.5T MR scanner (Siemens Healthcare, Erlangen, Germany) with an 18-channel body coil and a 32-channel spine coil. A prototype renal ASL sequence was examined twice to acquire renal perfusion data, using PASL and pCASL techniques in 3D acquisition that covered both kidneys. The sequence parameters for pCASL were: repetition time (TR)=5000ms, echo time (TE)=17.12ms, field of view (FOV)= 300×150mm2, voxel size =4.7×4.7×6mm3, spin labeling was applied for a duration of 1500ms, post labeling delay=1500ms. The PASL parameters were the same, except for: TR=6000ms, TI =1500ms, bolus length=700ms. Renal blood flow (RBF) maps were inline generated after data acquisition. The RBF values of the renal cortex and the entire kidney were obtained using PASL and pCASL. Based on GFR assessed by radionuclide renal dynamic imaging in each patient, 72 kidneys were divided into four groups according to the level of renal dysfunction: normal, (GFR≥35 ml/min, n=15); mild, (35>GFR≥25 ml/min, n=15); moderate, (25>GFR≥ 15 ml/min, n =14); and severe, (GFR<15 ml/min, n =28). Pearson correlation analysis was performed to evaluate the relationship between perfusion parameters and GFR. The efficacy of RBF in the differential diagnosis of normal renal function and different levels of renal dysfunction was assessed by receiver operating characteristic (ROC) curves. Cut-off values and areas under the curve (AUCs) of RBF for different levels of renal dysfunction were analyzed by ROC curves.Results
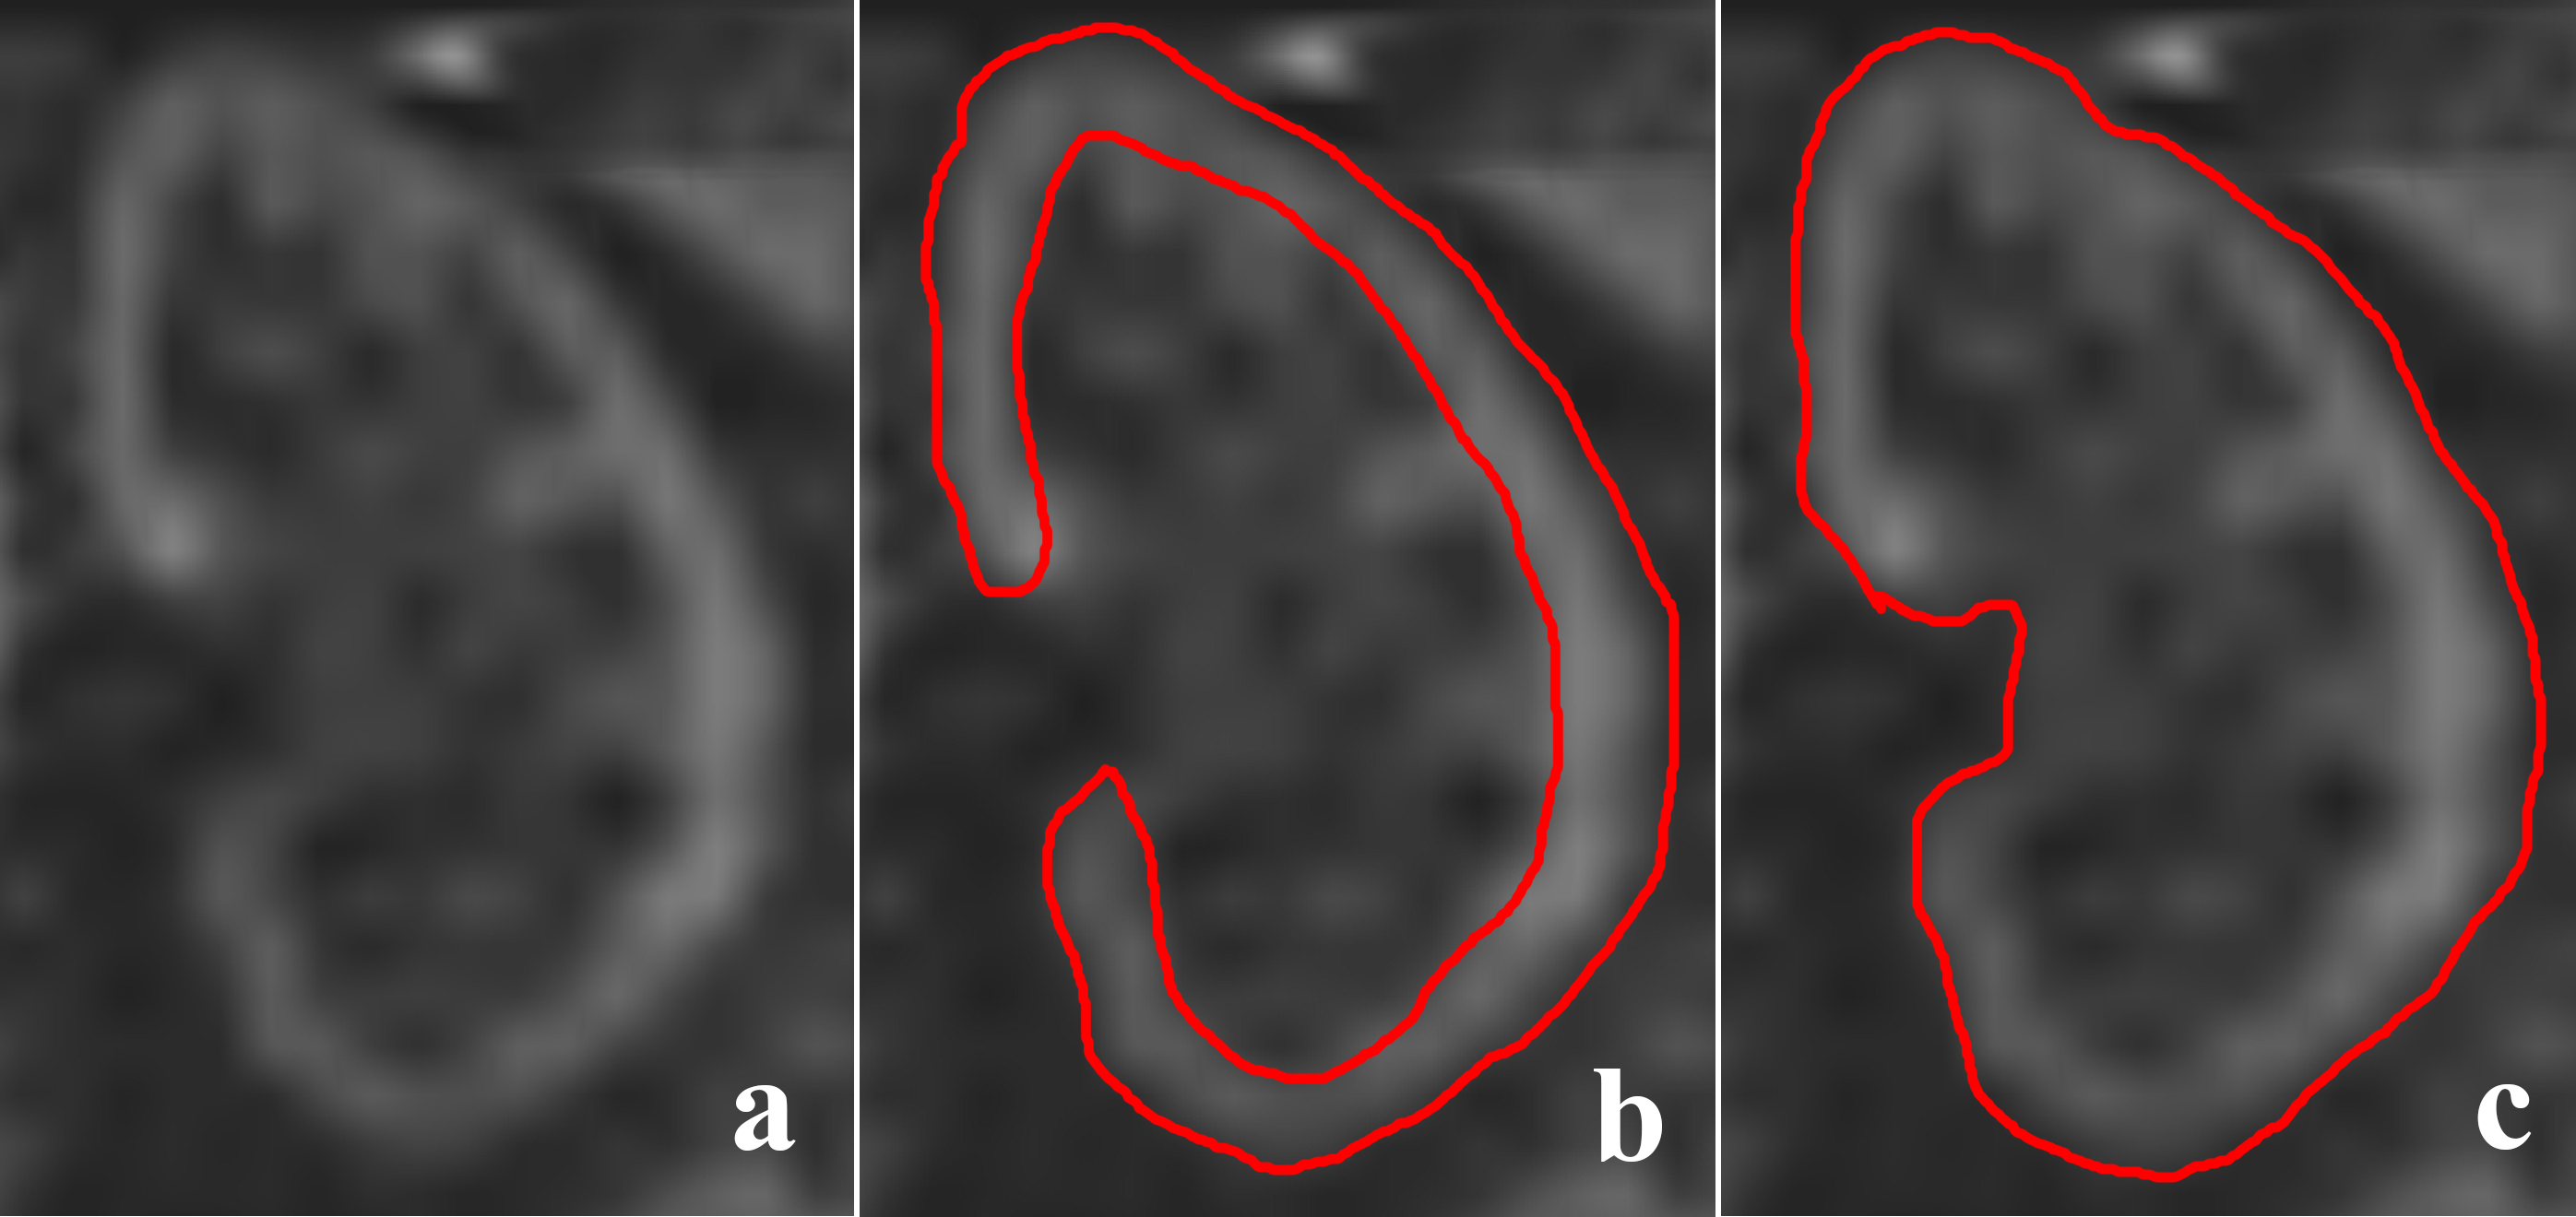
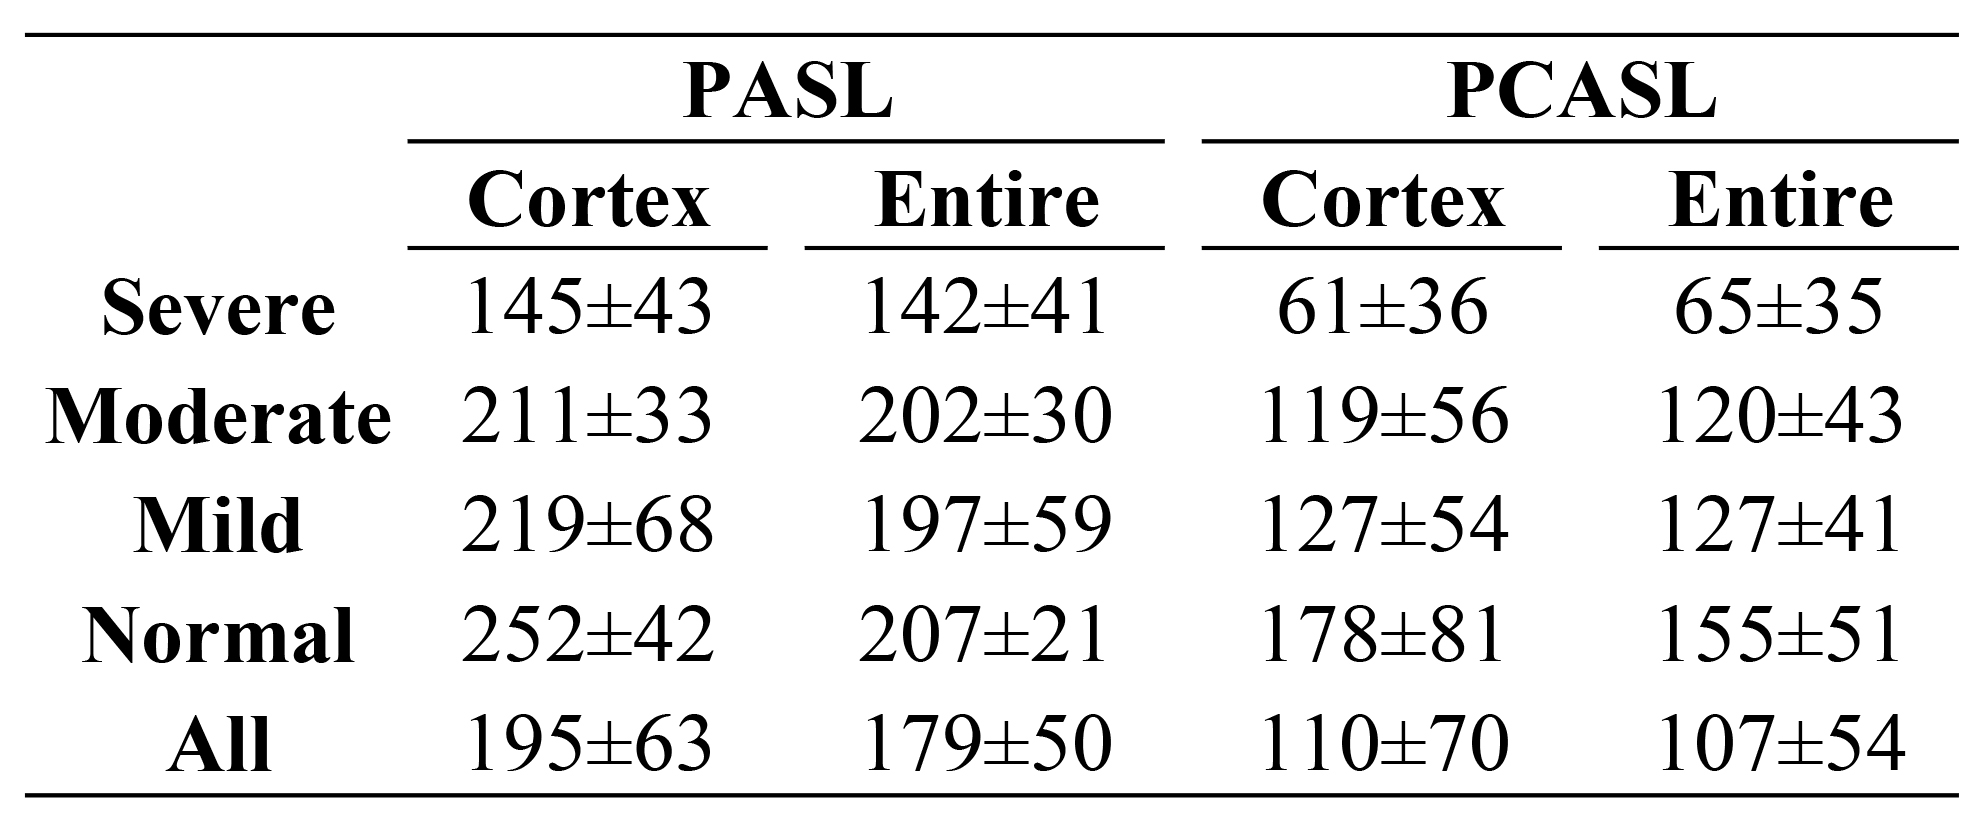
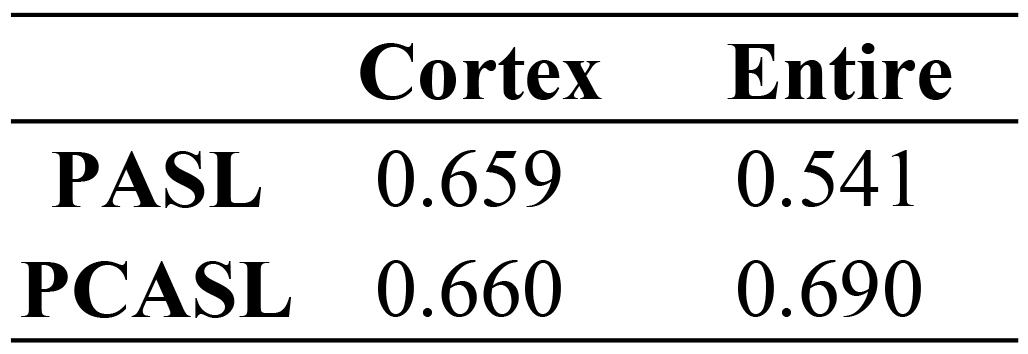
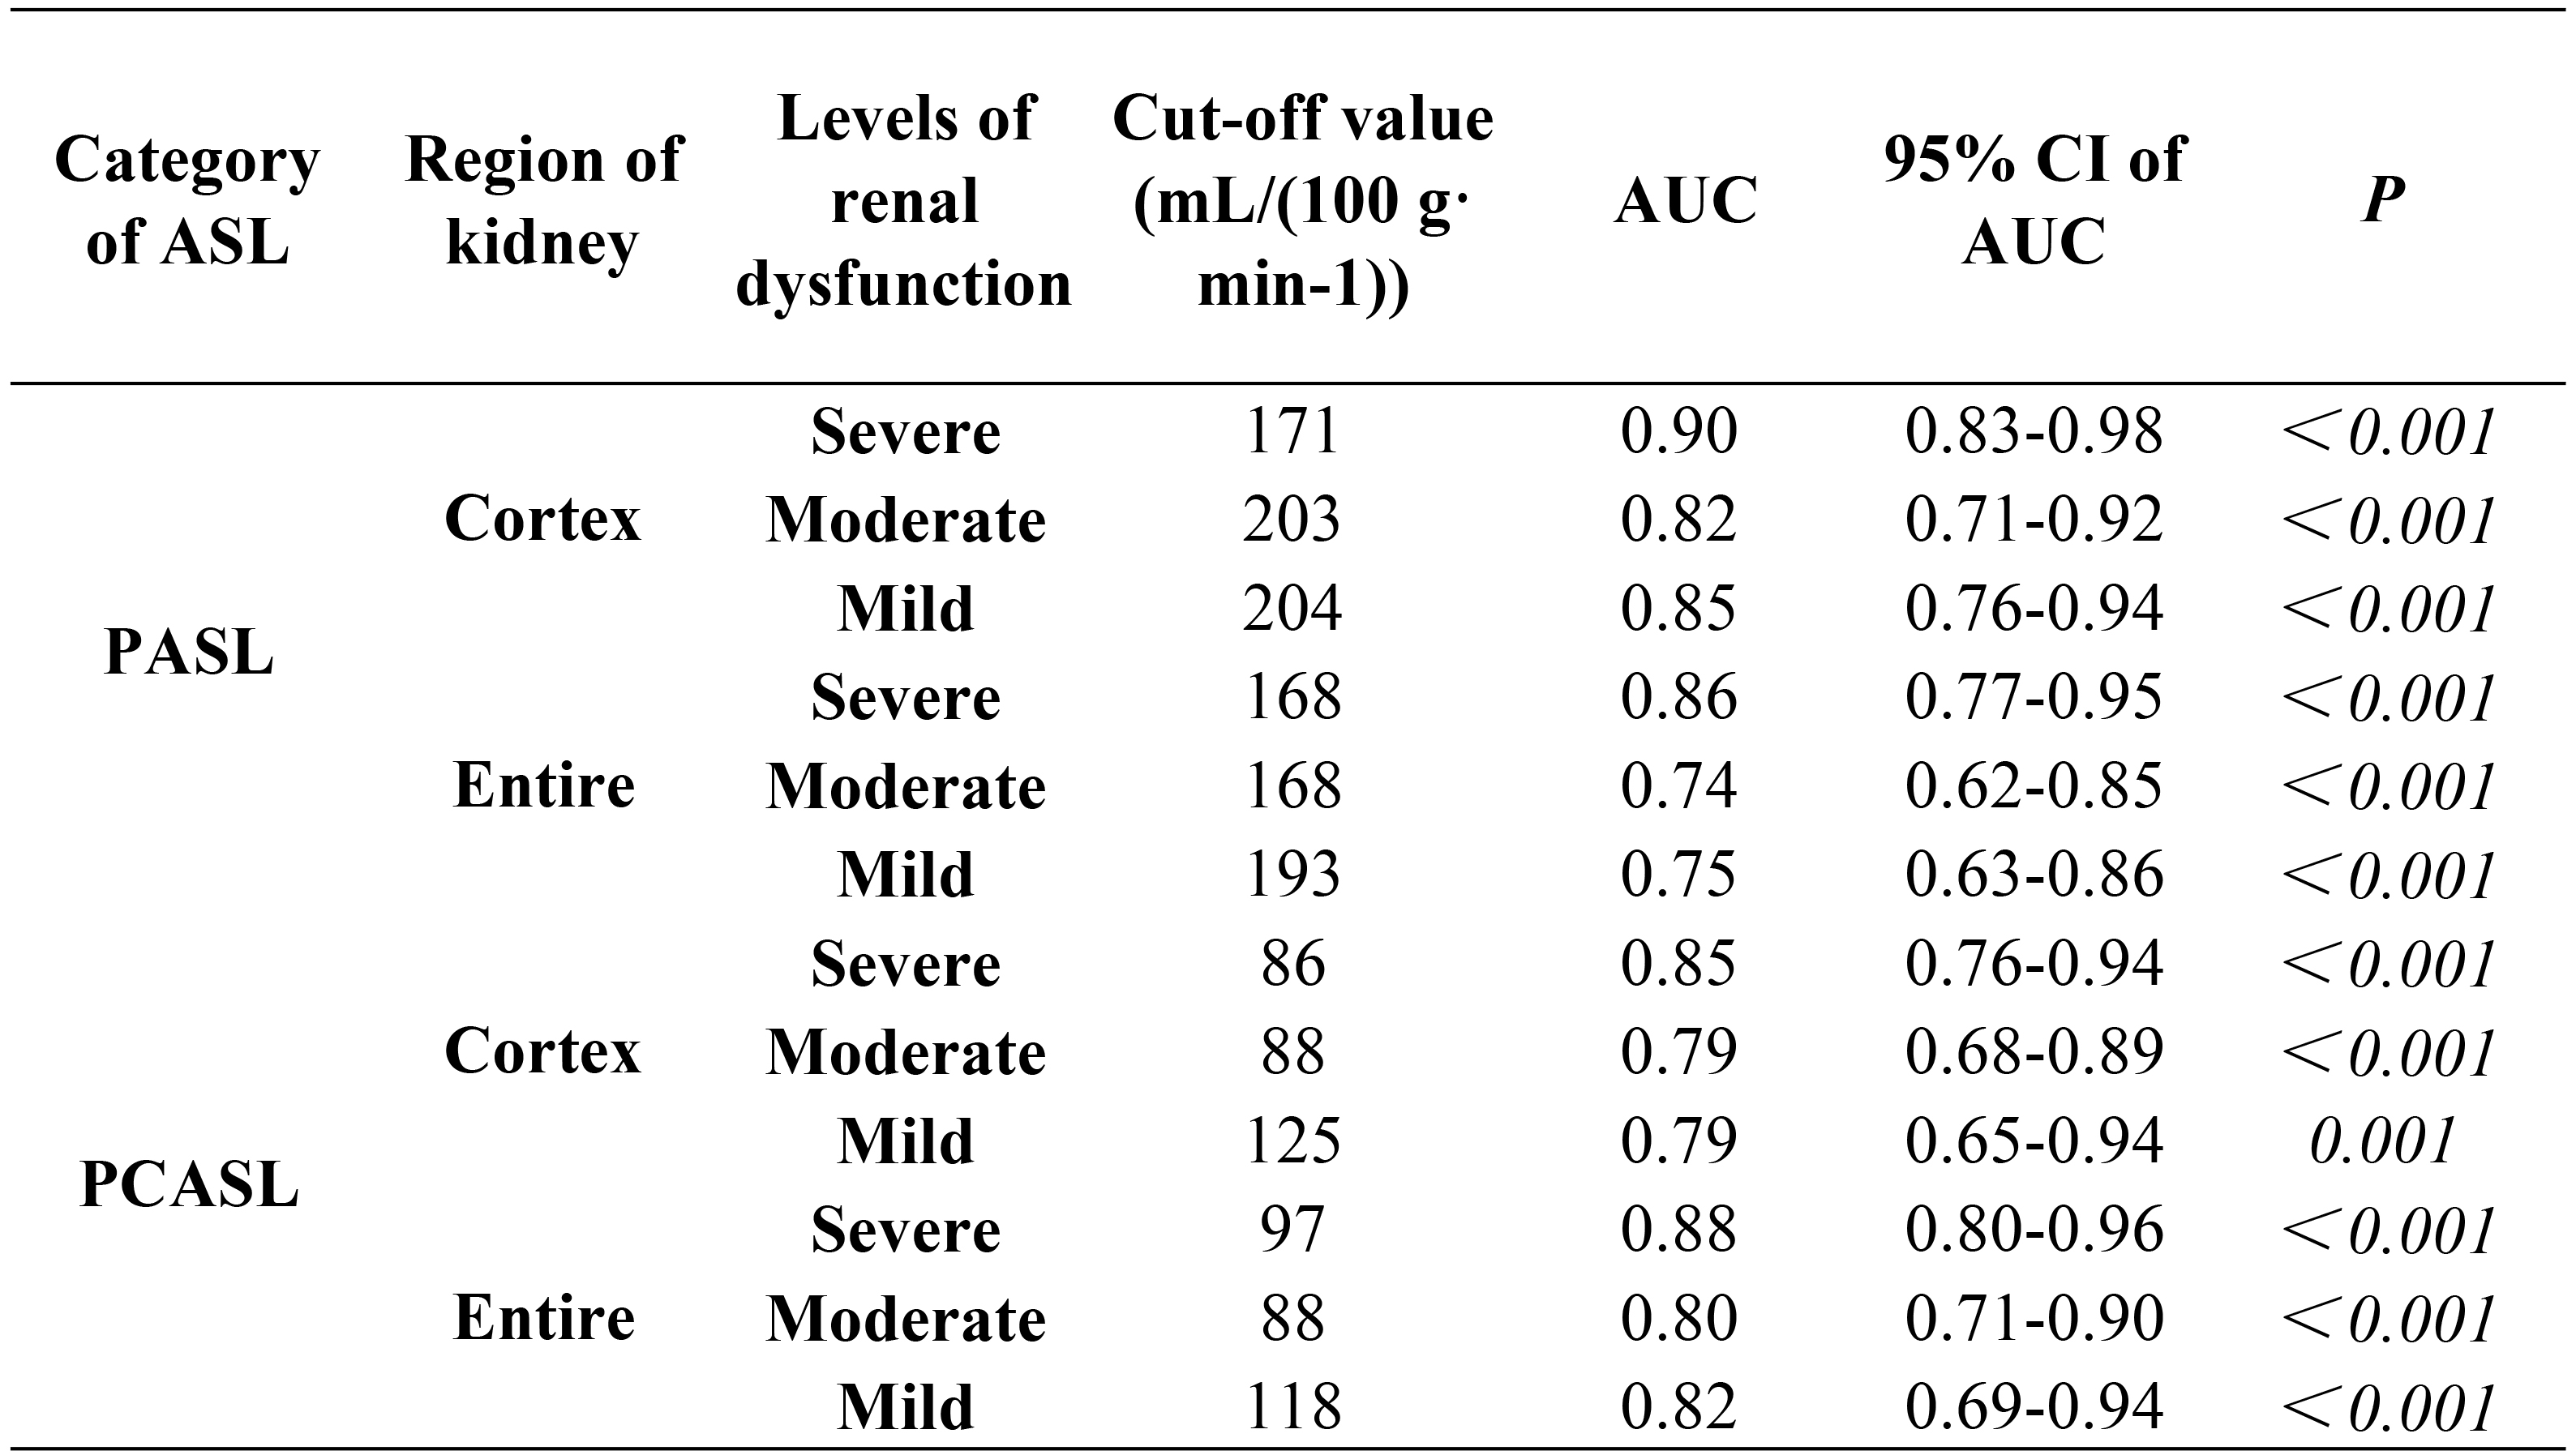
The RBF maps obtained with PASL and pCASL from a representative patient are shown in Figure 1. In general, higher RBF was observed using PASL compared with pCASL (Table1). Pearson correlation analysis demonstrated that RBF was strongly correlated with GFR (all P<0.01) (Table 2). The highest correlation coefficient was for RBF and pCASL of the entire kidney (r=0.69). Cut-off values and AUCs of RBF in the renal cortex and entire kidney with PASL and pCASL in the differential diagnosis of different levels of renal dysfunction are shown in Table 3. Renal cortex assessed with PASL showed the highest values.Discussion
This study found that the average RBF values obtained using PASL were higher than for pCASL. Data obtained with PASL for mean RBF in the entire kidney and renal cortex were in agreement with previous studies1,2, indicating that RBF measurements obtained using PASL were closer to the true values for RBF. The correlation between the RBF and GFR was strong using PASL and pCASL in the renal cortex. However, the correlation coefficient for PASL was lower than that for pCASL in the entire kidney, suggesting that pCASL is more sensitive to perfusion changes in renal function than PCASL. The AUCs for RBF in renal cortex obtained with PASL were highest, indicating greater clinical value in the differential diagnosis of different levels of renal dysfunction. However, the AUCs for the diagnosis of moderate renal dysfunction were lower than mild and severe renal dysfunction. In addition, for both PASL and pCASL, the cut-off values of RBF in the diagnosis of moderate renal dysfunction were similar or identical to the cut-off values of RBF in the diagnosis of mild or severe renal dysfunction.Conclusion
This study demonstrates that ASL MRI can be used for the differential diagnosis of renal dysfunction. RBF values in renal cortex obtained with PASL provide an accurate index for differential diagnosis of renal dysfunction, while RBF obtained with pCASL more accurately reflects GFR. These findings indicate that PASL and pCASL may have high clinical value for the diagnosis of patients with renal artery stenosis and renal insufficiency.Acknowledgements
None.References
1. Roberts DA, Detre JA, Bolinger L, et al.Renal perfusion in humans: MR imaging with spin tagging of arterial water. Radiology, 1995, 196:281–286.
2. Michael F, Petros M, Juergen L, et al. Perfusion MR imaging with FAIR true FISP spin labeling in patients with and without renal artery stenosis: initial experience. Radiology, 2006, 238(3):1013-21.
3.Zuo L , Ma Y C , Zhou Y H , et al. Application of GFR-estimating equations in Chinese patients with chronic kidney disease. American Journal of Kidney Diseases, 2005, 45(3):463-472.
4.You S, Ma X, Zhang C, et al. Determination of single-kidney glomerular filtration rate (GFR) with CT urography versus renal dynamic imaging Gates method. European Radiology, 2018,28(3):1077-1084.
5.Ma N, Sun YJ, Ren JH, et al.Characteristics of renal cortical perfusion and its association with renal function among elderly patients with renal artery stenosis. Zhonghua Xin Xue Guan Bing Za Zhi ,2019,47(8):628-633.
Figures