0950
T2 and diffusion tensor imaging of kidney disease in an epicutaneous TLR7 enhanced lupus mouse model1Genentech, South San Francisco, CA, United States
Synopsis
System lupus erythematosus (SLE) is an autoimmune disease that can lead to lupus nephritis and glomerulonephritis. Studies have evaluated kidneys from SLE patients using diffusion-weighted imaging. However, specific MRI metrics most related to the underlying disease has not been identified. In this study, we evaluate a lupus model with MRI and determine the physical properties that contribute to the MRI signal. This is achieved through structural analysis of glomeruli with whole kidney 3D micro-CT and pathological evaluation of glomeruli, tubules, interstitium, and arterioles. Finally, a comprehensive correlation analysis is performed to determine top MRI metrics most sensitive to the disease.
Introduction
System lupus erythematosus (SLE) is an autoimmune disease that can lead to inflammatory diseases such as lupus nephritis and glomerulonephritis. Management and diagnosis of the kidney in SLE patients can be critical as renal injury greatly affects long-term survival. Studies have evaluated kidneys from SLE patients using diffusion-weighted imaging and other MRI contrast mechanisms (1-3). While these imaging metrics showed a difference between healthy controls and SLE patients, the underlying biological injury is difficult to determine without whole kidney histology. In this study, we evaluate an animal model of lupus with MRI and determine the physical properties that contribute to the MRI signal source using high resolution endpoints. These endpoints include structural analysis of glomeruli with whole kidney 3D micro-CT and pathological evaluation of glomeruli, tubules, interstitium, and arterioles using whole kidney PAS histology. Finally, a comprehensive and cumulative correlation analysis with imaging and proteinuria is performed to determine top MRI metrics most sensitive to the disease.Methods
Animal model: Animal procedures were approved by the institutional AAALAC-accredited review board. Two groups were used: 1) FVB/NJ (Jackson Laboratory) control (n=10), and 2) FVB/NJ lupus model (n=5). In the lupus group, animals were topically administered with 100µg imiquimod R848 in 50µl acetone for 3 times/week for the study duration. R848 was used as the TLR7 agonist for inducing lupus-like autoimmunity (4). Animals were imaged longitudinally from baseline and at week 2, 4, and 6 post R848 administration. Proteinuria was measured weekly. During the study, some animals and datasets were excluded due to severe clinical conditions or image motion artifacts.MRI: During imaging, animals were anaesthetized with ~2% isoflurane and maintained at 37C. Imaging was performed on a Bruker 7T with a volume transmit and cryogenic surface receive coil. A custom in vivo holder was constructed with 3D printing to provide secure positioning of the animal. A T2 map covering the kidney was generated with a multi-slice multi-echo sequence: TR=4s, TE1/spacing/TE8=10/10/80ms (8 echoes), matrix=110×110×16, and resolution=200×200×1000μm3. DTI was performed using single-shot EPI: TR=4s, TE=42ms, gradient directions=20, matrix=110×110×16, and resolution=200×200×1000μm3. DTI was used to compute parametric maps: fractional anisotropy (FA), mean diffusivity (MD), axial diffusivity (AD), and radial diffusivity (RD). Measurements were made in renal regions: cortex (CO), outer medulla (OM), and inner medulla (IM).
Micro-CT and histology: Animals were perfused with a CT contrast agent and immersion fixed 1 day after the final MRI. Renal vasculature filling and glomeruli imaging are described previously (5). Post micro-CT imaging, kidneys were sectioned and prepared for Periodic Acid Schiff (PAS) histology. Glomeruli, tubules, interstitium, and arterioles were graded by a veterinary pathologist on a scale of 0 to 4, where 4 represents the most severe pathology. Glomeruli were evaluated for changes in size, lobulation, adhesions, fibrosis, thickening of basement membranes, cellularity increase, leukocyte infiltration, and capillary thrombi. Tubules were evaluated for atrophy, necrosis, vacuolar and hyaline droplets, membrane thickening, dilation, inflammatory cells, and lumen casts. Interstitium was evaluated for fibrosis, edema, and leukocyte infiltration. Arterioles were evaluated for fibrosis, thrombosis, and hyaline. The combined score is the summation of the 4 scores.
Results
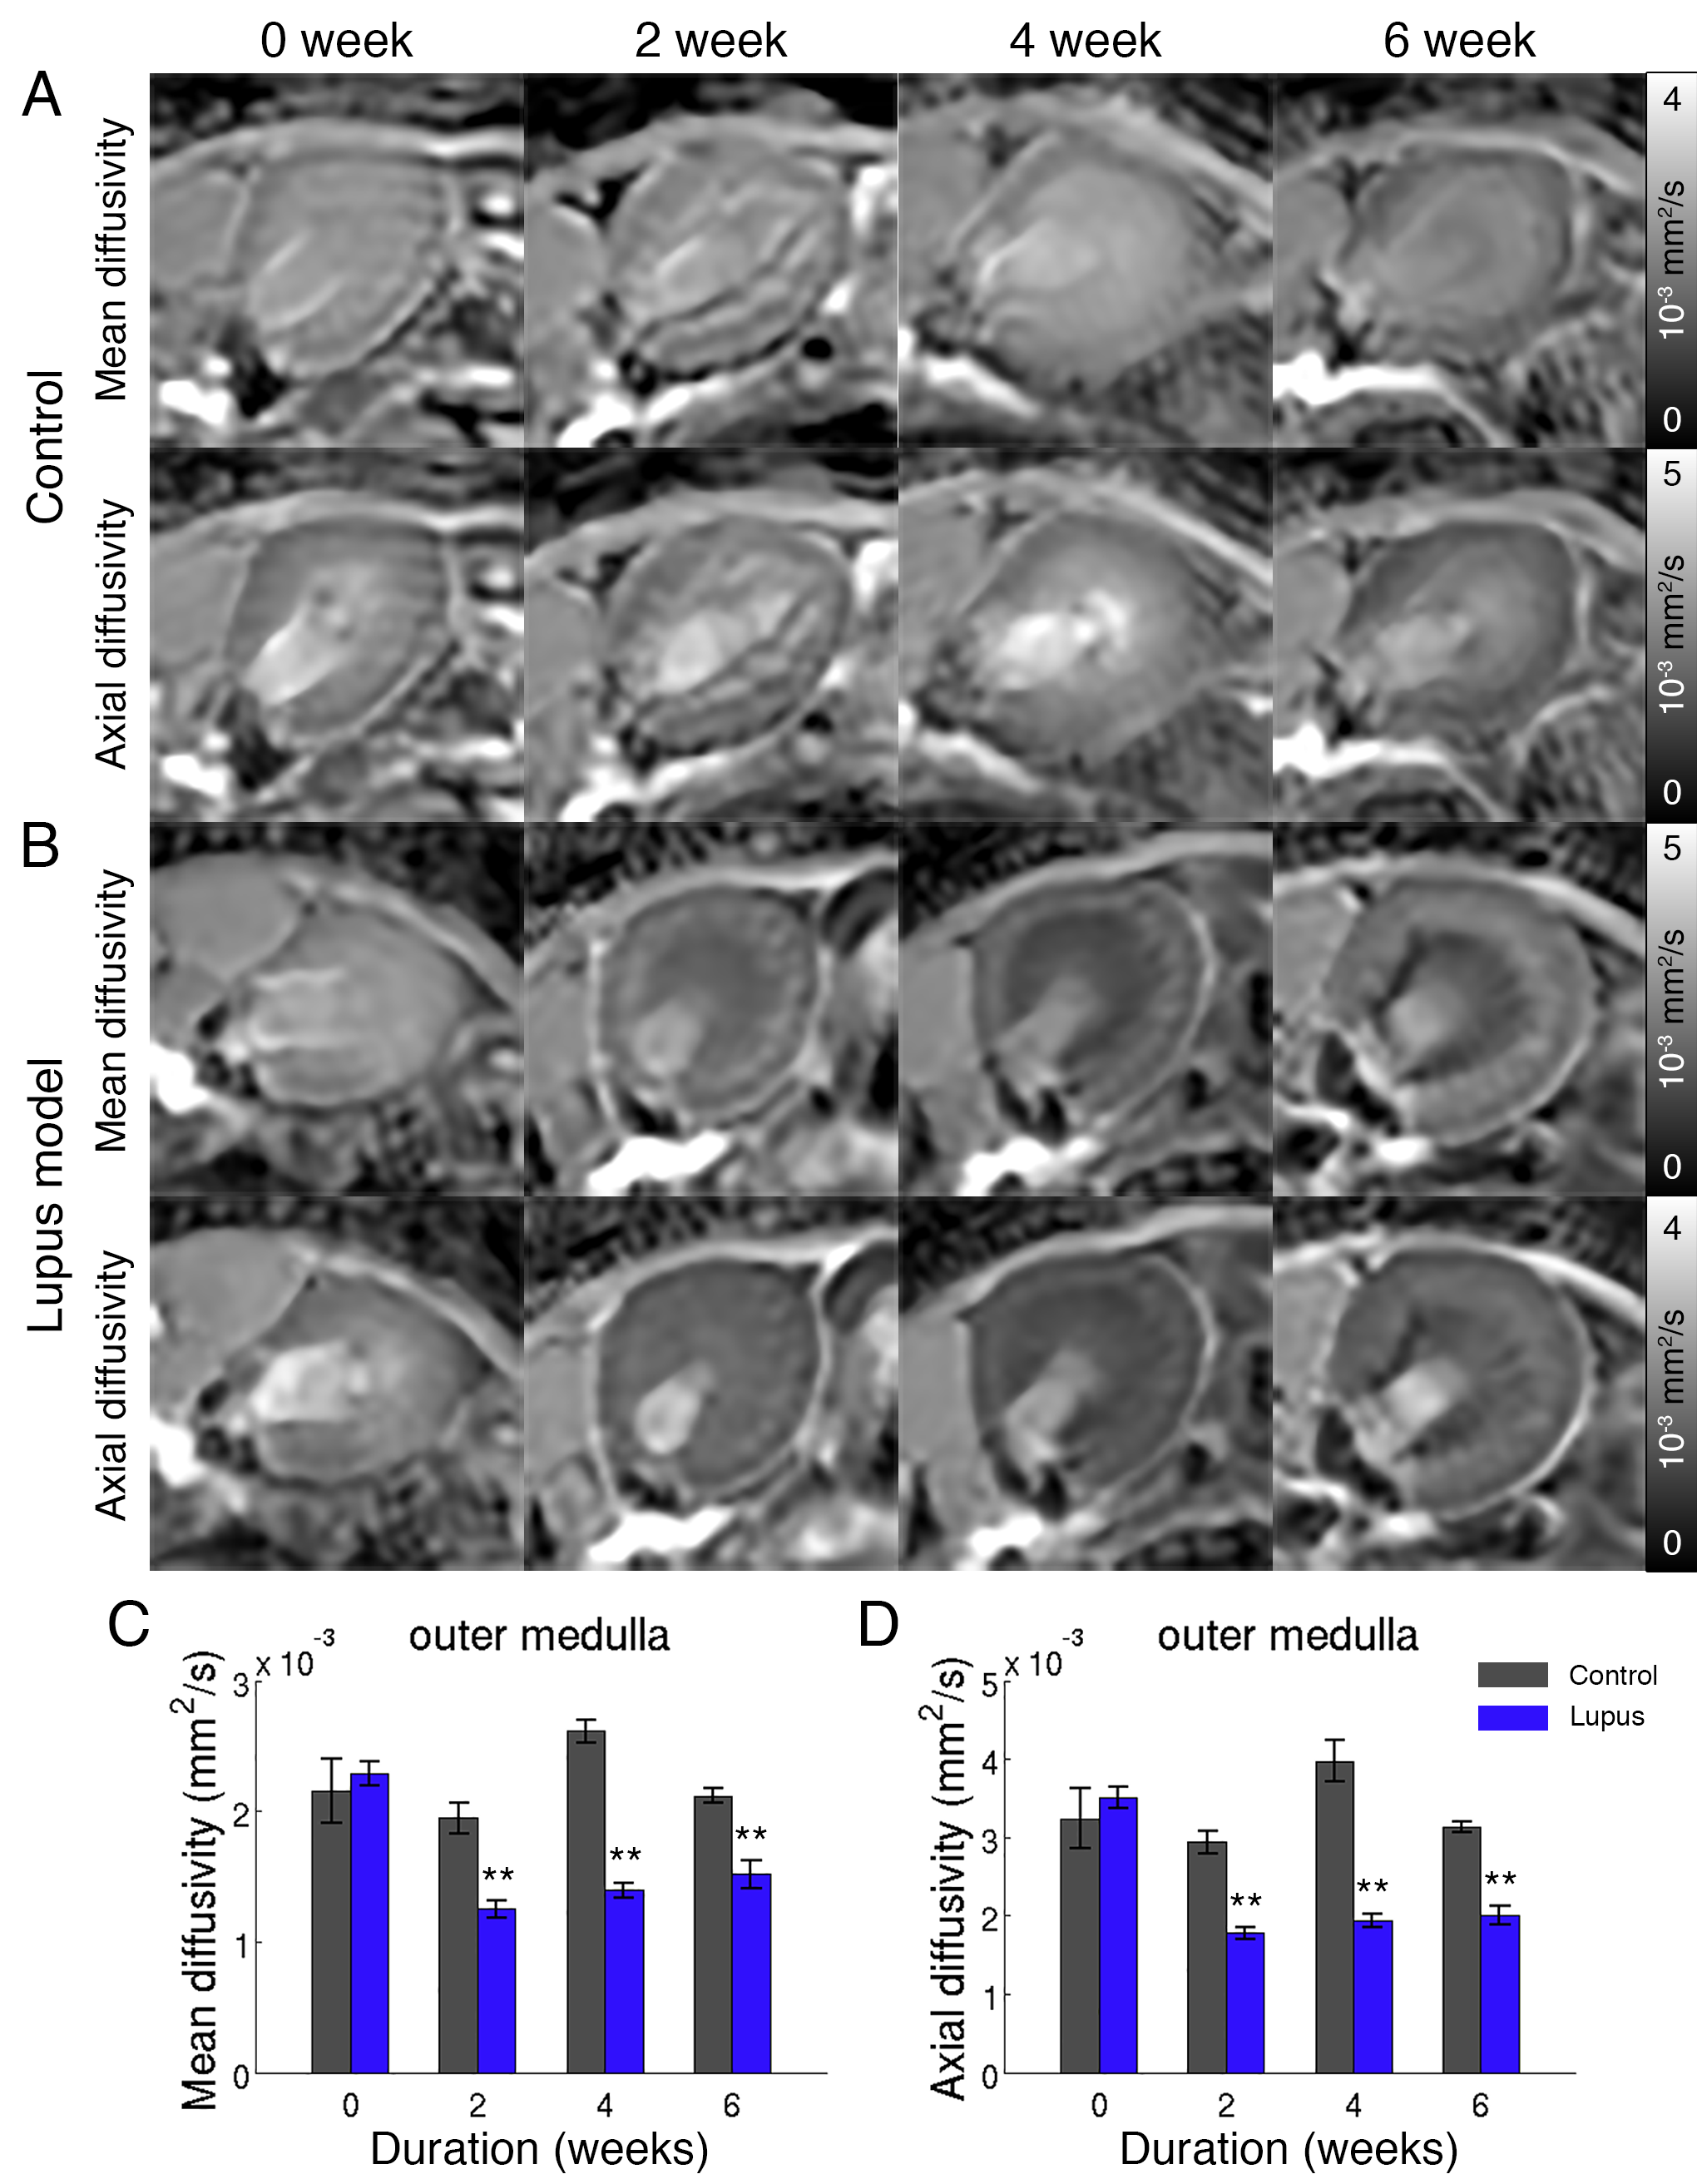
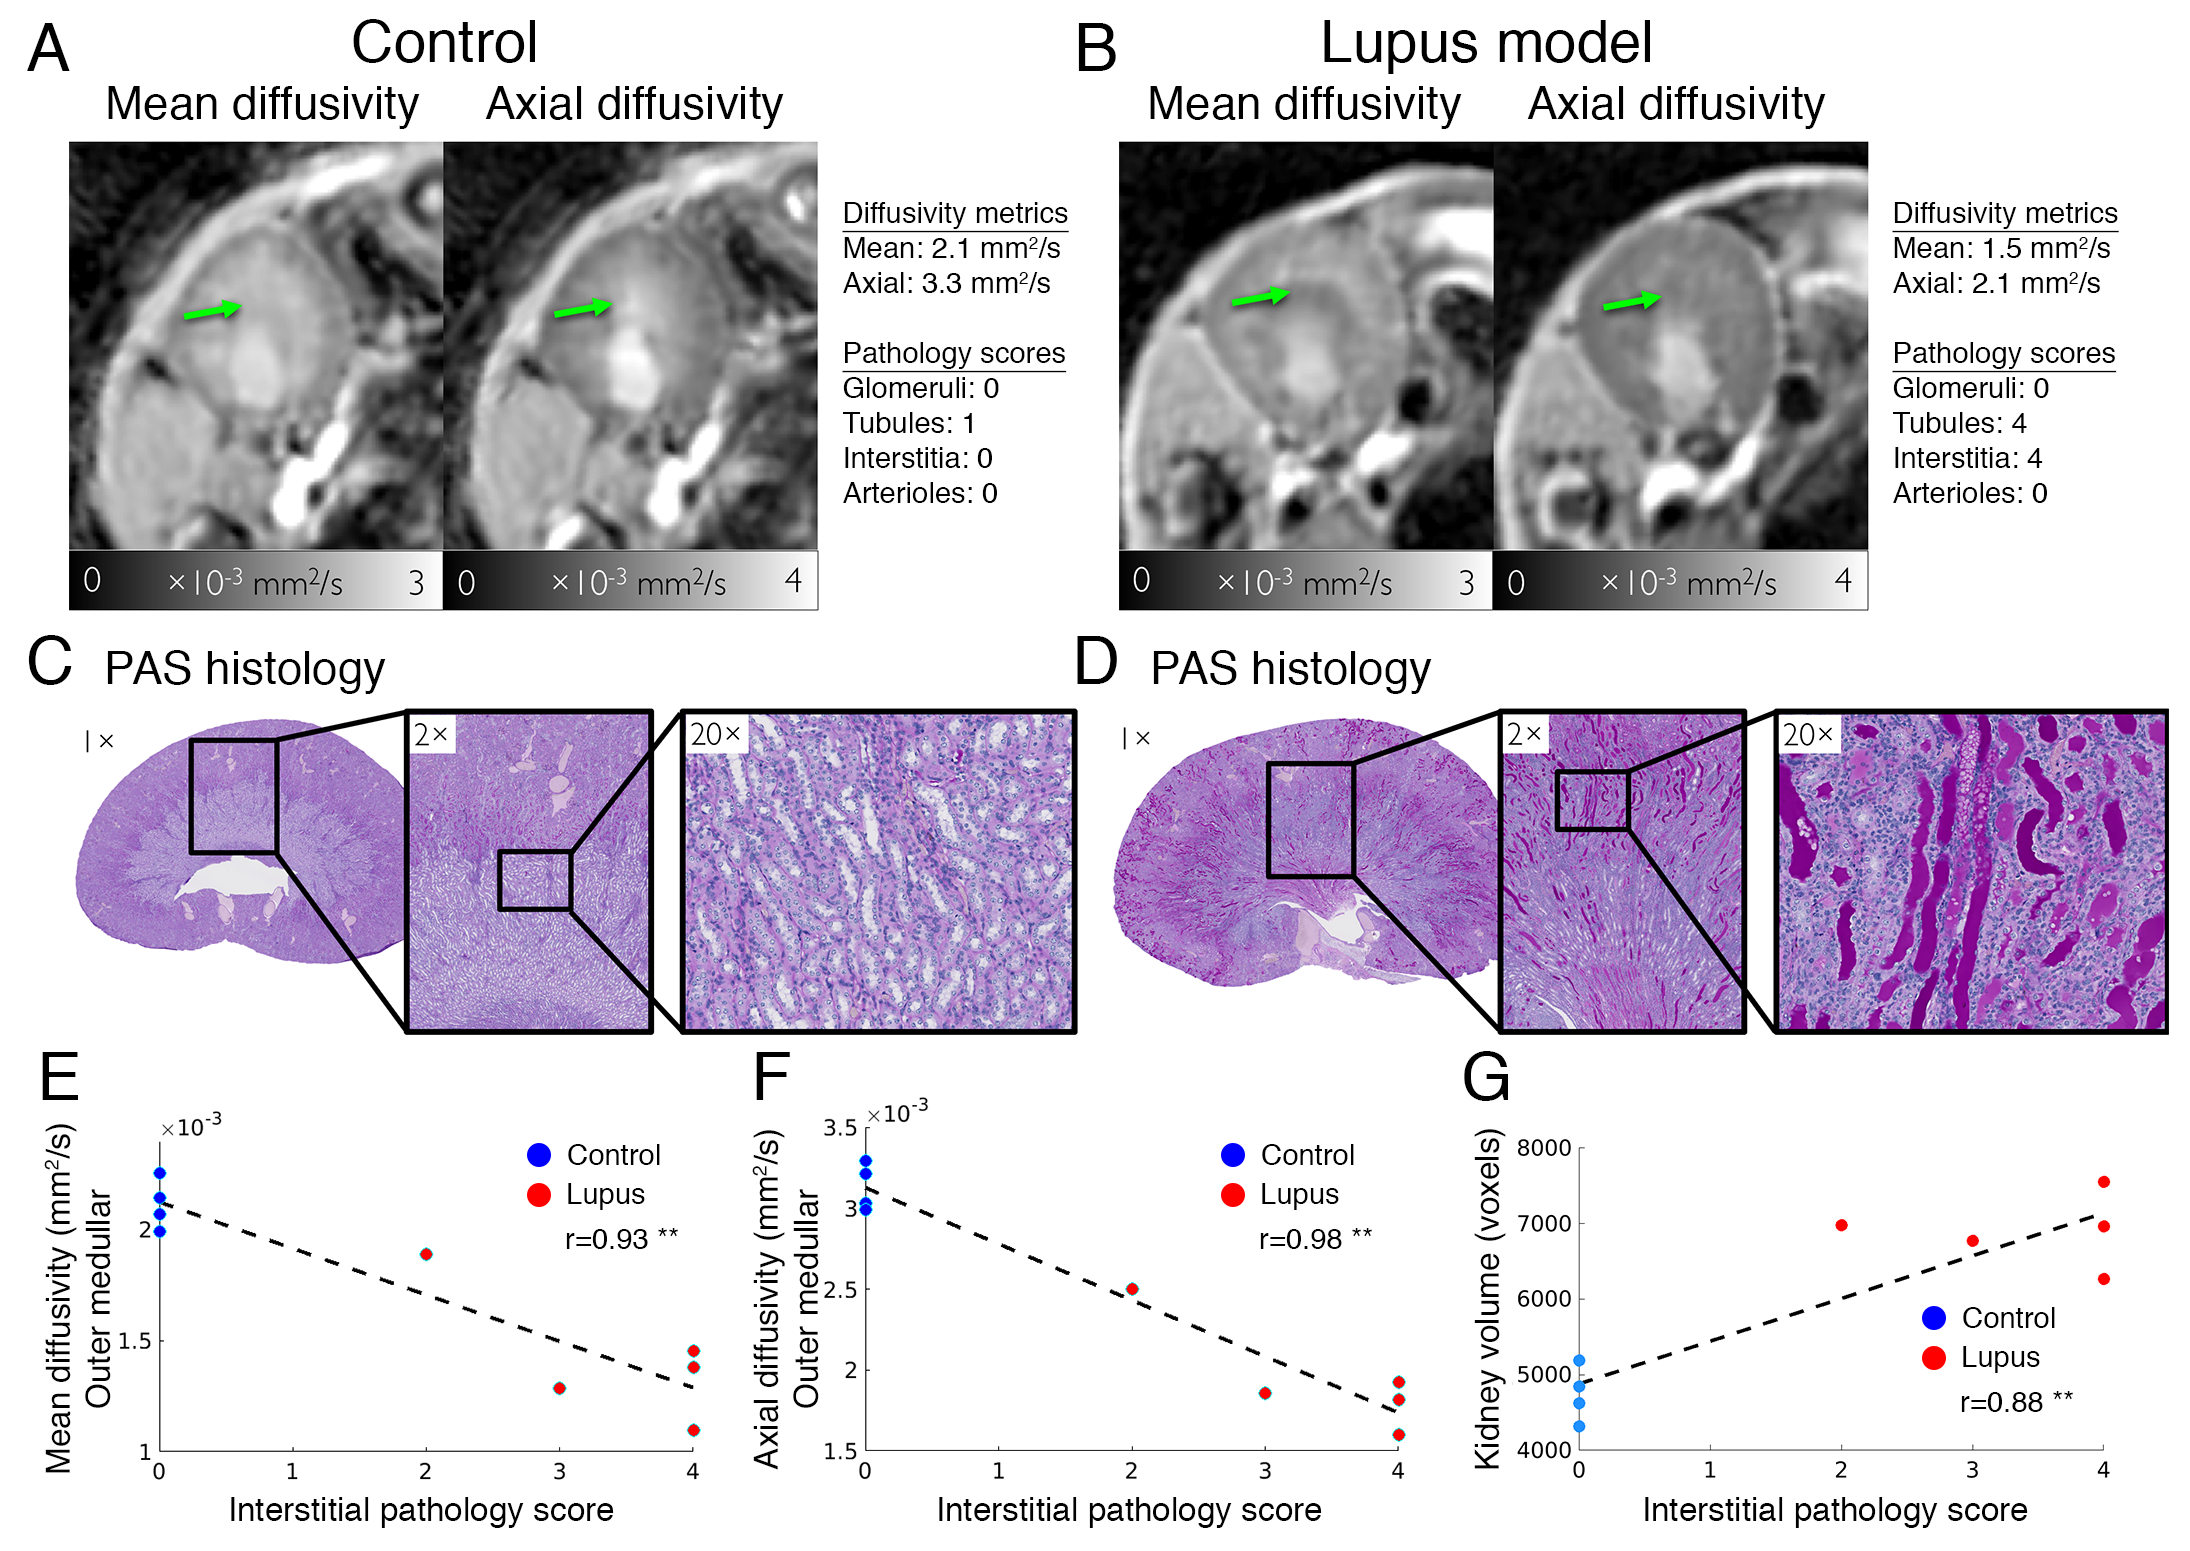
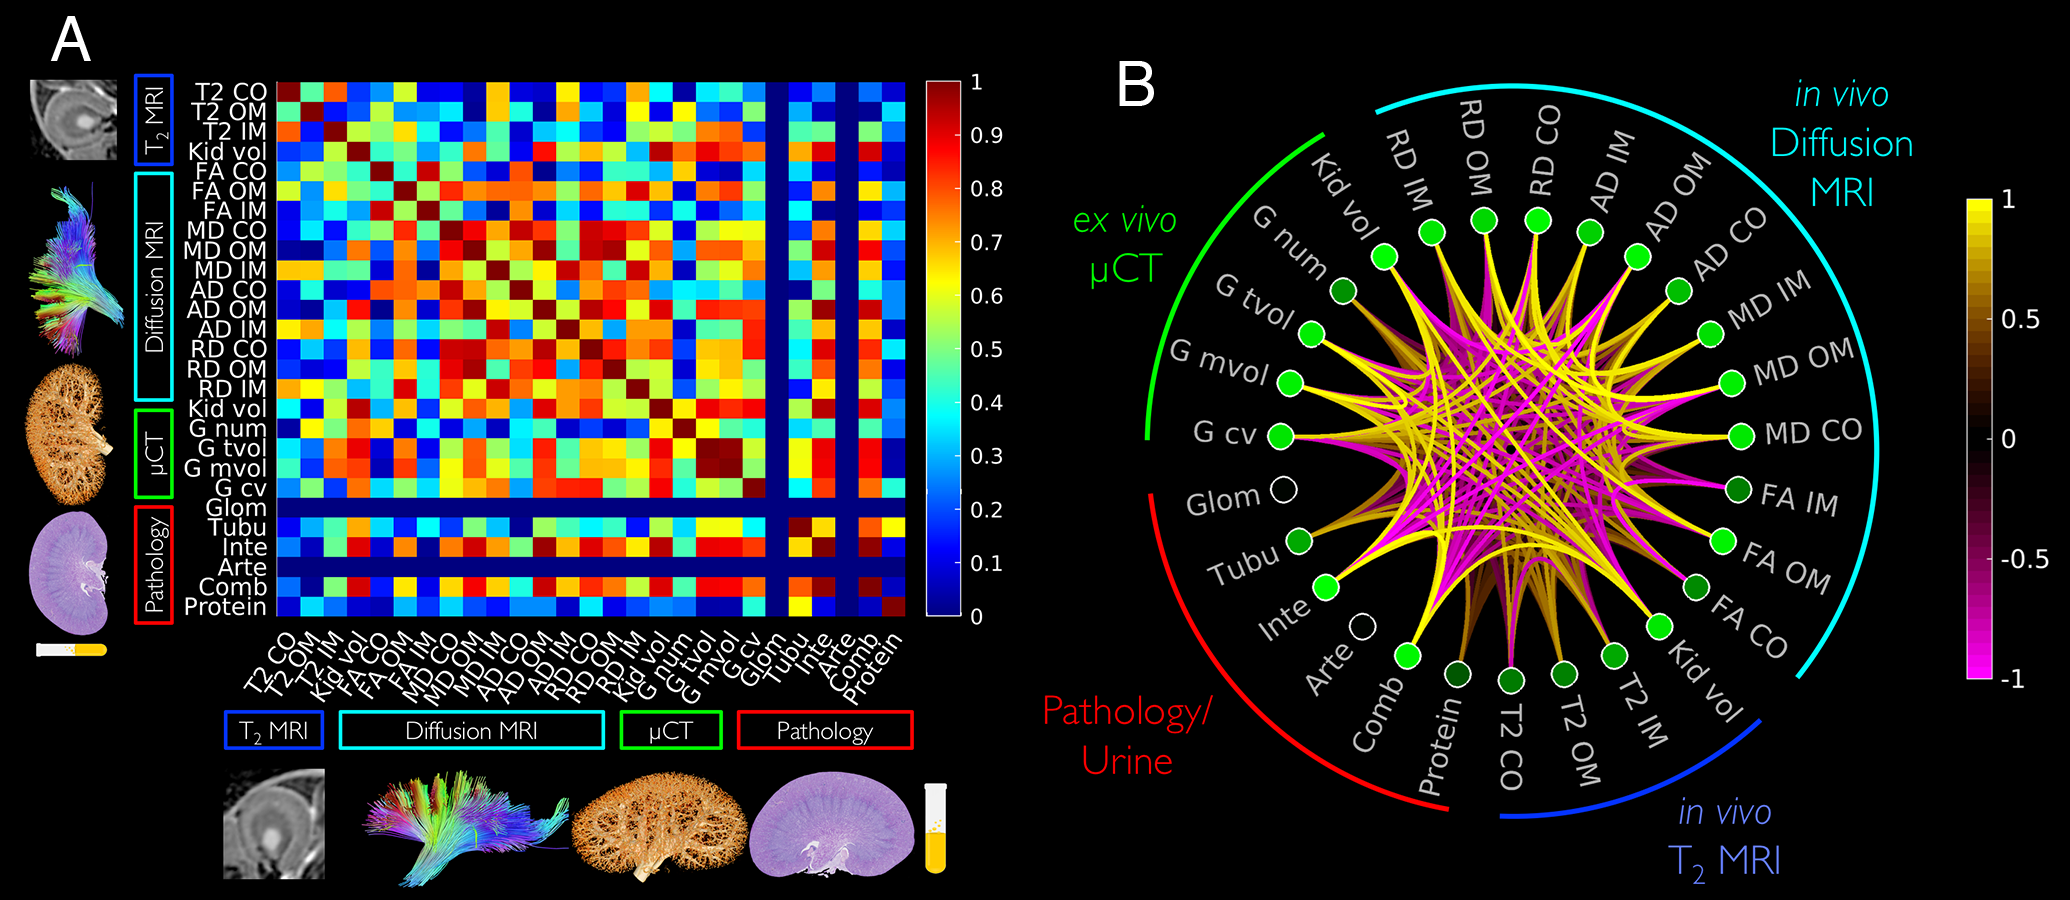
Example diffusion parametric maps are shown in Fig. 1. The lupus group showed significant differences compared to the control 2 weeks post R848 administration. Mean and axial diffusivities decreased in the lupus group compared to control (Fig. 2A-2B). The imaging metrics were compared and correlated with PAS histology and pathology scores (Fig. 2C-2G). Correlation between all imaging metrics, pathology scores, and proteinuria is shown in Fig 3. The top three most correlated in vivo metrics include: 1) kidney volume from T2 weighted images, 2) mean diffusivity in the outer medulla, and 3) axial diffusivity in the outer medulla when correlated with interstitium pathology score (Fig. 3A). Similarly, these three in vivo metrics also showed the highest cumulative correlation (Fig. 3B). The top pathology cumulative correlation is the interstitium. Proteinuria scored the lowest cumulative correlation among all metrics.Discussion and Conclusion
In this study, we demonstrate that MRI diffusivity metrics can distinguish renal injuries in a model of lupus when compared to control animals. Using a comprehensive correlation analysis of in vivo MRI, ex vivo micro-CT, pathology scores, and proteinuria, we found three MRI metrics to be highly correlated with high resolution endpoints. Among these metrics, axial diffusivity in the outer medulla has the highest correlation of 0.98 with interstitial pathology score (Fig 2. F). The significant decrease of axial diffusivity can be visually confirmed with inflammation and protein deposits inside the lumen of tubules found in histology (Fig. 2D). The cumulative correlation analysis helped confirm the type of renal injury in this lupus animal model. Here, interstitial inflammation was the most prevalent while fibrosis was negligible. Proteinuria, having the lowest cumulative correlation, can possibly be a very modest diagnostic marker of this kidney disease. If the imaging metrics are highly representative of the underlying disease, this approach can also be used to stratify and refine the animal model of lupus. The diffusion imaging methods have the potential to be translated for clinical studies and evaluation of novel therapeutics for lupus and inflammatory renal diseases.Acknowledgements
No acknowledgement found.References
1. Karadeli E, Ulu EM, Yildirim E, Yilmaz S. Diffusion-weighted MR imaging of kidneys in patients with systemic lupus erythematosus: initial experience. Rheumatology international 2010;30(9):1177-1181.
2. Li X, Xu X, Zhang Q, Ren H, Zhang W, Liu Y, Yan F, Chen N. Diffusion weighted imaging and blood oxygen level-dependent MR imaging of kidneys in patients with lupus nephritis. J Transl Med 2014;12:295.
3. Thurman JM, Serkova NJ. Non-invasive imaging to monitor lupus nephritis and neuropsychiatric systemic lupus erythematosus. F1000Res 2015;4:153.
4. Yokogawa M, Takaishi M, Nakajima K, Kamijima R, Fujimoto C, Kataoka S, Terada Y, Sano S. Epicutaneous application of toll-like receptor 7 agonists leads to systemic autoimmunity in wild-type mice: a new model of systemic Lupus erythematosus. Arthritis Rheumatol 2014;66(3):694-706.
5. Xie L, Koukos G, Barck K, Foreman O, Lee WP, Brendza R, Eastham-Anderson J, McKenzie BS, Peterson A, Carano RAD. Micro-CT imaging and structural analysis of glomeruli in a model of Adriamycin-induced nephropathy. American journal of physiology Renal physiology 2019;316(1):F76-F89.
Figures