0949
Iopamidol CEST MR Urography for Urinary Tract Obstructions1The Russell H. Morgan Department of Radiology and Radiological Science, The Johns Hopkins University School of Medicine, Baltimore, MD, United States, 2Department of Urology, The Johns Hopkins University School of Medicine, Baltimore, MD, United States, 3F.M. Kirby Research Center for Functional Brain Imaging, Kennedy Krieger Institute, Baltimore, MD, United States
Synopsis
Urinary tract obstructions (UTOs) are impairments in urine flow which can lead to pain, infection and irreversible kidney damage if left undiagnosed or untreated. Chemical exchange saturation transfer (CEST) is a novel MRI contrast mechanism that is particularly sensitive to environmental changes including changes in pH values. In this study we developed a protocol by administering the FDA approved iopamidol to obtain dynamic pH and perfusion MRI contrast maps of the kidneys and compared these with iopamidol administered multi-phase CT in a unilateral urinary obstruction mouse model.
Target Audience:
MR Researchers, radiologists, urologists and nephrologists interested in renal imagingPurpose:
Develop a novel CEST pH imaging protocol for characterizing and monitoring urinary tract obstructionsIntroduction:
Ureteral obstruction is a blockage in one or both of the tubes (ureters) that carry urine from the kidneys to the bladder. The causes of this obstruction may come from benign prostatic hyperplasia (BPH), neurogenic bladder, urethral stricture disease, certain types of bladder and ureteral cancers, or upper urinary tract pathologies such as ureteral stricture disease, abnormalities including kidney stones, sagging or bulging ureters or ureteropelvic junction (UPJ) obstruction. 99mTc Mercaptoacetylinetriglycine (MAG3) w/Lasix scintigraphy and four phase CT are commonly used methods to diagnose and characterize differential renal function which employ ionizing radiation1-3. In this study, a CEST MRI protocol is designed based on administration of CEST MRI pH probe, iopamidol4,5, and acquiring pH and perfusion maps of the kidneys for CEST MR urography6. We test these on UTO mouse model and compare with multi-phase CT using the same imaging agent, iopamidol.Methods:
CT experiments: In vivo CT experiments were performed on a PerkinElmer-IVIS® SpectrumCT scanner. The CT images were acquired using the Fast mode: voxel size 300μm, FOV(cm) 12*12*13, radiation dose estimate 13.2mGv, total time 90 seconds for each dynamic time point. Images were acquired for a total time of 30min after administering iopamidol.UTO mouse model: Mice were anesthetized with ~3% isoflurane. The anesthetized animal was placed in ventral recumbency with tail towards surgeon. A complete unilateral urinary obstruction (UUO) was performed after preparation of the surgical area through midline incision. The kidney and bladder were identified as well as the animal’s ureters. One ureter was suture ligated utilizing a 6-0 silk suture. The animals were then taken to CT/MRI for the first of two time points.
In vivo experiments: In vivo experiments are performed on a Bruker(Biospec 11.7T) horizontal preclinical MRI scanner using an 8-channel mouse body phase array coil. 7-8 set of pre-injection CEST images and high resolution 2-slice T2W images were acquired for the overlay of CEST contrast and pH images. After this, 100µL of CEST agent (Isovue-370) was injected into the tail vein and images of two coronal slices were acquired for 80min by toggling the saturation offsets between 5.5 and 4.2ppm along with 5 at 40ppm (M0 images). Other CEST MRI parameters: TE/TR = 3.55ms/11s, 7 block pulses of each 300ms were used for total saturation duration of 2100ms and 4μT power, acquisition time for each offset image = 11sec, matrix size = 64x64.
MRI data processing: The mean pre-injection z-spectra were subtracted from all post-injection images. 10-20 images were averaged using moving average filter to generate the corresponding parameter maps (contrast, pH). Pixel-by-pixel ST=(1-Mz/M0) was calculated to generate ST maps using 4.2, 5.5ppm. The pH was calculated using the in vitro generated calibration curve pixel-by-pixel6.
Results and Discussion
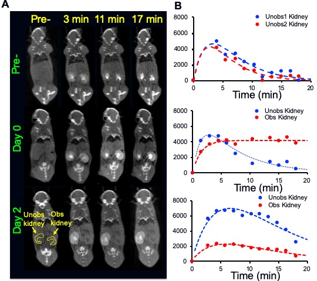
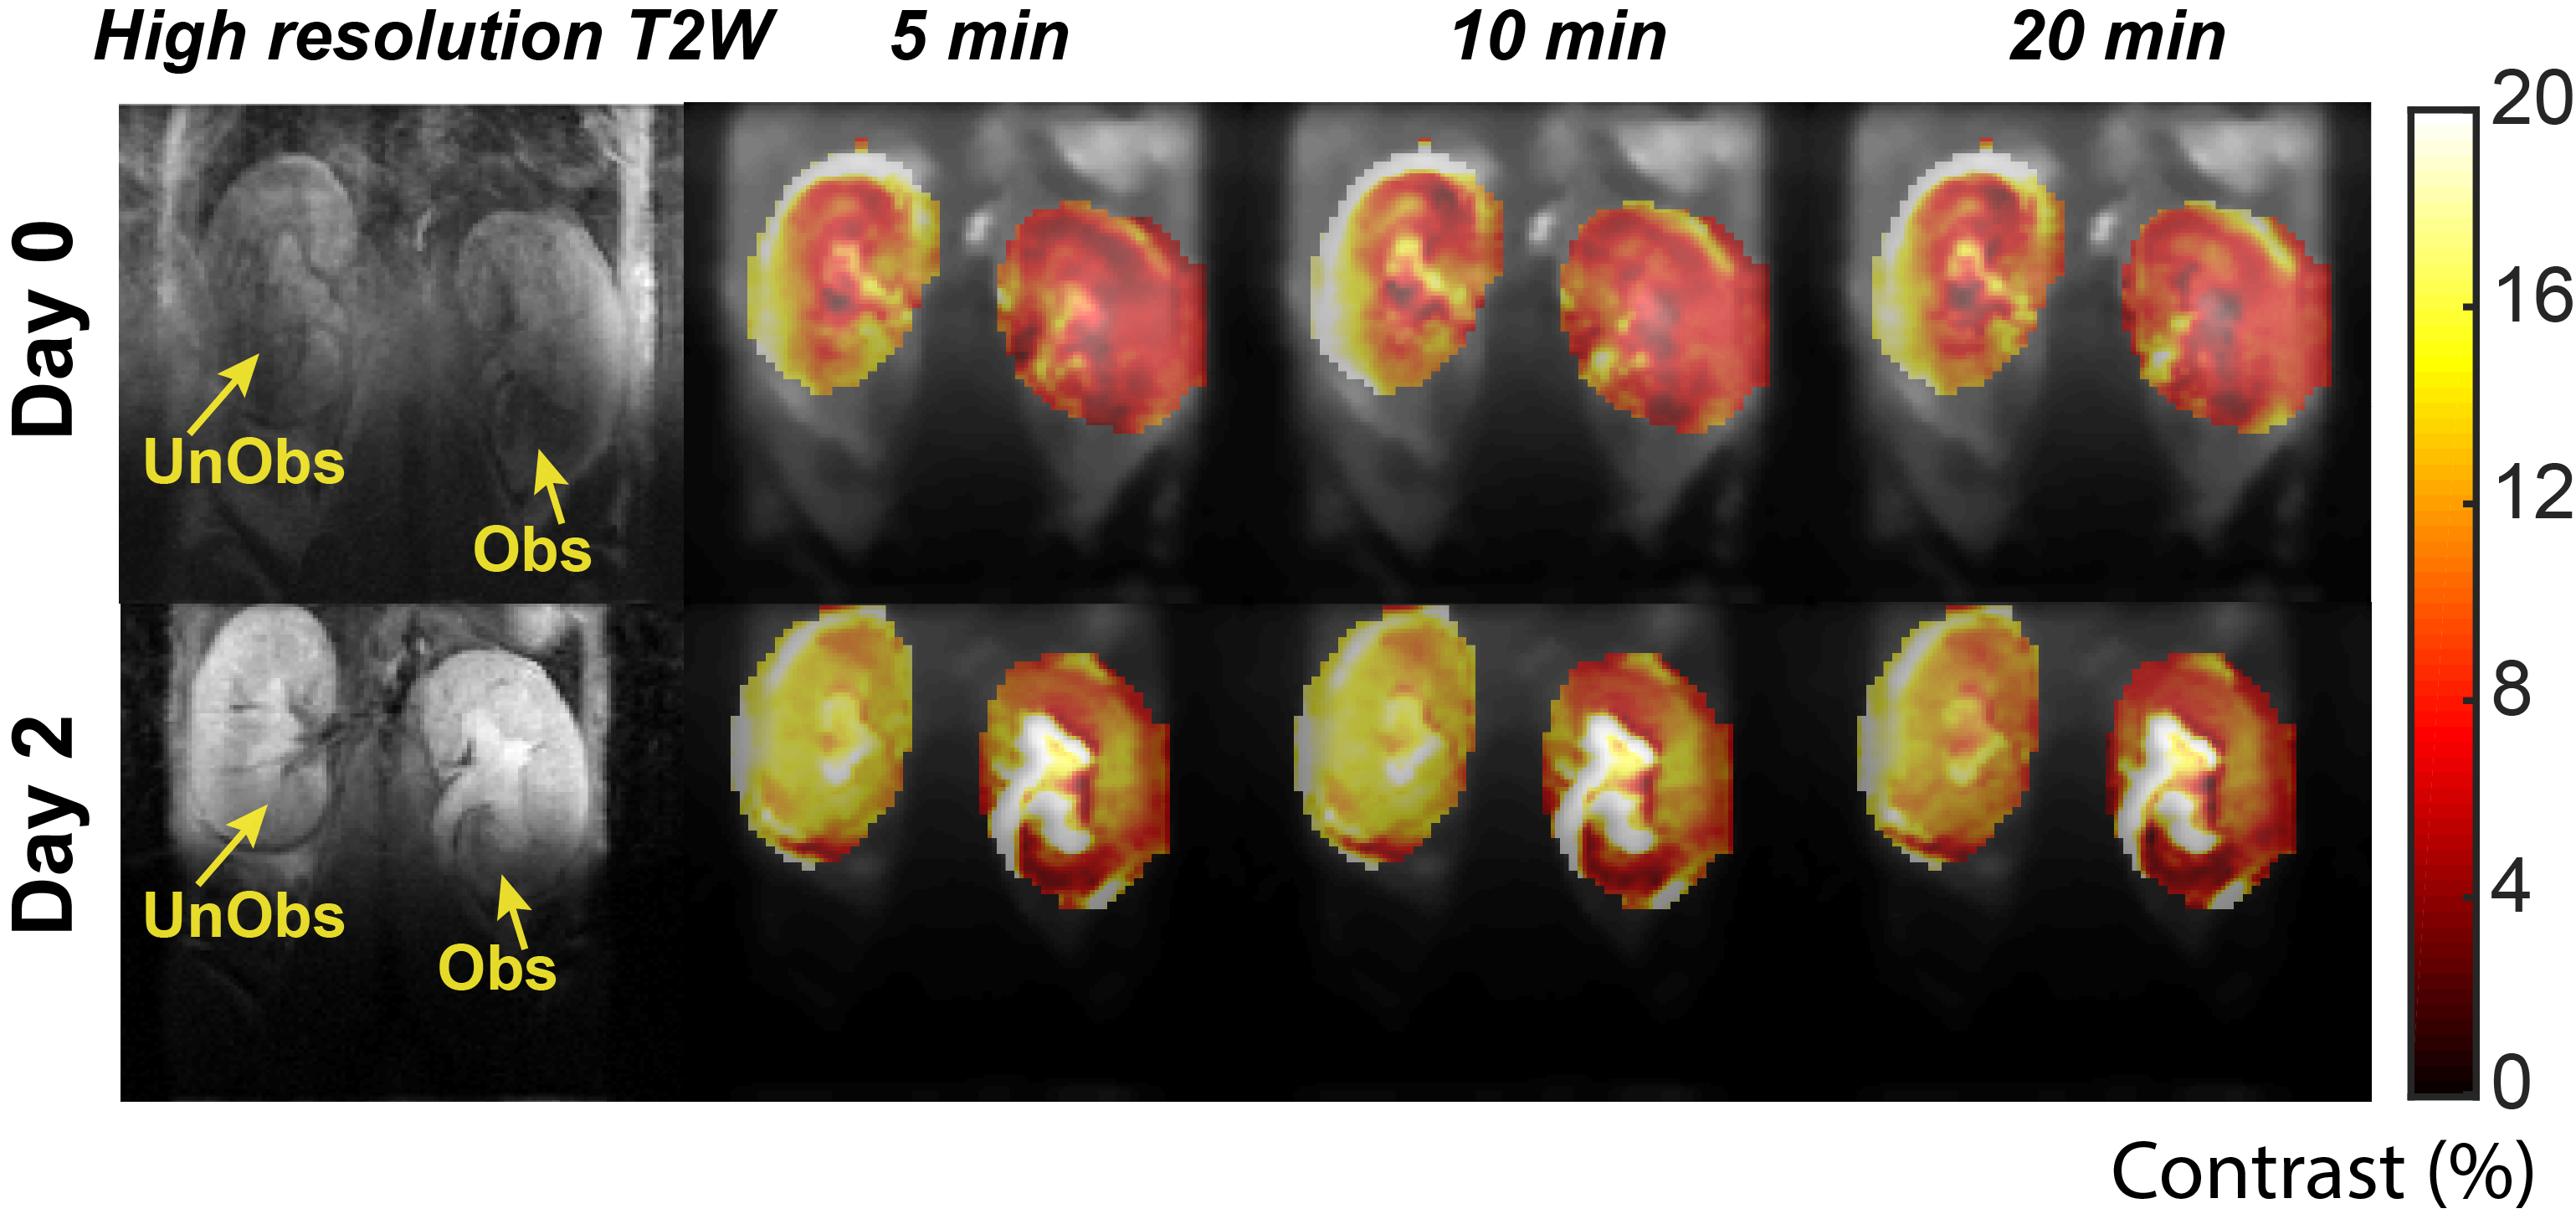
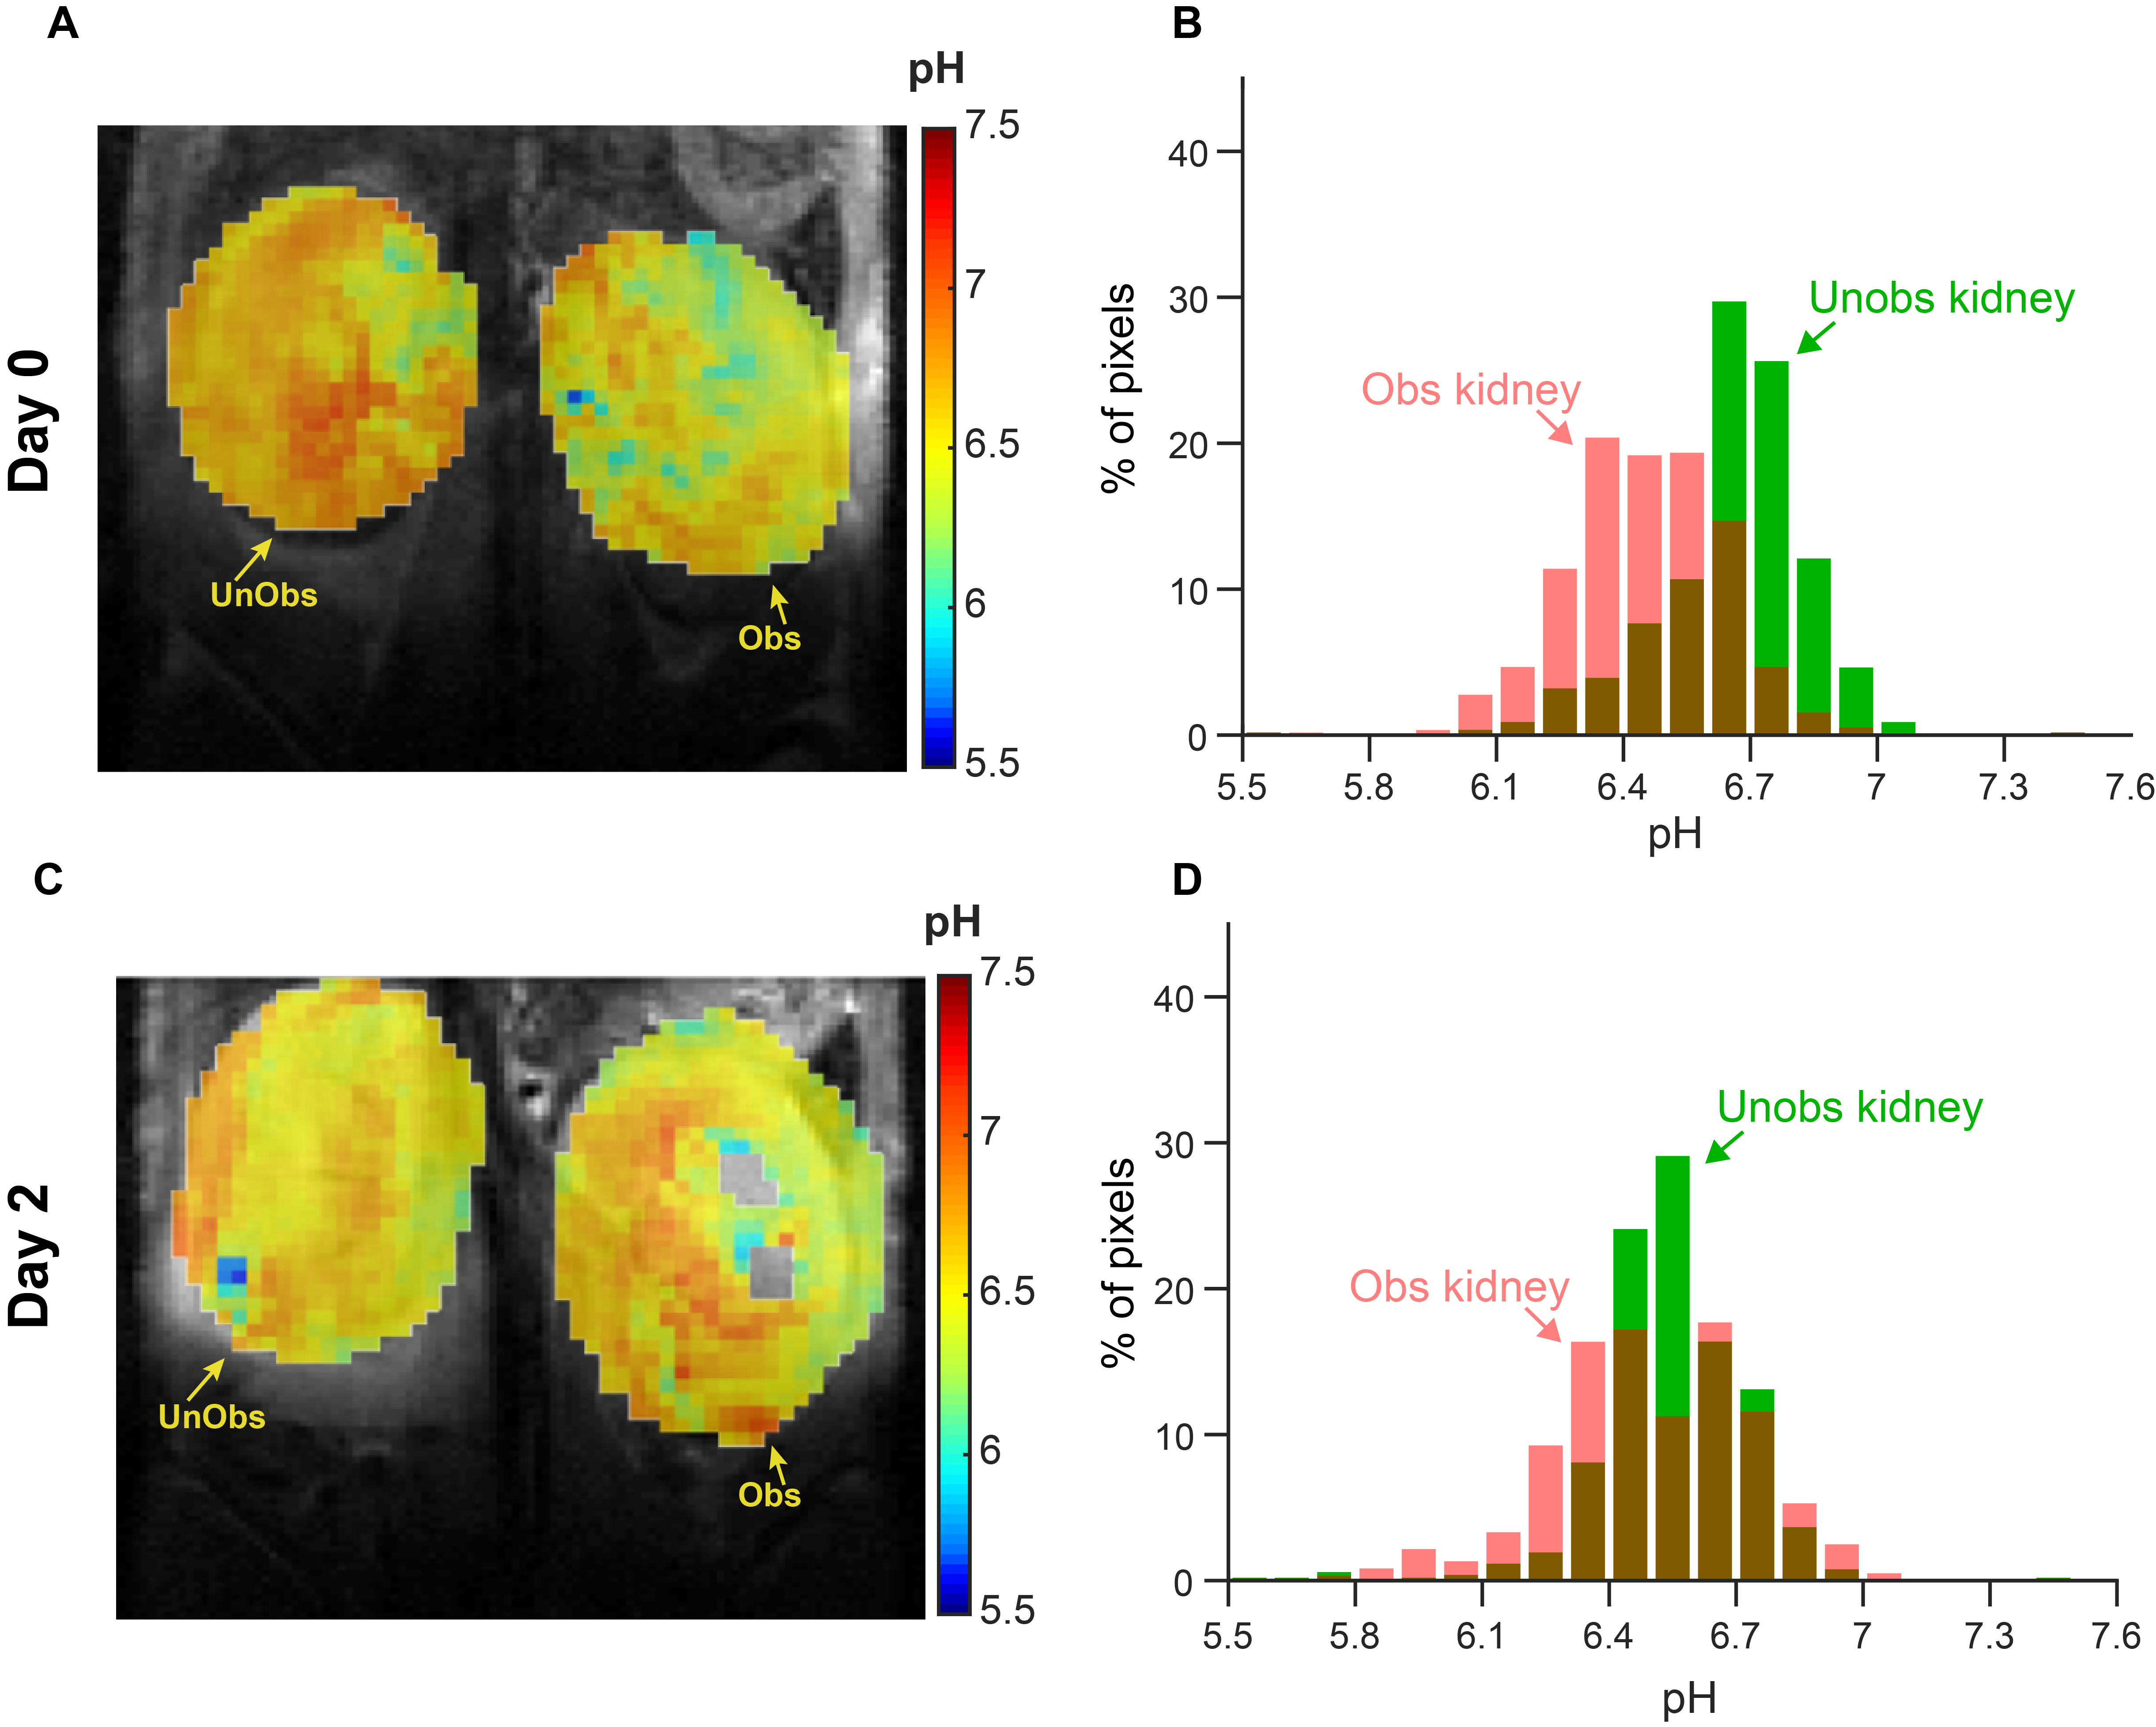
3D CT data sets were extracted to obtain the renal CT pharmacokinetics shown in Fig. 1. On day 0 both kidneys of control mice are in the nephrographic phase at 3 minutes. For UUO mice, on both days 0 and 2 the right kidney is in the nephrographic phase at 3 minutes, and excretion on subsequent delayed phases. On day 0, delayed left nephrogram is observed at 11 minutes, and excretion at 17 minutes. By day 2 there is expected, near complete, loss of left renal function, with minimal enhancement (Fig. 1B). Day 0, day 2 dynamic CEST contrast maps of 4.2 ppm overlaid on high resolution T2W images of UTO mouse are shown in Fig. 2. The obstructed kidney has very low contrast agent uptake on day 0 compared to the unobstructed kidney. On day 2 the calyx of the obstructed kidney has very high contrast agent accumulation as expected due to deteriorated kidney function. pH maps and histograms calculated on day 0 and day 2 at 3 min after iopamidol administration. On day 0, the unobstructed kidney has mean pH value of 6.65, while the obstructed kidney was little acidic with mean pH of 6.44. The pH distribution (ΔpH) of the unobstructed kidney on day 0 was 0.3 and for the obstructed kidney slightly higher pH distribution of 0.45 was observed. ΔpH was increased to 0.4 and 0.6 for unobstructed and obstructed kidneys respectively. These results indicate that iopamidol CEST MRI contrast and ΔpH can be used for diagnosing and monitoring the urinary tract obstructed renal function.Conclusion
Iopamidol CEST MR urography protocol was developed for characterizing the urinary tract obstructions. CEST contrast and ΔpH were shown to be promising biomarkers for diagnosing and monitoring urinary tract obstructions.Acknowledgements
Maryland Stem Cell Research Fund # MSCRFI-2829, NIH P41EB024495References
1. Itoh, K. Comparison of methods for determination of glomerular filtration rate: Tc-99m-DTPA renography, predicted creatinine clearance method and plasma sample method. Ann Nucl Med 17, 561-565 (2003).
2. Solomon, R.J., et al. Cardiac Angiography in Renally Impaired Patients (CARE) study: a randomized double-blind trial of contrast-induced nephropathy in patients with chronic kidney disease. Circulation 115, 3189-3196 (2007).
3. Beckett, K.R., Moriarity, A.K. & Langer, J.M. Safe Use of Contrast Media: What the Radiologist Needs to Know. Radiographics 35, 1738-1750 (2015).
4. Longo, D.L., Busato, A., Lanzardo, S., Antico, F. & Aime, S. Imaging the pH evolution of an acute kidney injury model by means of iopamidol, a MRI-CEST pH-responsive contrast agent. Magn Reson Med 70, 859-864 (2013).
5. Longo, D.L., Cutrin, J.C., Michelotti, F., Irrera, P. & Aime, S. Noninvasive evaluation of renal pH homeostasis after ischemia reperfusion injury by CEST-MRI. NMR Biomed 30(2017).
6. Pavuluri, K., et al. Noninvasive monitoring of chronic kidney disease using pH and perfusion imaging. Sci Adv 5, eaaw8357 (2019).
Figures