0948
Evaluation of hypoxia with T2’ mapping in renal ischemia reperfusion injury1Radiology, Third Affiliated Hospital of Soochow University, Changzhou, China, 2MR Research China, GE Healthcare, Shanghai, China
Synopsis
The purpose was to explore if T2’mapping can assess renal oxygen in the ischemia-reperfusion injury (IRI). IRI models were established according to different ischemia time, followed by injection of furosemide 24 hours after IRI and consecutive MRI scans. Quantitative scores of oxygen were acquired with the hypoxic probe. We found that R2’ values of the inner and outer medulla were statistically significant. R2’ value of the outer medulla was highly correlated with oxygen scores. T2’mapping could serve as a quantitative biomarker to assess the renal oxygen and monitor the treatment in patients with IRI.
Purpose
Hypoxia plays an important role in renal ischemia-reperfusion injury (IRI), but lack of sensitive and non-invasive detection methods, especially in the early stage[1-3]. So far, a number of studies have reported that T2’mapping could be used in acute ischemic stroke[4, 5]. However, it remains unknown whether T2’ mapping could serve as a noninvasive biomarker to assess the renal oxygen. Therefore, the main goal of this study was to explore if T2’mapping can assess the changes of oxygenation in rabbits with IRI using an oxygen-dependent pharmacological maneuver and to compare R2’(1/T2’) parameters with quantitative pathological scores of oxygen.Materials and Methods
Animal modelIn the animal care committee–approved study, forty rabbits were divided into four groups according to the time of renal pedicle clipping randomly: 45min for the mild IRI group (n=10), 60 min for the moderate (n=10) and 75min for the severe group(n=10) and another ten rabbits were set as the sham group (without IRI operation). Intravenous furosemide (FU) was administered 24 hours after IRI.
MRI experiment
All rabbits were performed five times (IRIpre, IRI24h, FU5min, FU10min and FU15min) with a 3.0-Telsa MR (750w, GE Healthcare, USA). Multi-echo FGRE sequence was used to acquire T2* maps. The corresponding scan parameters were of field-of-view = 14cm ×14cm, matrix size = 1.1 mm ×1.1 mm×4 mm, repetition time (TR)= 700ms, echo of time (TE): 3.6ms/ 7.5ms/ 11.3ms/ 15.2ms/ 19.1ms/ 22.9ms/ 26.8ms, flip angle = 45° ,The scan time was 1 minute 44 seconds. Multi-echo FSE sequence was used to acquire T2 maps. The field-of-view and matrix size were the same as above, TR = 971ms, TE = 6.1ms/13.4ms/20.7ms/28.0ms /35.3ms/42.6ms/49.9ms, the scan time was 4 minutes 11 seconds.
Data analysis
All data were analyzed with a vendor-provided T2 & T2* fitting software on ADW 4.7 workstation (GE Healthcare). With mono-exponential model, the corresponding T2 and T2* maps were obtained. The R2’ was then calculated by R2*- R2. Dynamic Renal R2’values were measured in the cortex and inner or outer medulla at five time points. The quantitative scores of oxygen were assessed on the HIF-1α immunohistochemical staining and pyramonidazole immunofluorescence staining[6].
All statistical analyses were performed in SPSS software. The embedded One-way ANOVA was used to test the difference of R2’ values at different time in the three stripes. In addition, Spearman correlation analysis was employed to assess the relationship between quantitative scores of oxygen and R2’ values. Significance threshold was set as p<0.05.
Results
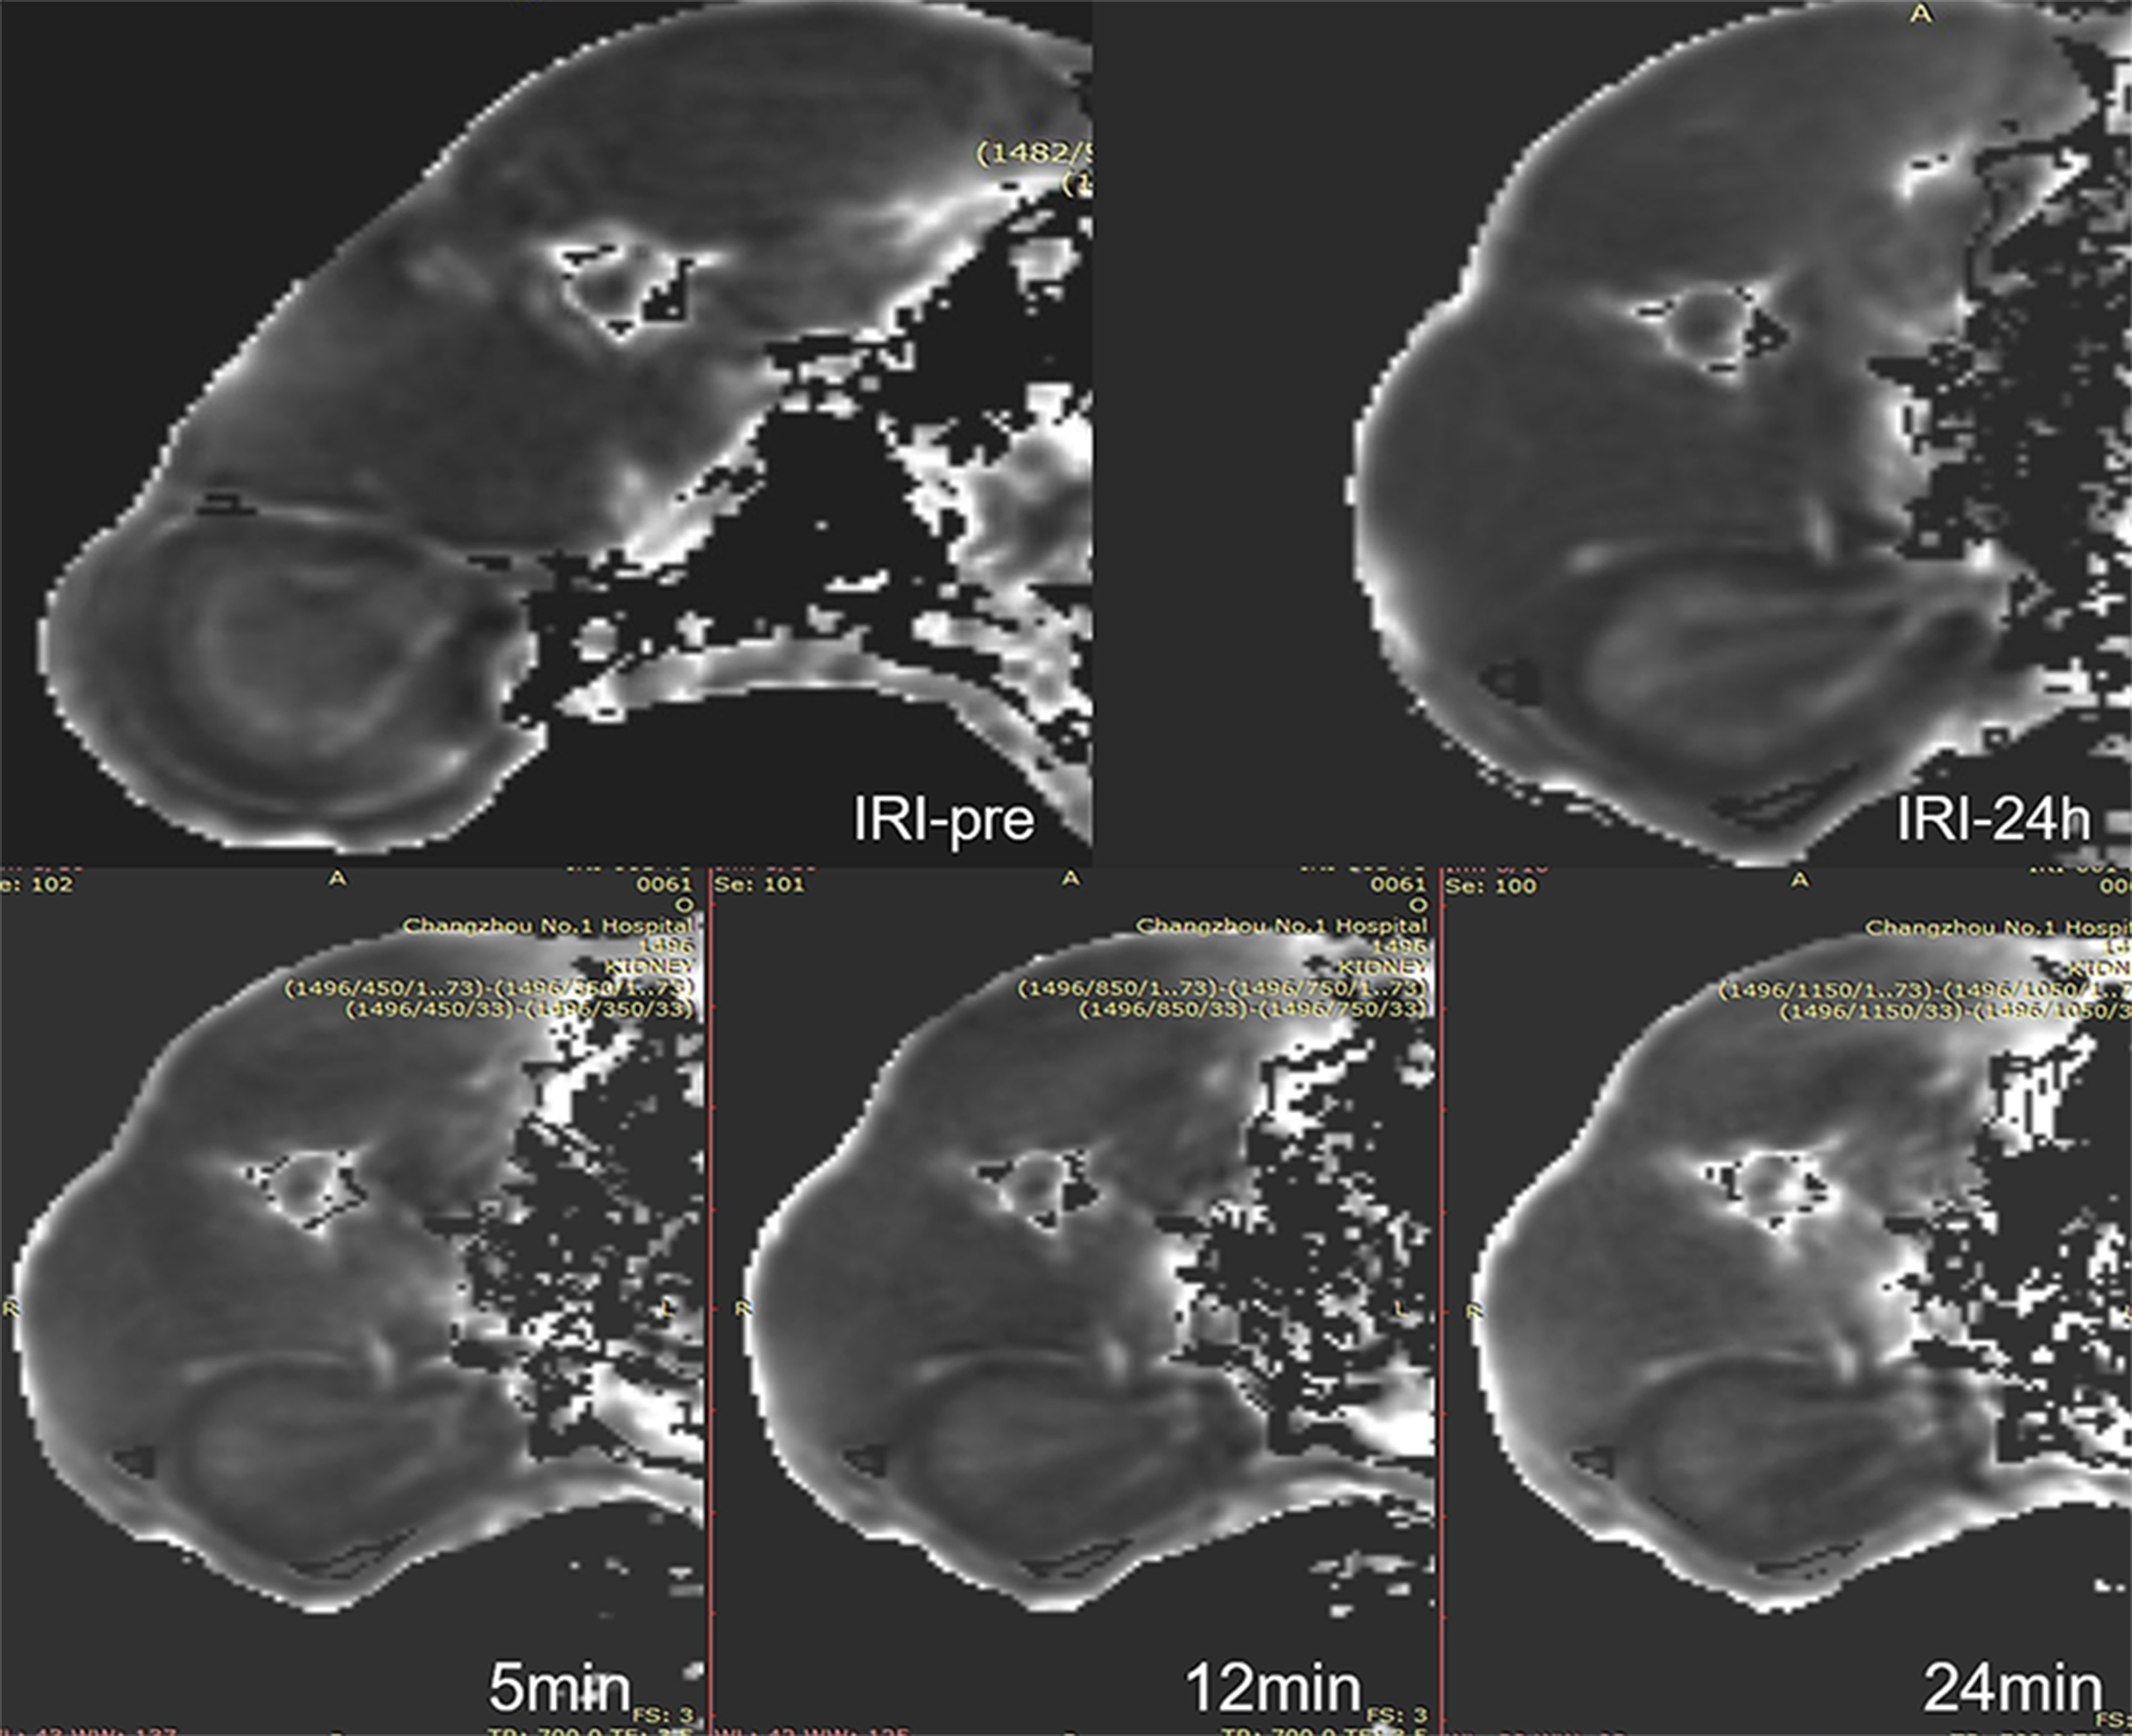
Compared to the sham group, R2’ values increased significantly at 24 hours after IRI in the outer medulla [sham group (19.31 ± 1.21)/s; mild group (20.05 ± 1.26)/s, P < 0.001; moderate group (25.38 ± 1.38)/s, P < 0.001; severe group (25.79 ± 1.10)/s, P < 0.001) and in the inner medulla (sham group (8.20±1.36)/s; mild group (11.70±1.50)/s, P < 0.001; moderate group (13.21±0.79)/s, P < 0.01; severe group (14.73±1.73)/s,P < 0.001, respectively]. However, comparable T2’ values were found in the cortex among these four groups. Furosemide led to a significant decrease of R2’ values in the inner medulla in the sham group, mild and moderate group [R2’ decrease: (5.45±2.14)/s, (4.60±0.93)/s, (2.63± 0.65)/s,respectively, P < 0.001 each ], and R2’ decrease in the outer medulla was as follows [(11.17±4.33)/s, (7.80±0.74)/s, (3.83± 0.79)/s, respectively, P < 0.001 each) (Fig 1),whereas no significant R2’ decrease was found in the severe group (P> 0.05). In addition, quantitative scores of oxygen revealed significant difference among these four groups on the HIF-1α staining or pyramonidazole staining in the outer medulla (P < 0.001 each) (Fig 2). R2’ values at the time points FU15min and R2’ difference (before and after injecting furosemide) were respectively significantly correlated with renal oxygen scores of the pyramonidazole staining (r = 0.71, -0.90, respectively, P < 0.001) or HIF-1α staining (r =0.81, -0.84, respectively, P < 0.001).In this study, we mainly investigated the T2’ mapping in evaluating the renal oxygen with a pharmacological maneuver. R2’ parameters had been found closed correlated with quantitative scores of oxygen, indicating that T2’ mapping could assess the change of renal oxygen. The technique can be used for early diagnosis and monitoring of renal IRI in human.
Conclusion
T2’ mapping can evaluate the renal oxygenation in the early phase of IRI,especially in the outer mudulla, and may serve as a noninvasive and quantitative biomarker for IRI.Acknowledgements
No acknowledgement found.References
[1] Chen F, Li S, Sun D. Methods of Blood Oxygen Level-Dependent Magnetic Resonance Imaging Analysis for Evaluating Renal Oxygenation[J]. Kidney Blood Press Res,2018,43(2):378-388.
[2] Bauer F, Wald J, Bauer F J, et al. Detection of Acute Tubular Necrosis Using Blood Oxygenation Level-Dependent (BOLD) MRI[J]. Kidney Blood Press Res,2017,42(6):1078-1089.
[3] Oostendorp M, de Vries E E, Slenter J M, et al. MRI of renal oxygenation and function after normothermic ischemia-reperfusion injury[J]. NMR Biomed,2011,24(2):194-200.
[4] Bauer S, Wagner M, Seiler A, et al. Quantitative T2'-mapping in acute ischemic stroke[J]. Stroke,2014,45(11):3280-3286.
[5] Seiler A, Deichmann R, Noth U, et al. Oxygenation-Sensitive Magnetic Resonance Imaging in Acute Ischemic Stroke Using T2'/R2' Mapping: Influence of Relative Cerebral Blood Volume[J]. Stroke,2017,48(6):1671-1674.
[6] Manotham K, Tanaka T, Matsumoto M, et al. Evidence of tubular hypoxia in the early phase in the remnant kidney model[J]. J Am Soc Nephrol,2004,15(5):1277-1288.
Figures
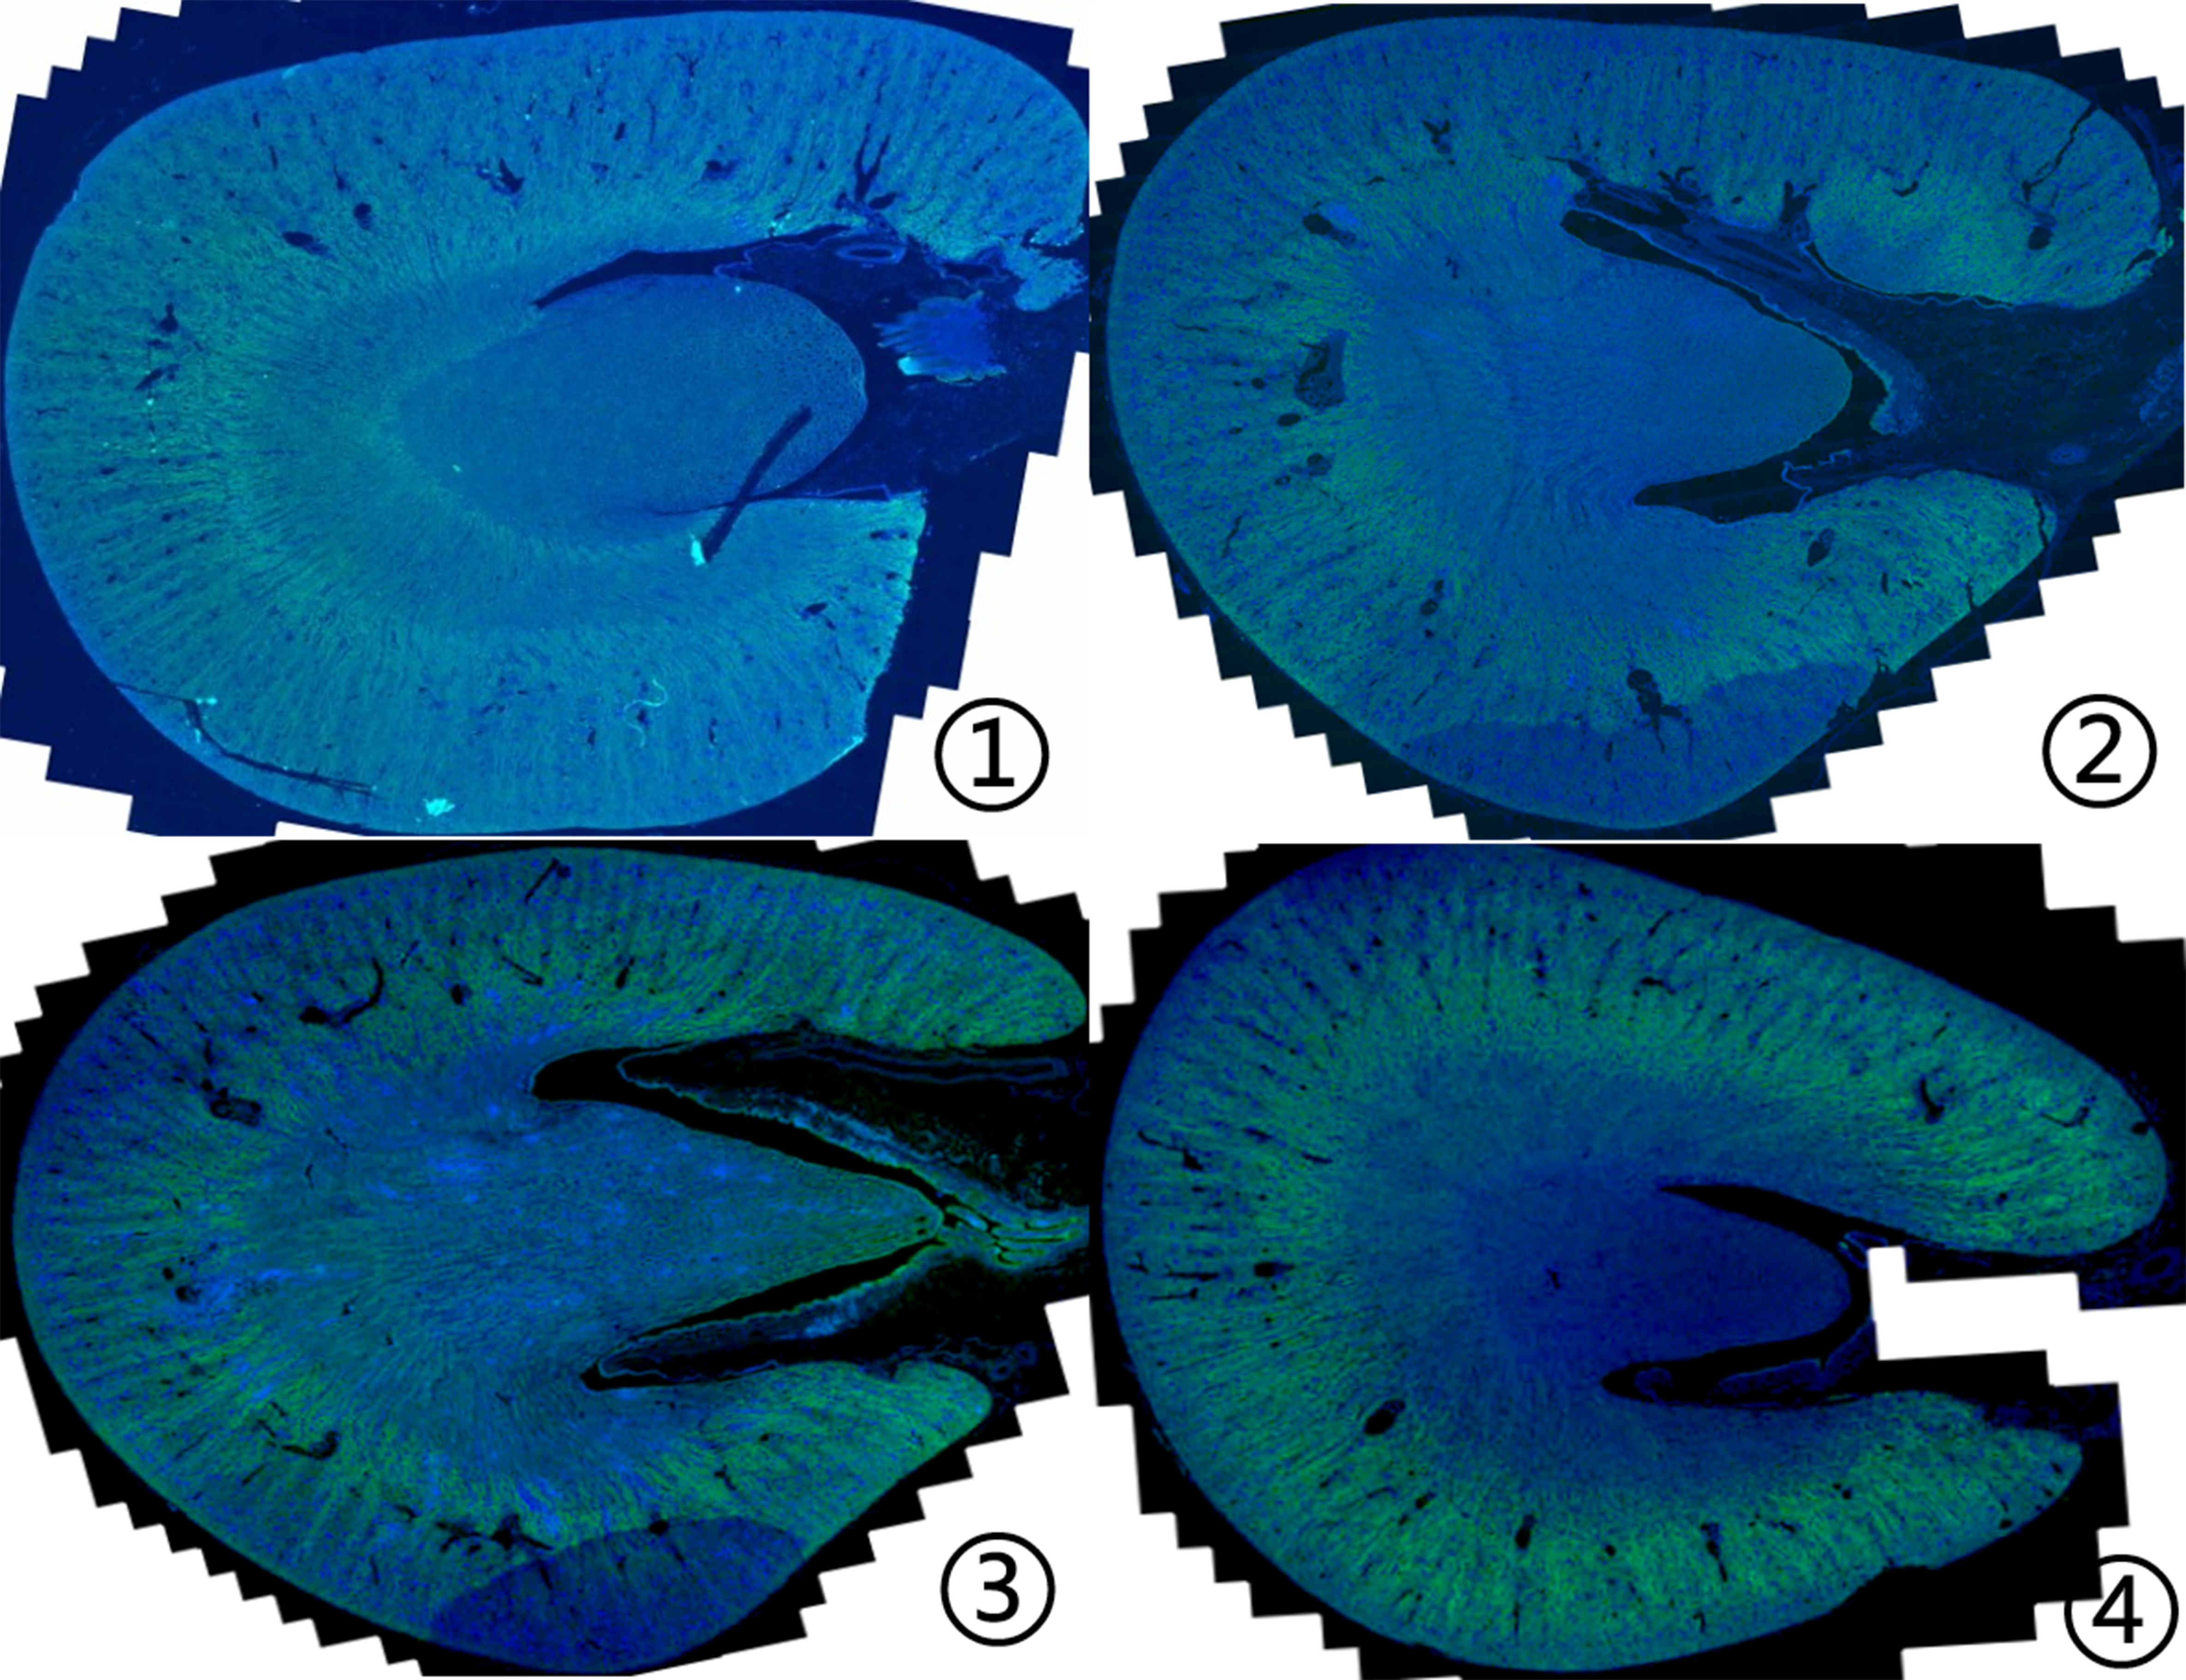
Representative pyramonidazole immunofluorescence photographs of kidneys from rabbits in sham group or IRI groups .
①-④ represents the pyramonidazole immunofluorescence staining with a hypoxia probe in the control group(①), mild group (②), moderate group (③) and severe group (④). In the outer medulla, the fluorescent intensity gradually increased from the sham group to severe group