0947
Diffusional Kurtosis Imaging of kidney in STZ-induced Diabetic Rats.1Medical Imaging Center, First Affiliated Hospital, Jinan University, Guangzhou, Guangdong, China, Guangzhou, China, 2Medical Imaging Center, The Eighth Hospital of Sun Yat-sen University,shenzhen,China., Shenzhen, China, 3MR Research, GE Healthcare., Beijing, China
Synopsis
Diffusional kurtosis imaging (DKI) is an advanced diffusion model and could identify the heterogeneity of cellularity and microstructural complexity. To test whether the DKI could detect the functional changes of kidney in early Diabetic kidney disease (DKD), the STZ-induced diabetic rats were applied in current study. Further, the biochemical and pathological evidences would also be provided to compare with the DKI biomarker.
Synopsis
Diffusional kurtosis imaging (DKI) is an advanced diffusion model and could identify the heterogeneity of cellularity and microstructural complexity1,2. To test whether the DKI could detect the functional changes of kidney in early Diabetic kidney disease (DKD), the STZ-induced diabetic rats were applied in current study. Further, the biochemical and pathological evidences would also be provided to compare with the DKI biomarker.Introduction
Diabetic kidney disease (DKD) is an early and concealed disease than expected, and it is urgent to discover a non-invasive method for its early diagnosis and assessment3. Traditional diffusion imaging suggests that water molecules diffuse in accordance with a gaussian distribution, but the kidneys deviate from the Gaussian distribution due to their structural specificity. DKI is sensitive to tissue microstructure and may be useful in the diagnosis and monitoring of diabetic kidney disease4. The current study aims to measure longitudinal changes of DKI in model rats with diabetic kidney injury.Methods
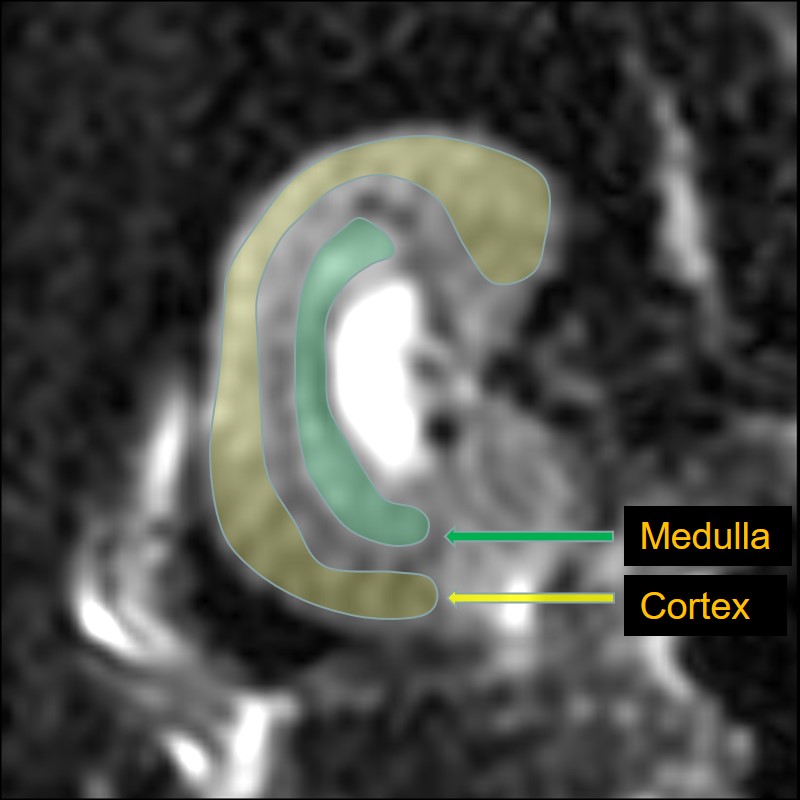
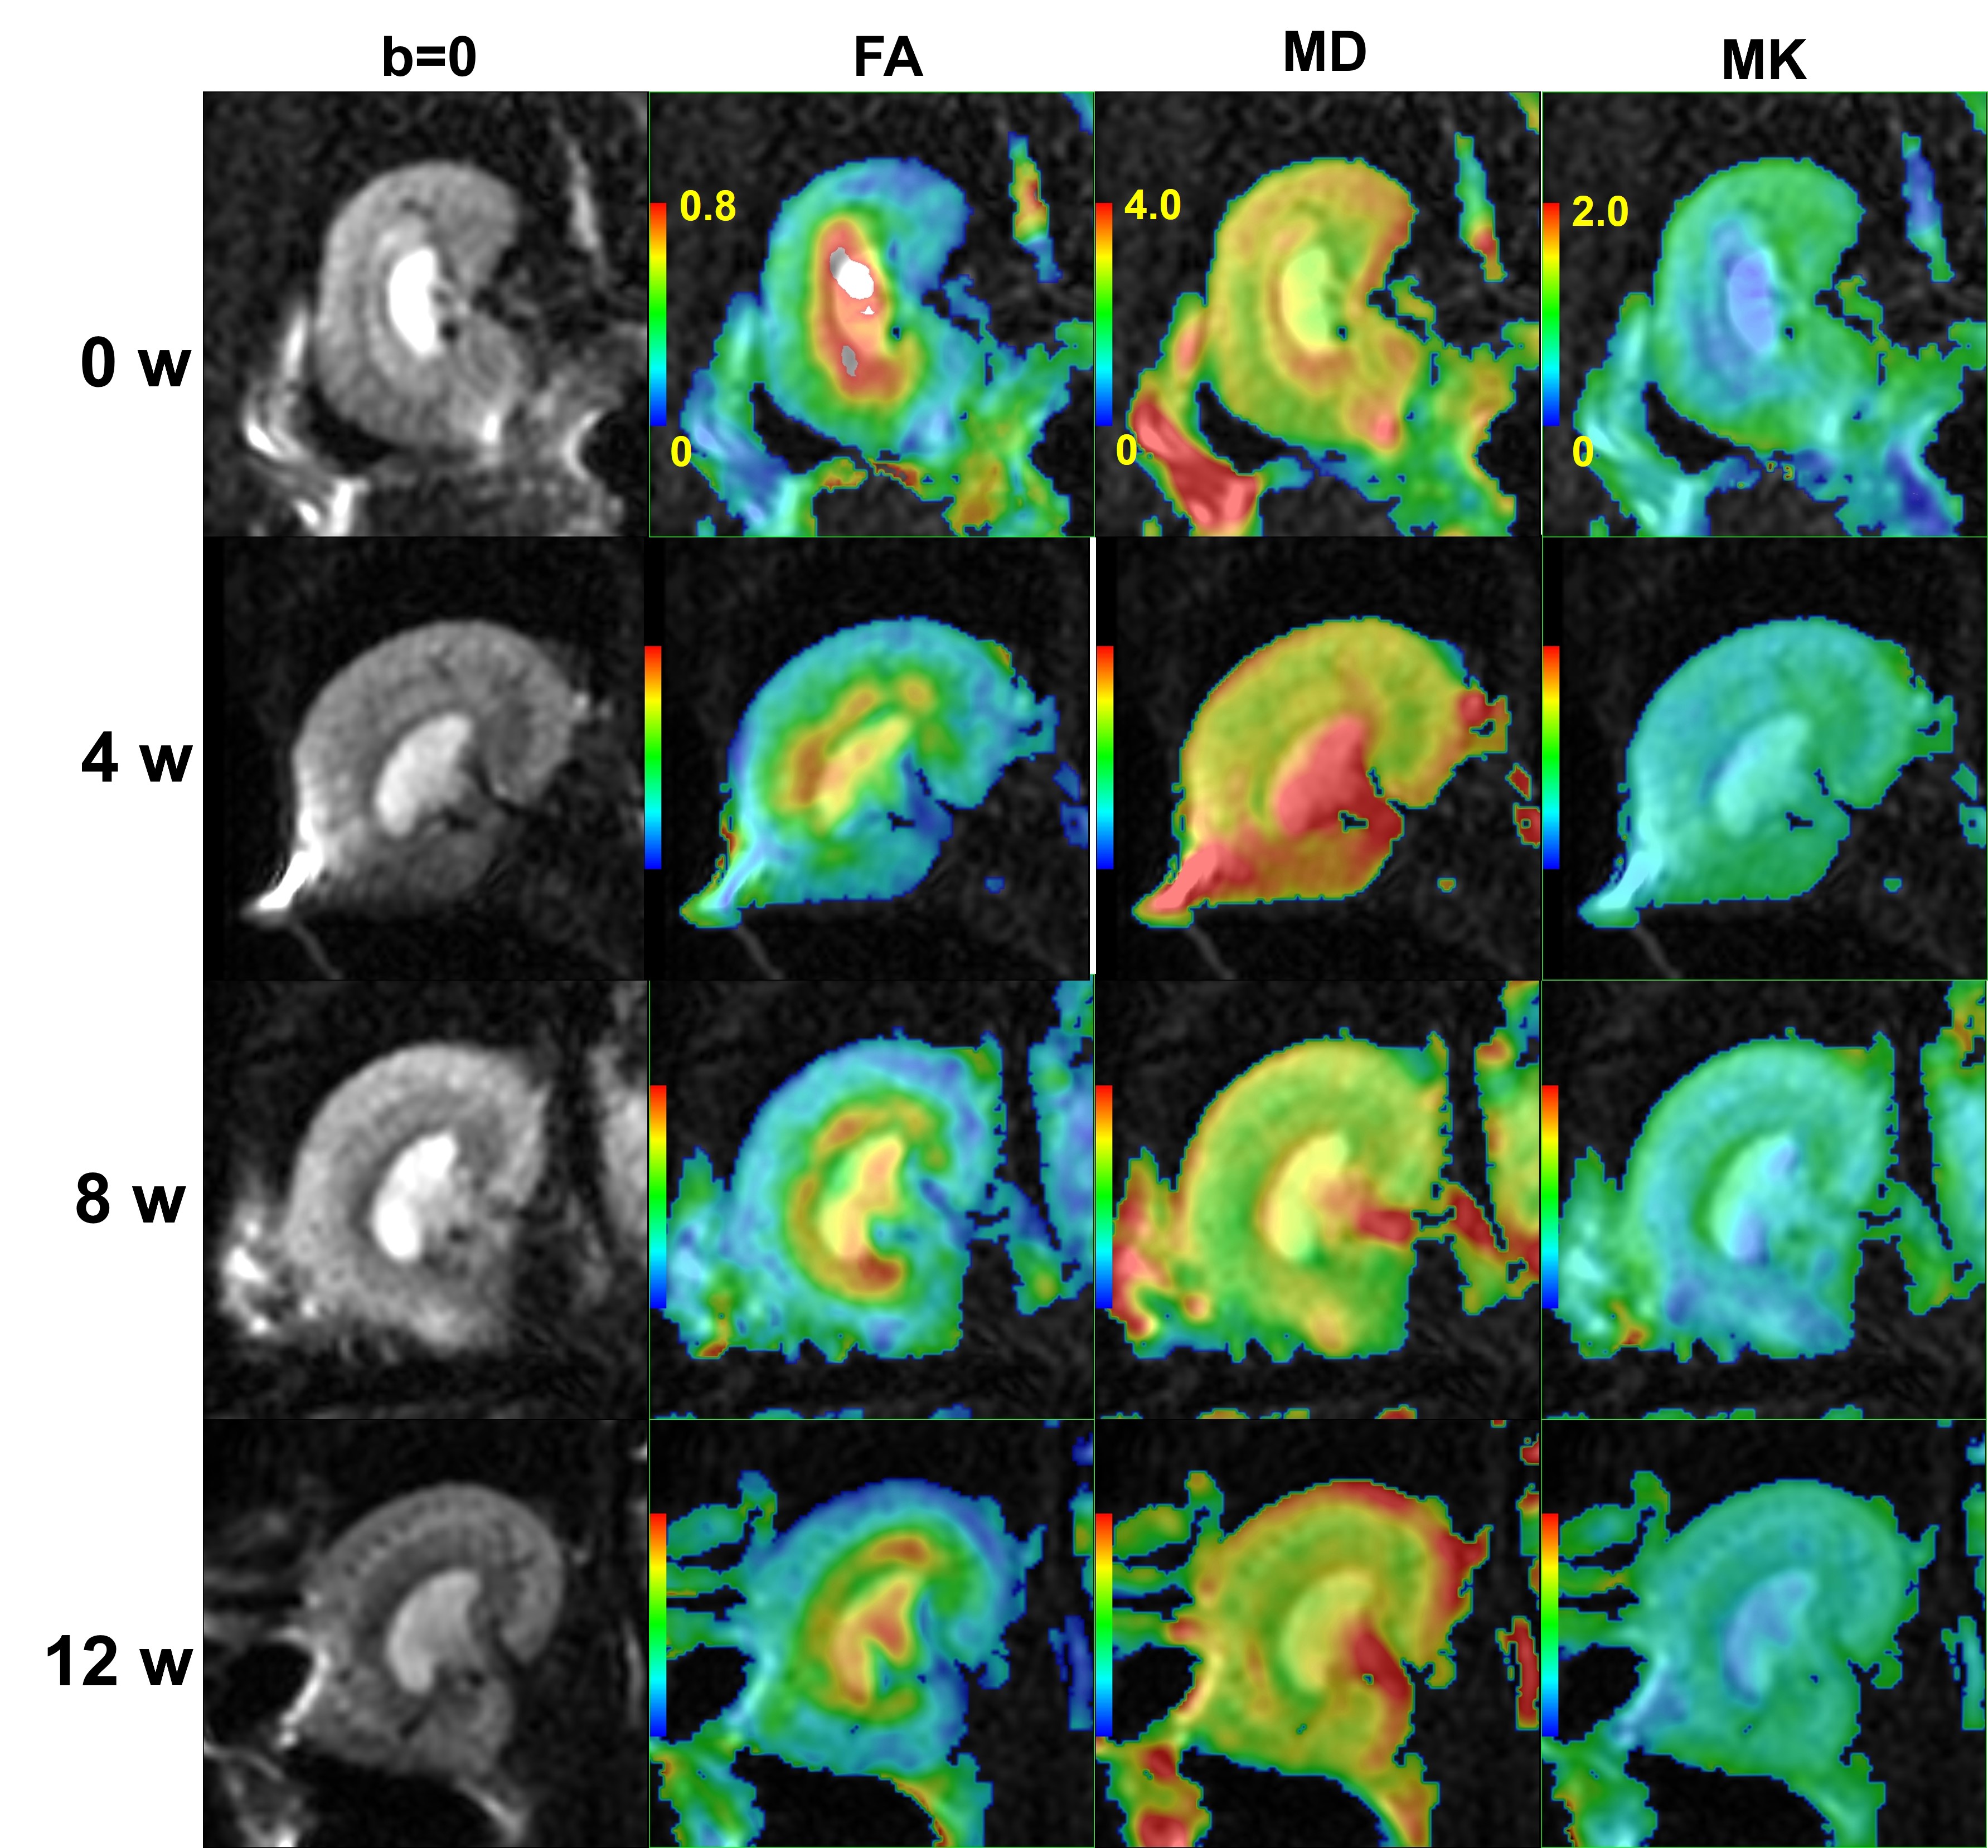
48 SD rats were randomly divided into 2 groups: the normal control (NC) and diabetic mellitus groups (DM). Rats in the DM group were given streptozocin (STZ) at a dose of 55mg/kg by intraperitoneal injection to establish the animal model of diabetes, whereas rats in the NC group were given an equal volume of a citric acid buffer by intraperitoneal injection. Rats were scanned on weeks 0, 4, 8, and 12 after successful diabetes model establishment, and 6 rats in each group were randomly selected for MR scan at each time point. The 24-hour urine of each rat in the two groups was collected and its body weight was recorded at 0, 4, 8, and 12 weeks after the successful modeling before MR scan. The DKI derived parameters of the renal parenchyma (Fig.1) including fractional anisotropy (FAco, FAme), mean diffusivity (MDco, MDme), and mean kurtosis (MKco, MKme) were measured (Fig.2). Blood was used to measure BUN and Scr after the MR scan. In addition, the weight of the kidneys was recorded and the weight/body weight ratio of kidney was calculated. Thereafter, the HE staining and fibronectin immunohistochemistry were performed. Changes of each parameter along with time were analyzed and correlated with urine volume (UV), blood urea nitrogen (BUN), and serum creatinine (Scr).Results and Discussion
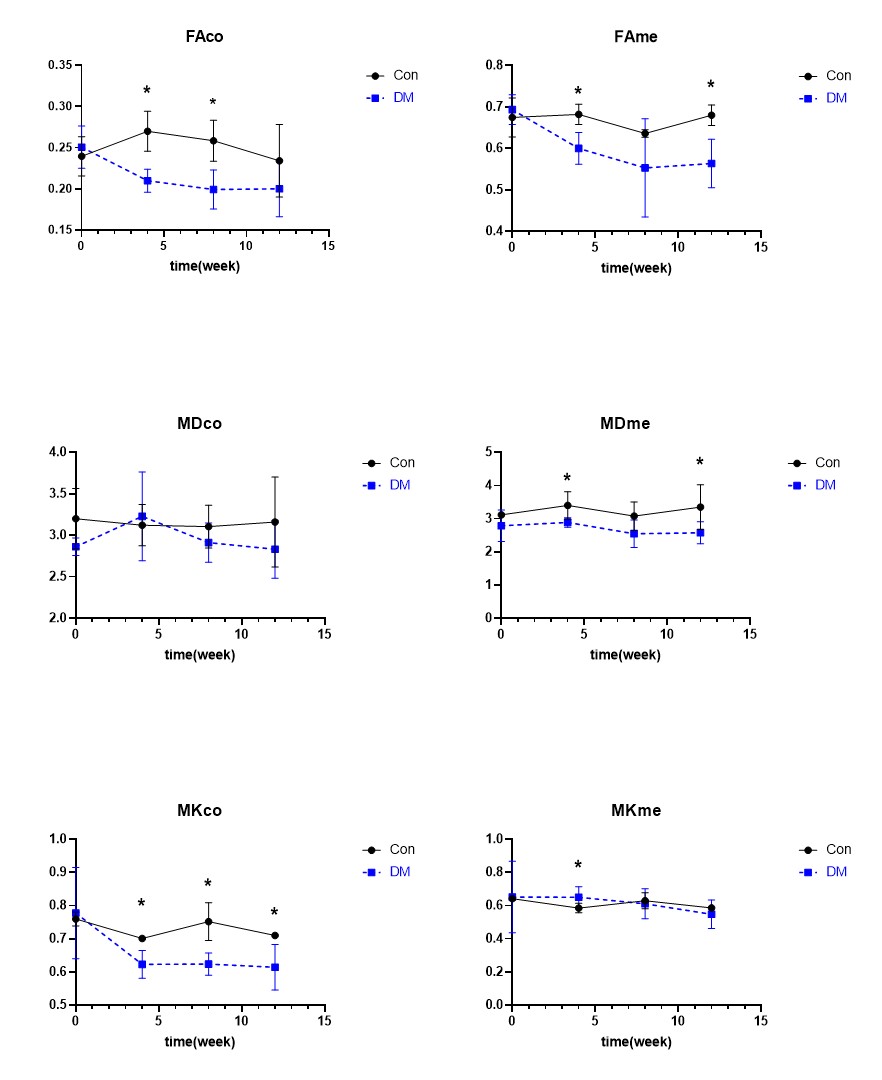
The FAco, FAme, MKme, and MDme values were significantly lower in the rats after injection of STZ, while there was no statistical difference at each time points (Fig.3). Decreased FAco values were associated with high filtration and edema of glomeruli in the early stages of diabetes. Our results showed a slightly negative correlation between the BUN and FAco value (rBUN = -0.43, P = 0.03), FAme value (rBUN = -0.49, P = 0.01). Further, the renal FAme value was also slightly correlated with UV (rUV = 0.45, P = 0.03). The kidneys in the DM group showed swelling of the renal tubular epithelial cells, tubular lumen dilation, and gradually increased proliferation of myofibroblasts in the interstitial space. The decrease of MDme in DM group may relate to early edema and late fibrosis in diabetic tubulointerstitial cells. No significant changes were found in the changes in the MDco value in the DM group. Decreased MKco in DM group may associate with the morphology (swelling), quantity (inflammatory cell deposition) and dysfunction (permeability change) of renal tissue cells, which resulted in glomerular hyperperfusion and high filtration. The effects of hyperfiltration and hyperperfusion of the kidney on MK are still unclear. At present, there were few studies focusing on renal DKI, and some of the results were contradictory with each other1, 5-7. We observed that the MKco value decreased and remained at a low level from the 4th week of STZ injection. The MKco values of the DM group were moderately correlated with BUN and UV (rBUN = -0.53, P = 0.01, rUV = 0.59, P = 0.02). Those may suggest that the MK value of the diabetic renal cortex was not only affected by changes in the glomerular and tubular structures, but may also associate with changes in the vasculature and hemodynamics. In addition, our results demonstrated that the tubulointerstitial damage and fibrosis gradually worsened after the fourth week after STZ injection, but the MKme value did not increase. Those probably due to the destroyed tubulointerstitial tissue structure at 4w, which caused it to deviate from non- Gaussian distribution, and tended to Gaussian distribution. Therefore, many scholars can use IVIM to assess early renal function changes in diabetic kidney disease8-10. All parameters are not related to Scr.Conclusion
This pilot study suggested that changes in medullary DKI assessments may be provided as indicators of early DN. Further studies are needed to determine whether those findings could serve as biomarkers to identify diabetics at risk of DN progression.Acknowledgements
noReferences
1. Liu, Y. et al. Diffusional kurtosis imaging in assessing renal function and pathology of IgA nephropathy: a preliminary clinical study. Clinical radiology 73, 818-826, doi:10.1016/j.crad.2018.05.012 (2018).
2. Rosenkrantz, A. B. et al. Prostate cancer: feasibility and preliminary experience of a diffusional kurtosis model for detection and assessment of aggressiveness of peripheral zone cancer. Radiology 264, 126-135, doi:10.1148/radiol.12112290 (2012).
3. Wild, S., Roglic, G., Green, A., Sicree, R. & King, H. Global prevalence of diabetes: estimates for the year 2000 and projections for 2030. Diabetes care 27, 1047-1053, doi:10.2337/diacare.27.5.1047 (2004).
4. Jensen, J. H., Helpern, J. A., Ramani, A., Lu, H. & Kaczynski, K. Diffusional kurtosis imaging: the quantification of non-gaussian water diffusion by means of magnetic resonance imaging. Magnetic resonance in medicine 53, 1432-1440, doi:10.1002/mrm.20508 (2005).
5. Pentang, G. et al. Diffusion kurtosis imaging of the human kidney: a feasibility study. Magnetic resonance imaging 32, 413-420, doi:10.1016/j.mri.2014.01.006 (2014).
6. Huang, Y. et al. MRI quantification of non-Gaussian water diffusion in normal human kidney: a diffusional kurtosis imaging study. NMR in biomedicine 28, 154-161, doi:10.1002/nbm.3235 (2015).
7. Cheng, Z. Y. et al. Diffusional kurtosis imaging of kidneys in patients with hyperuricemia: initial study. Acta radiologica (Stockholm, Sweden : 1987), 284185119878362, doi:10.1177/0284185119878362 (2019).
8. Yan, Y. Y. et al. Intravoxel incoherent motion and diffusion tensor imaging of early renal fibrosis induced in a murine model of streptozotocin induced diabetes. Magnetic resonance imaging 38, 71-76, doi:10.1016/j.mri.2016.12.023 (2017).
9. Feng, Y. Z. et al. Intravoxel incoherent motion (IVIM) at 3.0 T: evaluation of early renal function changes in type 2 diabetic patients. Abdominal radiology (New York), doi:10.1007/s00261-018-1555-7 (2018).
10. Chen, S. N., Wang, Y. C., Feng, Y. L., Gao, Y. T. & Ju, S. S. [Assessment of renal function with intravoxel incoherent motion and diffusion tensor imaging in type 2 diabetic patients]. Zhonghua yi xue za zhi 98, 346-351, doi:10.3760/cma.j.issn.0376-2491.2018.05.006 (2018).
Figures