0946
Novel magnetic resonance kidney biomarker Parenchyma-T2 for assessment of Autosomal dominant polycystic kidney disease
Florian Siedek1, Franziska Grundmann2, Kilian Weiss1, Daniel Pinto dos Santos1, Sita Arjune2, Stefan Haneder1, Thorsten Persigehl1, Roman-Ulrich Mueller2, and Bettina Baessler1
1Radiology, University of Cologne, Cologne, Germany, 2Department II of Internal Medicine, University of Cologne, Cologne, Germany
1Radiology, University of Cologne, Cologne, Germany, 2Department II of Internal Medicine, University of Cologne, Cologne, Germany
Synopsis
Novel biomarkers for a more sensitive and quick assessment of ADPKD patients especially in those cases where kidney function is still preserved and can be maintained is urgently needed. We analyzed in 139 patients and 10 healthy controls if magnetic resonance T2 mapping of the kidneys allows a sufficient differentiation of cyst fraction as a surrogate marker for disease severity. The new biomarker parenchyma-T2 showed the strongest correlation to renal cyst fraction and was faster to determine than the established biomarker htTKV. Consequently, parenchyma-T2 has the potential to serve as a novel predictive biomarker especially in early stages of disease.
Introduction
The Autosomal dominant polycystic kidney disease (ADPKD) results in end-stage renal disease in approximately 75% of patients 1-3 and accounts for about 5-10% of the dialysis population in Western societies. Risk of progression to end-stage disease may be highly variable and since compensatory hyperfiltration occurs in intact glomeruli, ADPKD patients may present with preserved glomerular filtration rate (GFR) in earlier stages of the disease 4. Thus, detecting at-risk patients in earlier stages of the disease is crucial to identify those who may benefit from early therapeutic intervention including targeted therapies 5. As all currently available biomarkers - including height-adjusted total kidney volume (htTKV) - have important drawbacks in the everyday clinical setting, the identification of novel, sensitive and quickly assessable biomarkers is inevitable to optimize patient care in ADPKD. Franke et al. 6 demonstrated that T2 values which are strongly dependent on the amount of water present in tissue showed a significant increase for the whole kidney with increasing cystic burden. Following this study, we want to evaluate whether magnetic resonance T2 mapping of the kidneys can deliver easily obtainable and accurate biomarkers for improved patient counselling and selection of targeted treatment options.Methods
All patients in this retrospective study were part of the AD(H)PKD registry (NCT02497521) which is a prospective observational study recording radiological data apart from others. In- and exclusion criteria included the diagnosis of ADPKD, typical renal phenotype of ADPKD (Mayo Class 1), absence of a kidney tumor, sufficient MR image quality and no medication with Tolvaptan (Fig. 1). In addition to 139 participants with ADPKD (42.4±12.2 years, 80 women), 10 healthy controls were included (30.7±5.3 years, 4 women) and underwent MRI on a clinical 1.5T system (Ingenia, Philips Healthcare, Best, Netherlands) including acquisition of a Gradient-Spin-Echo (GraSE) T2 mapping sequence covering both kidneys amongst other clinical sequences. HtTKV was calculated based on standard T2-weighted imaging. The kidney cyst fraction was measured in the T2 mapping sequence using the CMRSegTool-plugin 7 (P. Croisille, INSA-Lyon, France) for OsiriX (Pixmeo Sarl, Bernes, Switzerland) which allows a semiautomatic three-dimensional volumetric registration of the kidneys and subsequent cyst extraction from the total kidney volume after manual segmentation (Fig. 2). The rationale for using T2 maps instead of regular T2-weighted images is that T2 mapping might allow for a better discrimination between smaller cysts and non-cystic parenchyma (Fig. 3). The CMRSegTool was also used for calculation of the whole kidney-T2 relaxation time (kidney-T2) including parenchyma and kidney cysts. For evaluation of T2 relaxation times of the residual kidney parenchyma (parenchyma-T2), a single circular region of interest (ROI, ≈1cm2) was manually placed in residual parenchyma in the images of the T2 mapping-sequence on three representative slices of the upper, middle and lower pole in both kidneys using OsiriX (Fig. 2). The results were averaged over all 6 ROIs. Also, time needed to measure each of the three parameters (htTKV, kidney-T2, parenchyma-T2) as well as intra-reader and inter-reader agreement of parenchyma-T2 was measured.Results
Mean acquisition time for calculating htTKV was 6-fold faster (4.78±1.17min), for calculating kidney-T2 10-fold faster (7.59±1.57min) compared to calculating parenchyma-T2 (0.78±0.14min). Parenchyma-T2 revealed a strong correlation to cyst fraction (r=0.77, p<0.001) and allowed for the most distinct separation of patient groups divided according to cyst fraction (Fig. 4). Kidney-T2 (r=0.76, p<0.001) revealed a comparable correlation. In contrast, htTKV revealed only a moderate correlation to cyst fraction (r=0.48, p<0.001) and did not allow for clear group separation (Fig. 4). These observations became even more distinct when considering not the whole collective but only patients with preserved kidney function (Fig. 5): For these patients, parenchyma-T2 showed indeed a higher correlation to cyst fraction (r=0.81, p<0.001) which was slightly better compared to kidney-T2 (r=0.79, p<0.001) with a further improved separation of patient groups according to cyst fraction (Fig. 5). The correlation of htTKV to cyst fraction remained poor (r=0.48, p<0.001). The intra-reader analysis of parenchyma-T2 showed an excellent agreement with an ICC of 0.97 with a 95%CI of 0.92 and 0.99. The inter-reader analysis of parenchyma-T2 also revealed a great agreement with an ICC of 0.91 with a 95%CI of 0.77 and 0.96.Conclusion
The T2-value in the residual parenchyma in ADPKD patients (parenchyma-T2) allows for a clear and better separation of all cyst fraction groups compared to whole-kidney T2-values (kidney-T2) as well as the established imaging biomarker htTKV. Additionally, parenchyma-T2 can be acquired much faster than htTKV 8 and kidney-T2. Interestingly, parenchyma-T2 seems to be best suited for disease assessment in patients with preserved kidney function allowing to easily identify those who may benefit from a unique therapy such as Tolvaptan. In comparison, htTKV only shows moderate results concerning the correlation and separation of patients according to cyst fraction making an early disease assessment less reliable or even impossible. In terms of test validation, we found a high consensus between both readers as well as a high consistency in repeated ratings of a single reader. In conclusion, considering that the cyst fraction is the key parameter of ADPKD assessment 9, especially the rapidly assessable parenchyma-T2 shows a strong association with disease severity and is far superior to the established imaging biomarker htTKV.Acknowledgements
No acknowledgement found.References
- Bergmann C, Guay-Woodford LM, Harris PC, et al. Polycystic kidney disease. Nat Rev Dis Primers. 2018;4:50.
- Willey CJ, Blais JD, Hall AK, et al. Prevalence of autosomal dominant polycystic kidney disease in the European Union. Nephrol Dial Transplant. 2017;32:1356–1363.
- Dalgaard OZ. Bilateral polycystic disease of the kidneys; a follow-up of two hundred and eighty-four patients and their families. Acta Med Scand Suppl. 1957;328:1–255.
- Grantham JJ, Chapman AB, Torres VE. Volume progression in autosomal dominant polycystic kidney disease: the major factor determining clinical outcomes. Clin J Am Soc Nephrol. 2006;1(1):148–157.
- Chebib FT, Perrone RD, Chapman AB, et al. A Practical Guide for Treatment of Rapidly Progressive ADPKD with Tolvaptan. J Am Soc Nephrol. 2018;29:2458–2470.
- Franke M, Baeßler B, Vechtel J, et al. Magnetic resonance T2 mapping and diffusion-weighted imaging for early detection of cystogenesis and response to therapy in a mouse model of polycystic kidney disease. Kidney Int. 2017;92(6):1544–1554.
- Viallon M, Spaltenstein J, de Bourguignon C, et al. CMRSegTools: an Osirix plugin for myocardial infarct sizing on DE-CMR images. J Cardiovasc Magn Reson. 2014;16:P204.
- Chapman AB, Guay-Woodford LM, Grantham JJ, et al. Renal structure in early autosomal-dominant polycystic kidney disease (ADPKD): The Consortium for Radiologic Imaging Studies of Polycystic Kidney Disease (CRISP) cohort. Kidney Int. 2003;64:1035–1045.
- Wong ATY, Mannix C, Grantham JJ, et al. Randomised controlled trial to determine the efficacy and safety of prescribed water intake to prevent kidney failure due to autosomal dominant polycystic kidney diseas (PREVENT-ADPKD). BMJ Open. 2018;8:e018794.
Figures
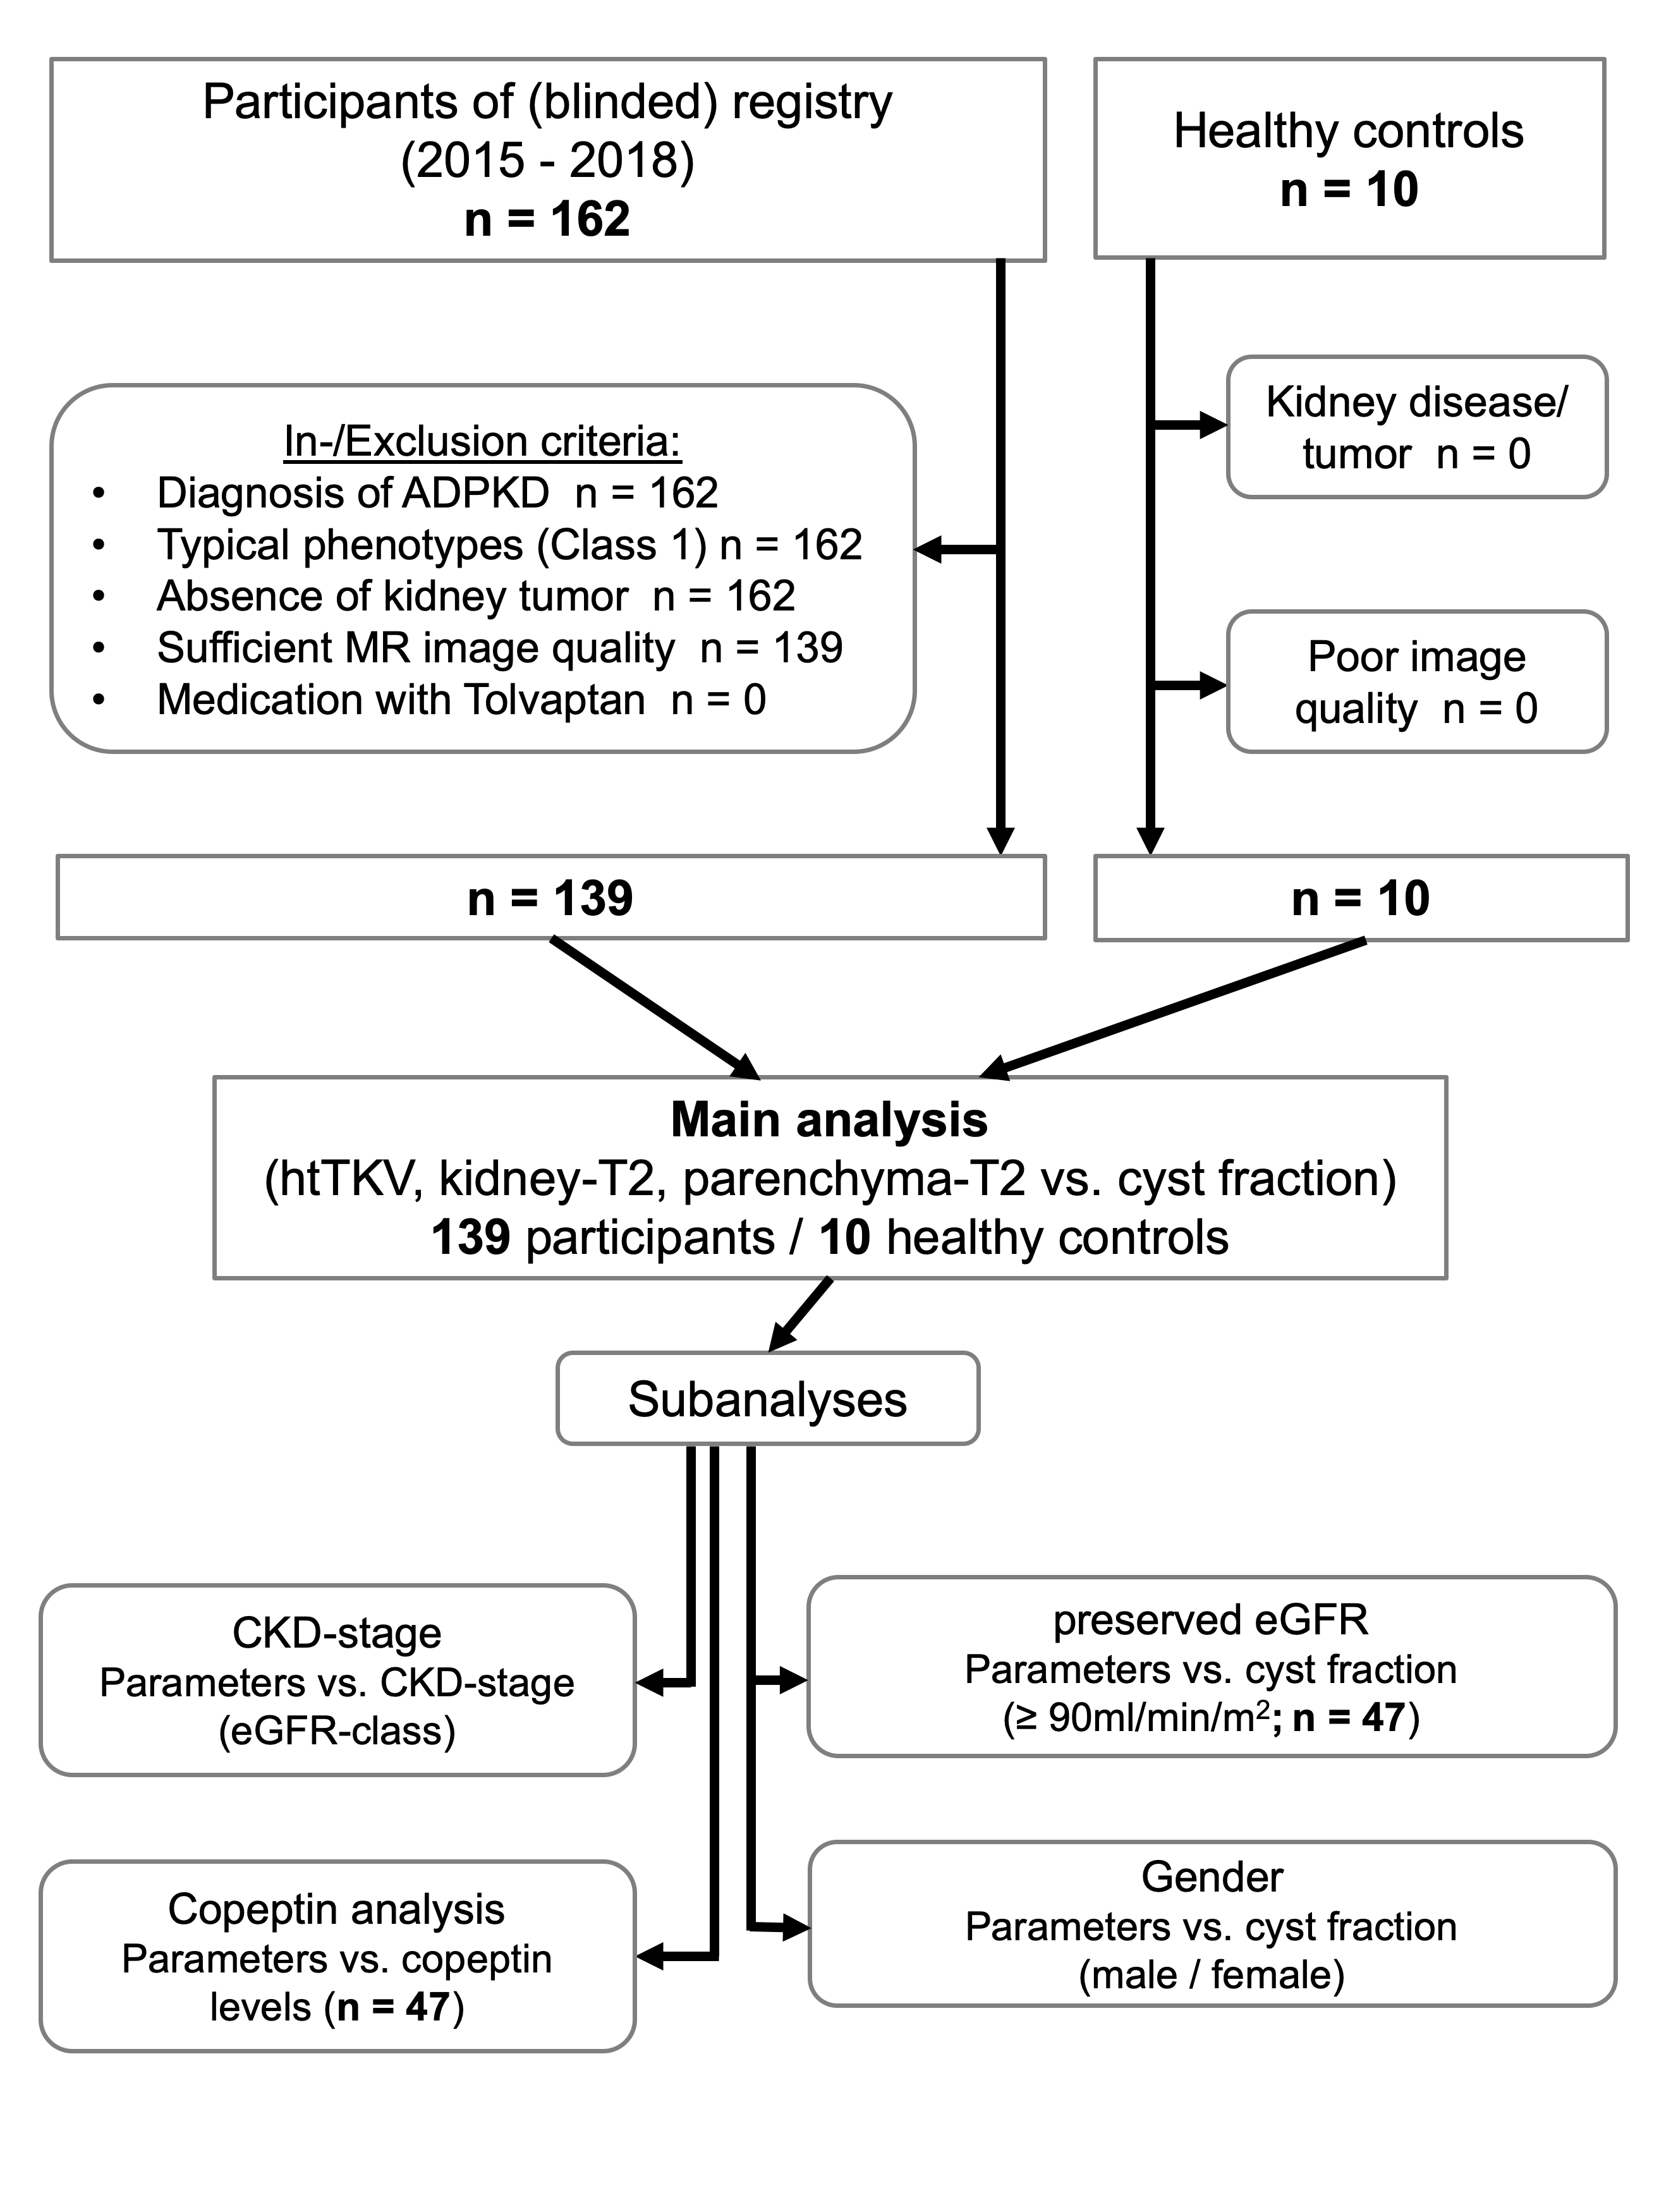
Study flow chart illustrating patient flow, in- and
exclusion criteria as well as subgroup analyses. ADPKD, autosomal dominant
polycystic kidney disease; htTKV, height-adjusted total kidney volume;
kidney-T2, T2 relaxation times of both kidneys; parenchyma-T2, T2 relaxation
times averaged across 3 regions of interest per kidney, respectively.
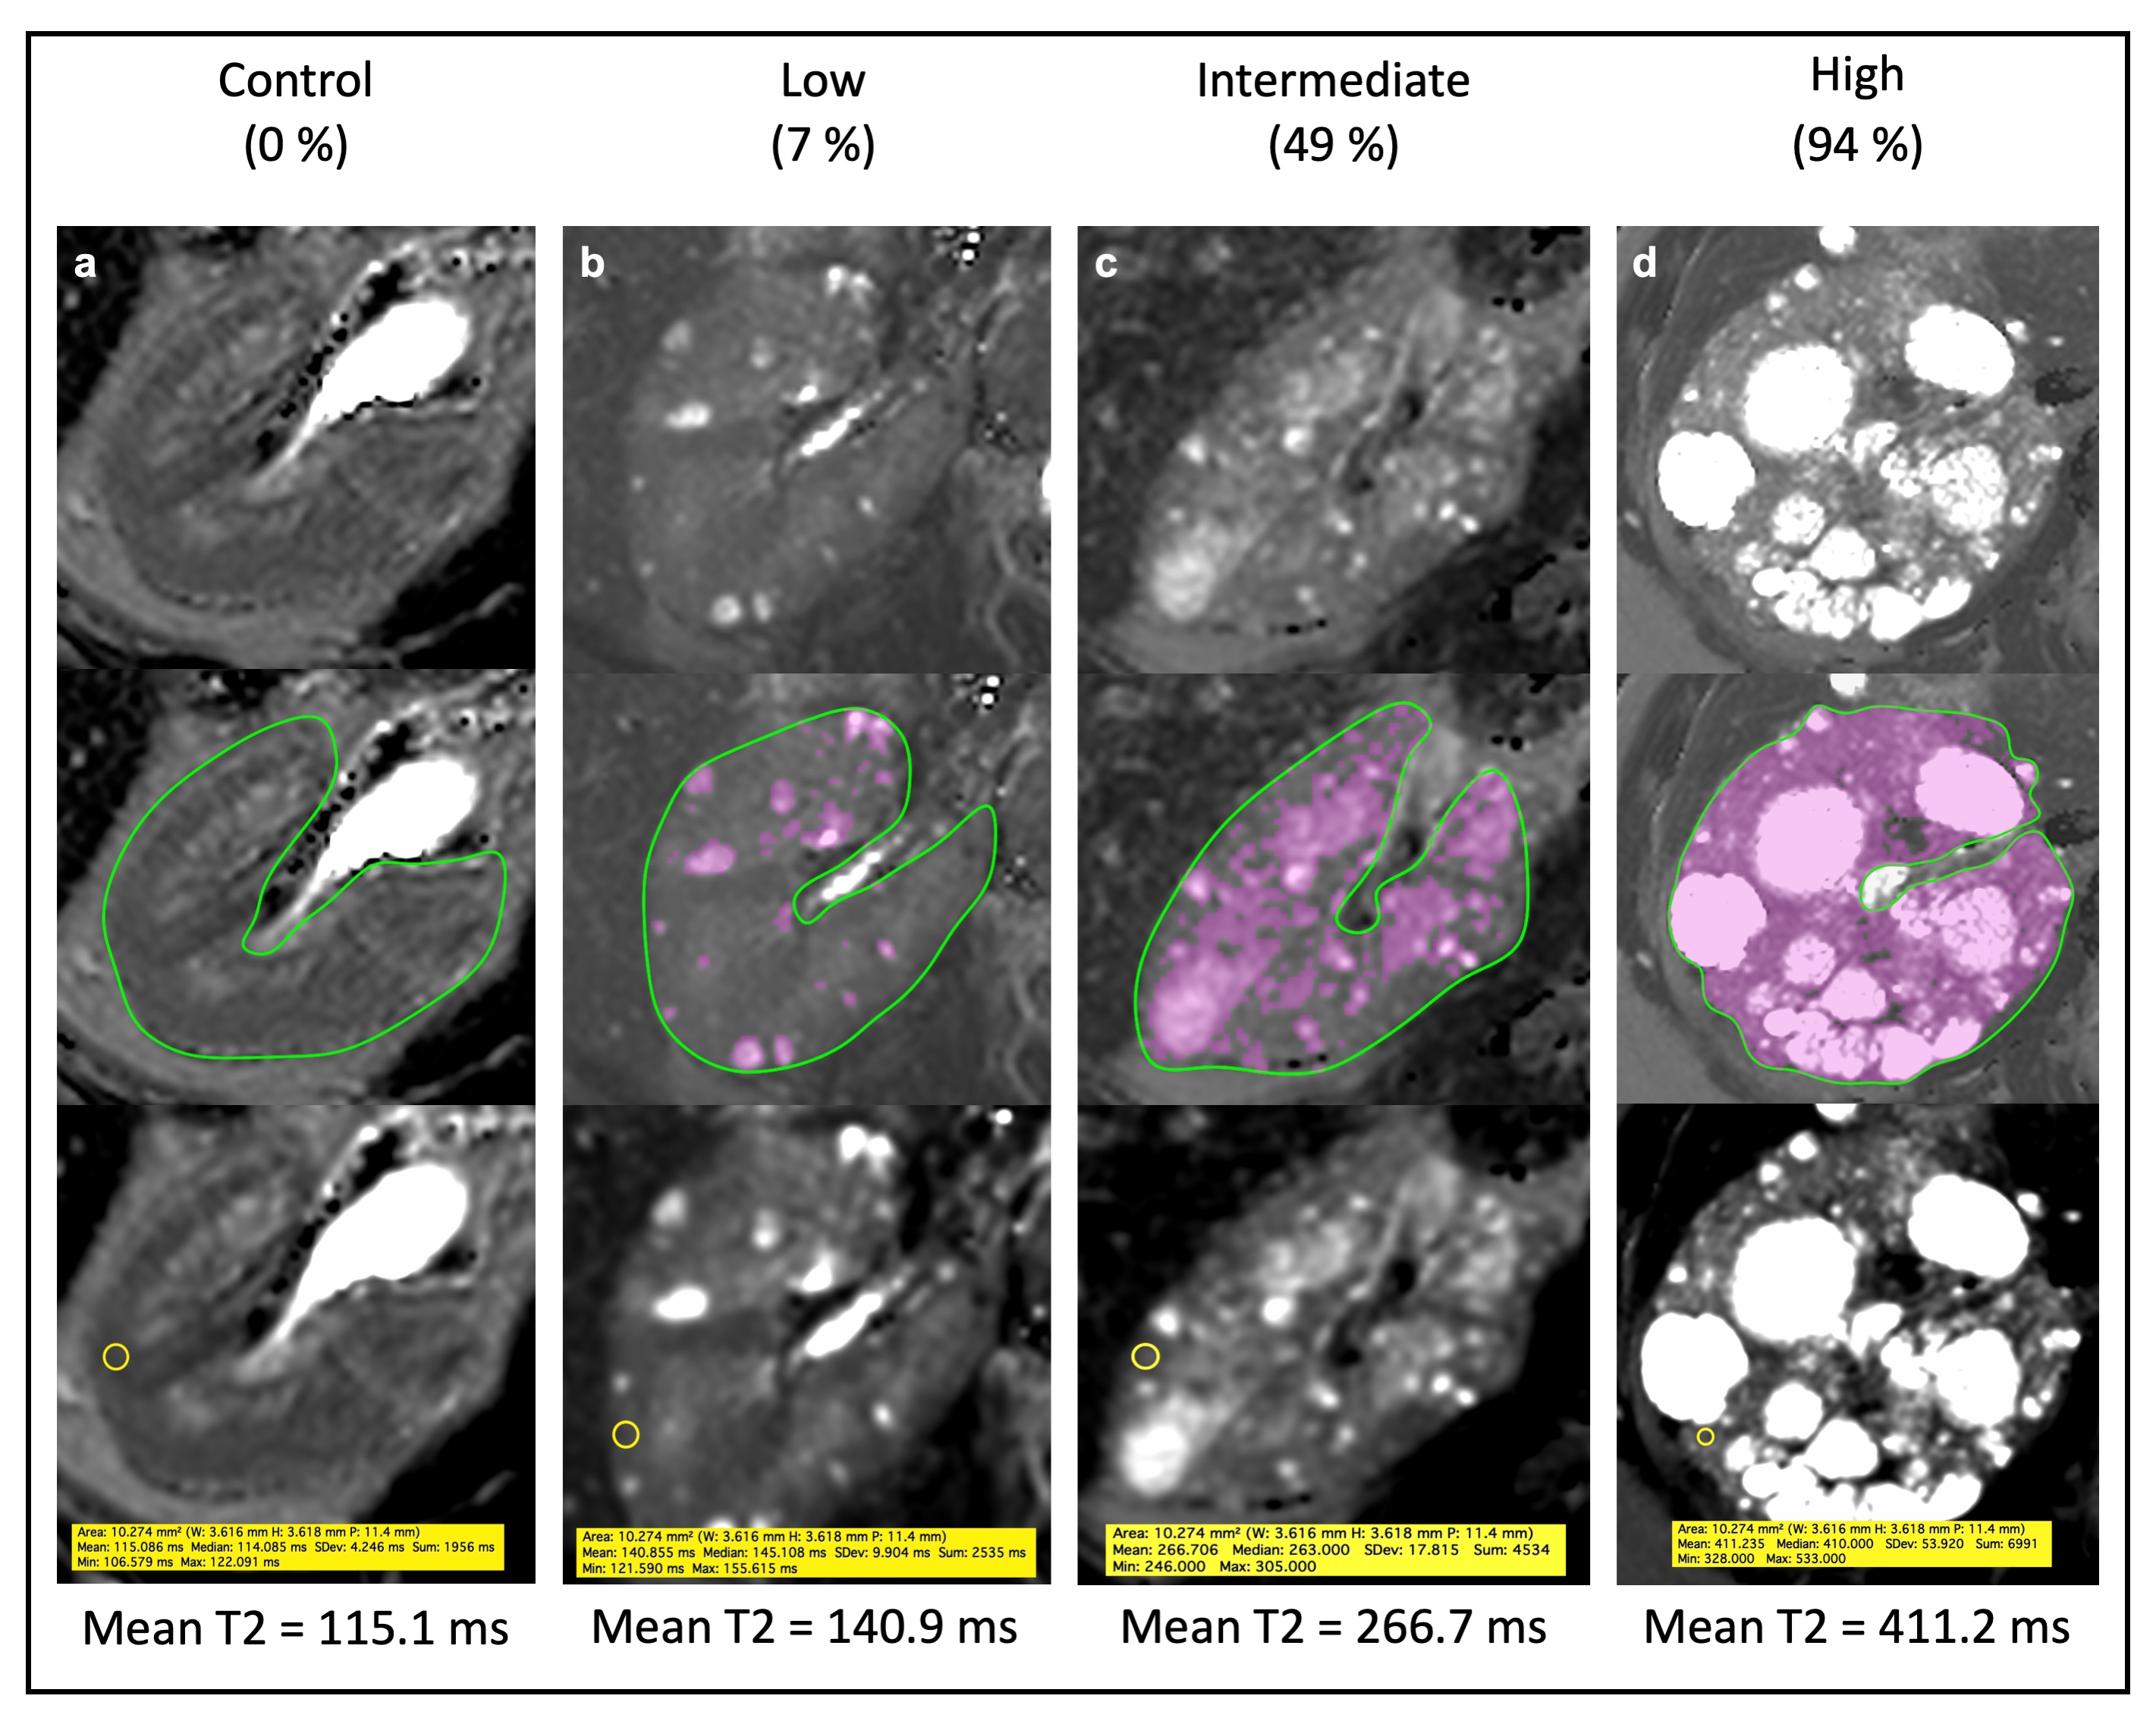
Measurement of cyst fraction and kidney parenchyma-T2. Axial oriented T2-map of the right
kidney. Top row images represent status before, middle row images status after
segmentation of the cystic kidney tissue, pink color indicating segmented
kidney cysts. Bottom row images represent status post ROI-placement in the
non-cystic residual kidney parenchyma to measure parenchyma-T2.
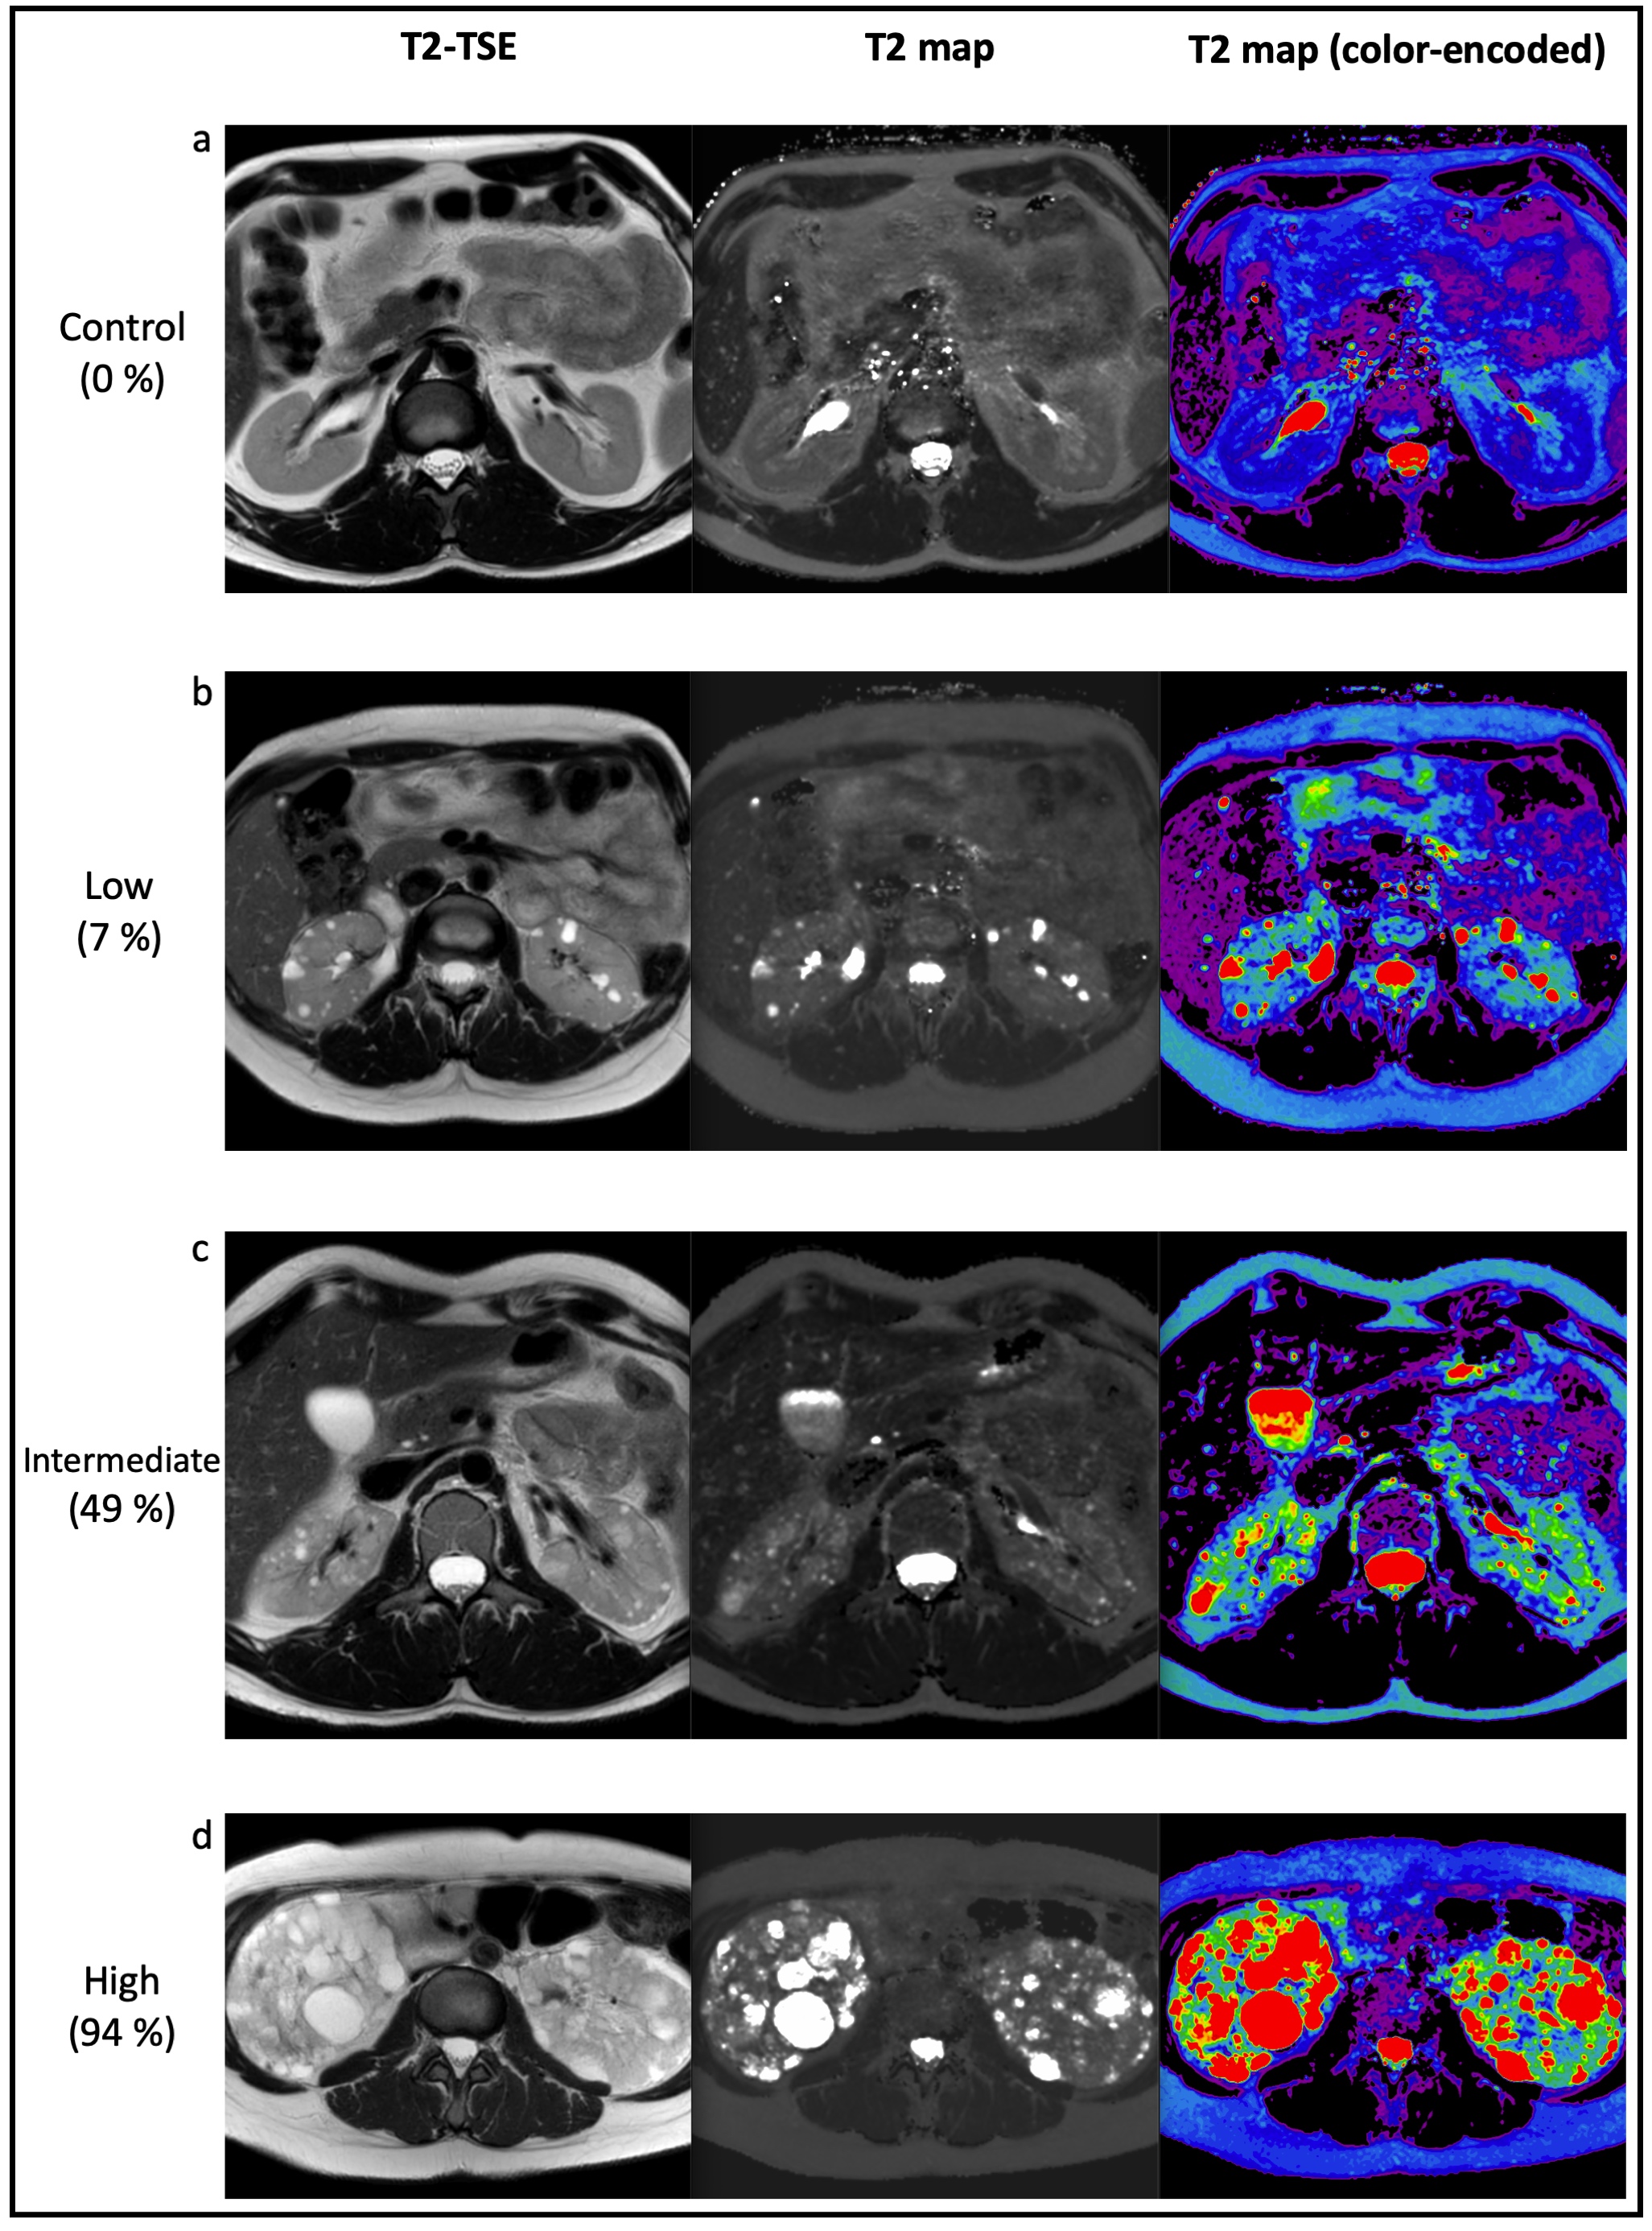
Comparison of T2-TSE
and T2 maps (without and with color-encoding based on T2-values) for visual
differentiation between cysts and non-cystic parenchyma.
On T2 maps, high
T2-values (fluid) are represented by hyperintense pixels, while non-cystic
parenchyma is hypointense. In color-encoded T2 maps, the amount of fluid within
a voxel is illustrated from high to low using a color-scheme (high to low
T2-values: red, orange, yellow, green, blue) with easier visual differentiation
of cysts.
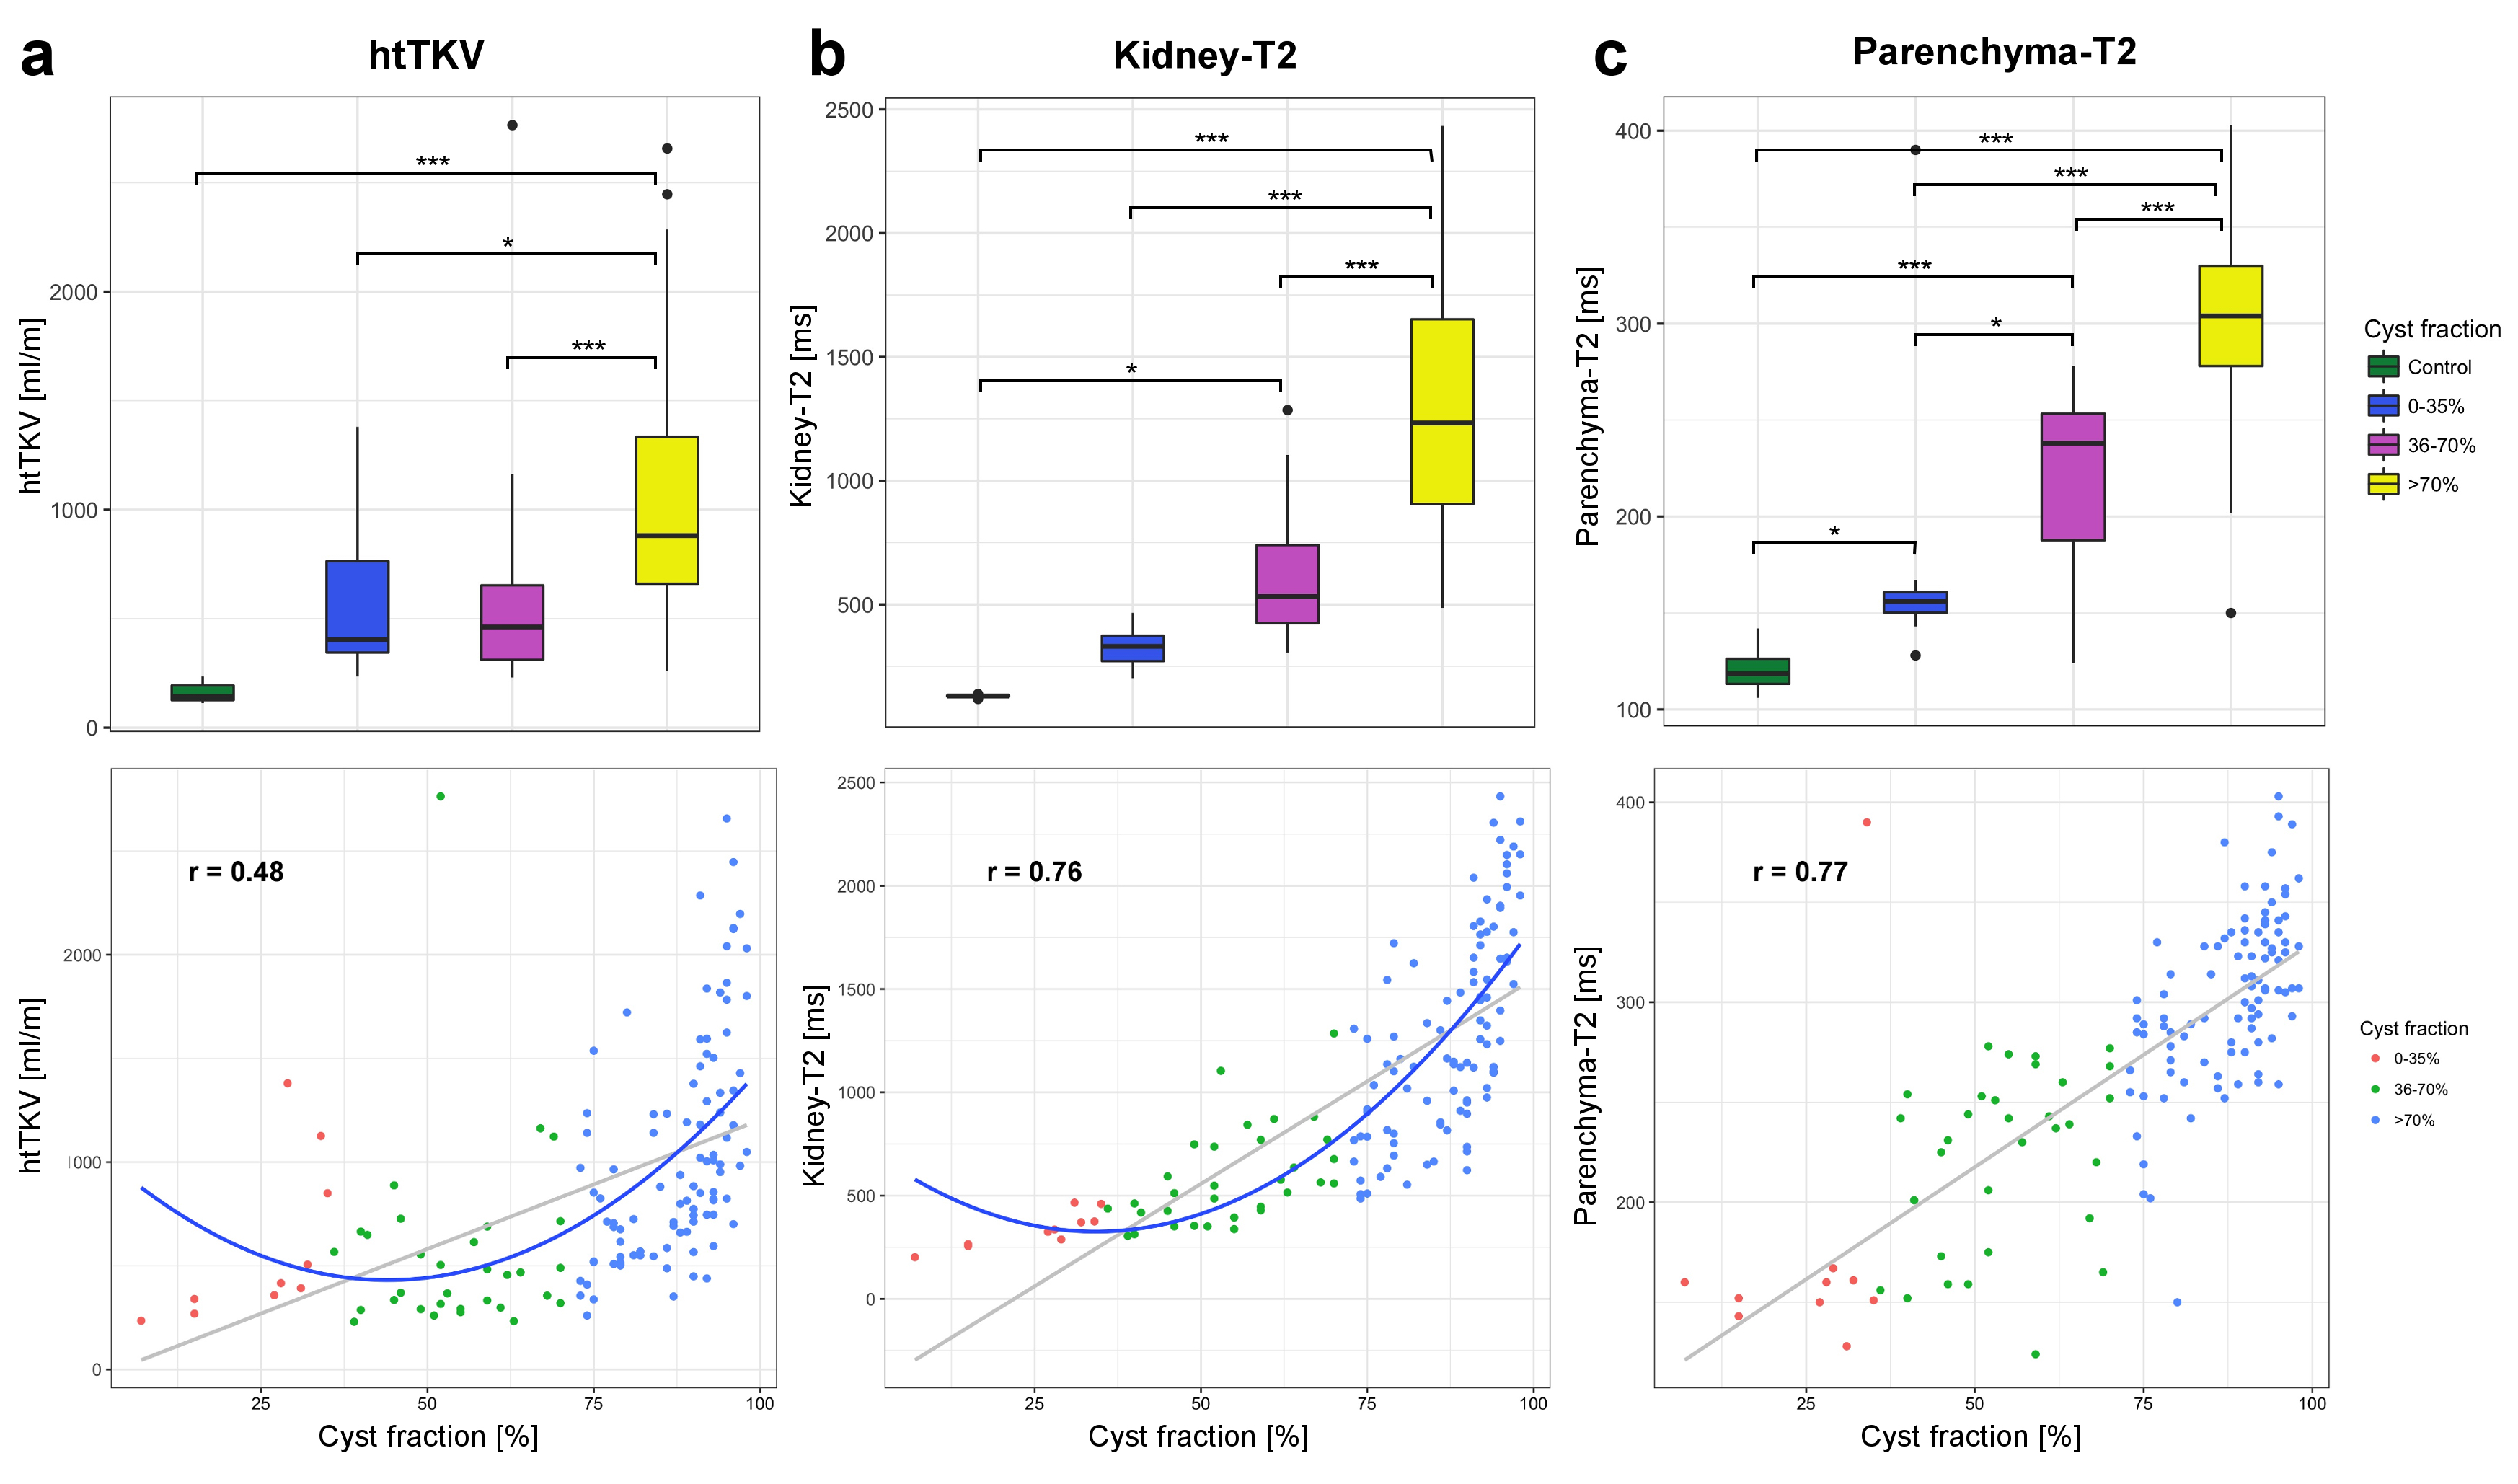
Analysis of htTKV,
kidney-T2 and parencyhma-T2 for the whole patient cohort as well as controls.
Box-and-whisker plots visualize the separation of groups divided according to
cyst fraction. Multinomial logistic regression models allow to compare the
correlation between the tested parameters with the cyst fraction.
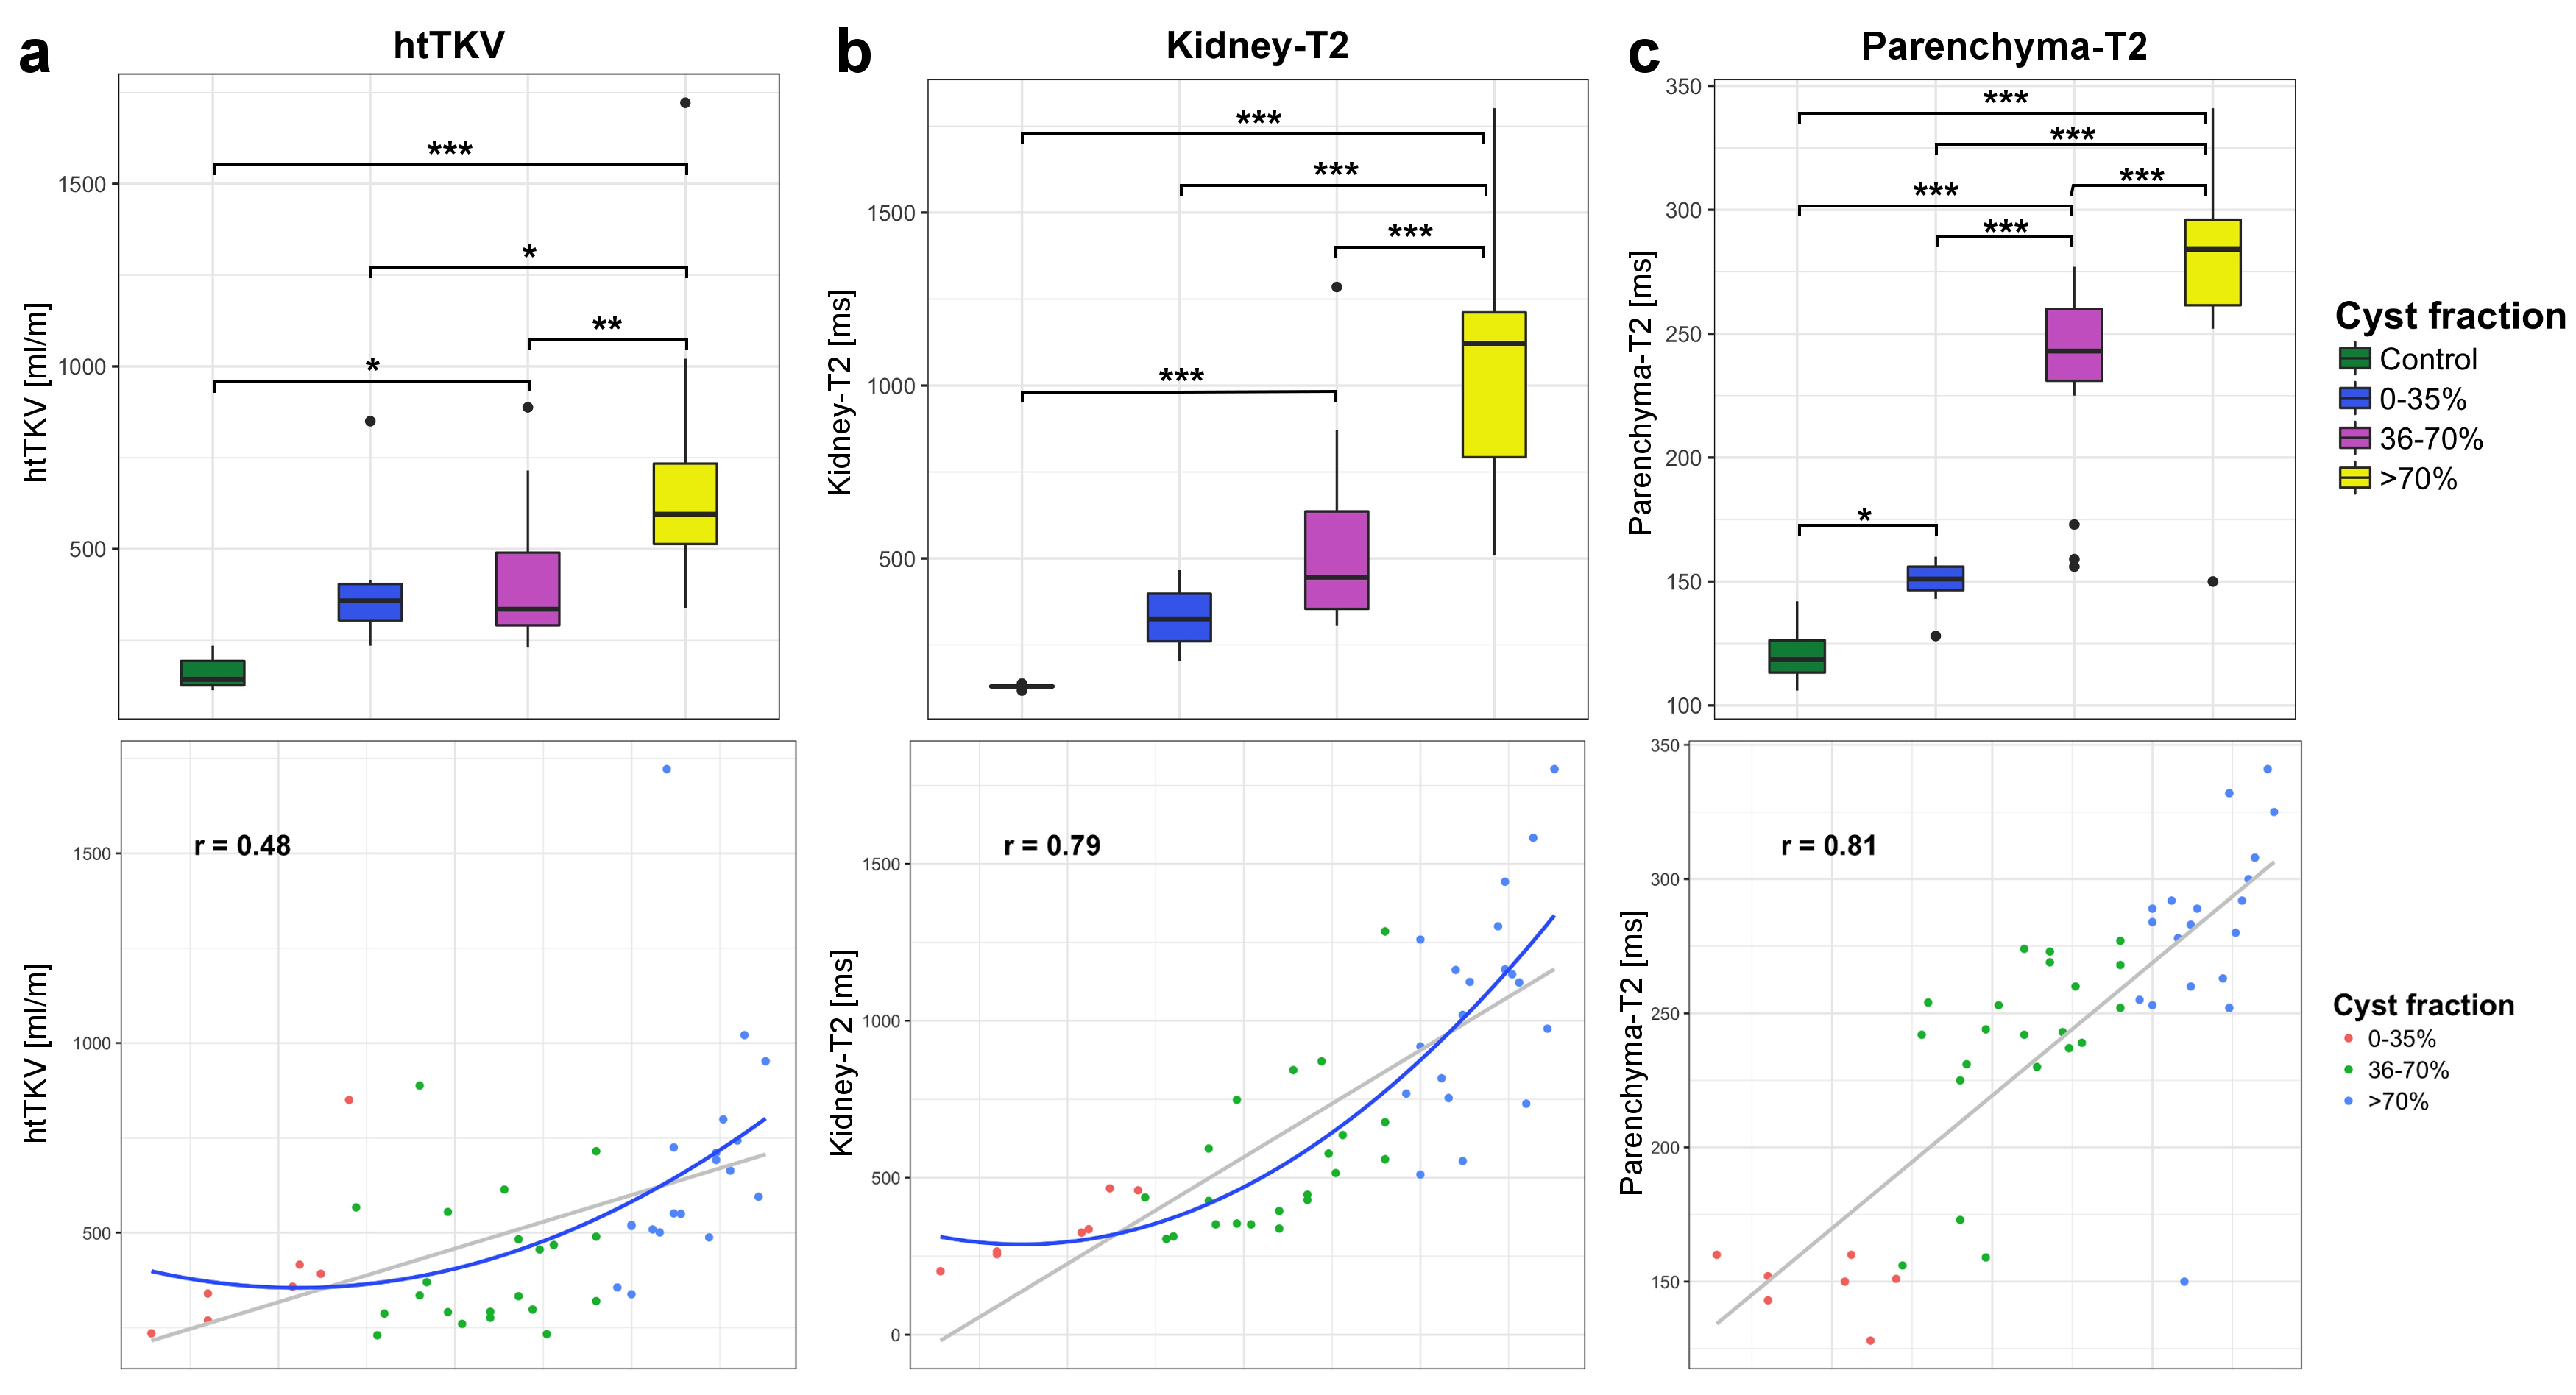
Subgroup-analysis of htTKV, kidney-T2 and parencyhma-T2
for patients with a preserved kidney function (GFR>90ml/min/m2) as well as controls. Box-and-whisker plots
visualize the separation of groups divided according to cyst fraction.
Multinomial logistic regression models allow to compare the correlation between
the tested parameters with the cyst fraction.