0944
A Comparison of T2 Mapping Methods in the Kidneys
Alexander J Daniel1, Eleanor F Cox1, Charlotte E Buchanan1, and Susan T Francis1
1Sir Peter Mansfield Imaging Centre, University of Nottingham, Nottingham, United Kingdom
1Sir Peter Mansfield Imaging Centre, University of Nottingham, Nottingham, United Kingdom
Synopsis
Renal T2 mapping is still in its infancy with little consensus on methodology between studies, this leads to a variation in T2 measurements between studies. Here four T2 mapping methods (Spin Echo-Echo Planar Imaging (SE-EPI), Multi-Echo Turbo Spin Echo (ME-TSE), Gradient Spin Echo (GraSE), and Carr-Purcell-Meiboom-Gill T2 preparation (T2 prep)) are compared on both a calibrated phantom and in-vivo kidneys. The GraSE technique was found to produce the most accurate maps relative to the phantom and form the clearest maps of the kidneys in-vivo, showing clear differences between cortical and medullary tissues.
Introduction
T2 weighting is a fundamental image contrast, T2 mapping has been shown to provide sensitivity to oedematous tissue and ischaemia in cardiac imaging. However T2 mapping in renal MRI is still in its infancy with only a few studies measuring this parameter1. Studies that have measured T2 show potential for evaluation of renal transplant function2 and early diagnosis of Autosomal Dominant Polycystic Kidney Disease (ADPKD)3. The variation in T2 measurements between studies is large, this is partly due to physiological factors such as hydration level, but also due to the variation in T2 mapping methodology. To date, no study has compared T2 mapping methods within the same subjects. Here, four renal T2 mapping methods are verified for accuracy on a calibrated phantom and the measured T2 values of the kidneys compared in humans.Methods
All data was collected on a Philips 3T Ingenia system and the sequence accuracy verified using a QalibreMD System Standard Model 130. The four methods compared were Spin Echo-Echo Planar Imaging (SE-EPI) (Repetition time - TR = 5000 ms, Echo time - TE = 20 – 70 ms in 5 ms steps, voxel size = 3 x 3 x 5 mm3), Multi-Echo Turbo Spin Echo (ME-TSE) (TR = 3000 ms, TE = 13 – 130 ms in 13 ms steps, TSE factor = 10, voxel size = 3 x 3 x 5 mm3), Gradient Spin Echo (GraSE) (TR = 3000 ms, TE = 11.2 – 173.3 ms in 5.6 ms steps, TSE factor = 30, voxel size = 3 x 3 x 5 mm3) and Carr-Purcell-Meiboom-Gill T2 preparation (T2 prep) (TR = 3000 ms, TE = 5.3 ms, effective TE = 0, 40, 80 and 160 ms, voxel size limited by EPI factor= 3 x 5.65 x 5 mm3, EPI Factor 17). All protocols had a consistent field of view (288 x 288 x 25 mm3) and flip angle (90°); all sequences were respiratory triggered and collected within 6 to 9 minutes depending on breathing rate.Each sequence was used to generate a T2 map on the calibrated phantom, Figure 1, the mean T2 of each sphere was compared to their standard. Five subjects were scanned using each of the four sequences. A T1–weighted image with clear cortical medullary contrast was used to define cortex and medulla regions of interest of each subject allowing an average T2 for each tissue to be calculated.
Results
Figure 2 shows the signal decay curves and T2 fit across the T2 spheres in the QalibreMD System which range from 5.35 ms to 645.8 ms. The SE-EPI method overestimates T2 below 20 ms due to the long minimum TE compared to other methods. More accurate measurement of the shorter T2 spheres was recorded using the ME-TSE protocol however the raw data is noisier, this manifests itself as inaccuracies in the longer T2 measurements due to their smaller dynamic range over the TE sampled. GraSE produced the most accurate measurements of the four methods, although still struggles to accurately measure the 5.35 ms sphere. Data collected using the T2 prep method does not fit the standard values below 100 ms due to its small number of data points.In-vivo data collected using each method from a representative subject is shown in Figure 3. The SE-EPI method generated maps with little blurring, but showed lack of differentiation between the cortex and medulla. Maps generated using the ME-TSE method suffer from a large amount of blurring due to the relatively long echo train length. This blurring leads to structures being obscured in the map and only a very small differentiation between cortex and medulla. Using the GraSE method, there is a clear difference between the cortex and medulla and the data fits well to a T2 decay, the short echo-spacing made possible by GraSE means more TEs can be sampled and therefore leads to a more accurate fit. The map made using the T2 prep method suffers from noise in the raw data. Some of the areas with a longer T2 do match with the medulla seen in the GraSE map however due to the degree of noise, it is un-usable on its own.
In Figure 4, the mean T2 of the cortex and medulla measured over five subjects with each method is shown. The two methods that have delivered the highest image quality, SE-EPI and GraSE, produce substantially different values of T2 in-vivo despite their accuracy over the range of T2 in the kidneys when used on the phantom. This disparity is due to the additional confounding factors of diffusion and flow present in the body; these do not affect the GraSE sequence whilst, as expected, are considerable for the SE-EPI sequence. This shortening in T2 measured with SE-EPI, and a slight shortening when using the ME-TSE method compared to GraSE and T2 prep is consistent with literature1,4.
Conclusion
The ME-TSE and GraSE sequences produce the most accurate T2 maps of the quantitative phantom however in-vivo ME-TSE suffers from blurring. As such, GraSE produces the most accurate in-vivo renal T2 maps.Acknowledgements
References
- Wolf, M. et al. Magnetic resonance imaging T1- and T2-mapping to assess renal structure and function: a systematic review and statement paper. Nephrol. Dial. Transplant. 33, ii41–ii50 (2018).
- Mathys, C. et al. T2’ Imaging of Native Kidneys and Renal Allografts – a Feasibility Study. RöFo - Fortschritte Auf Dem Geb. Röntgenstrahlen Bildgeb. Verfahr. 183, 112–119 (2011).
- Franke, M. et al. Magnetic resonance T2 mapping and diffusion-weighted imaging for early detection of cystogenesis and response to therapy in a mouse model of polycystic kidney disease. Kidney Int. 92, 1544–1554 (2017).
- Ke, Z. et al. Validation of SE-EPI-based T2 mapping for characterization of prostate cancer: a new method compared with the traditional CPMG method. Abdom. Radiol. 44, 3432–3440 (2019).
Figures
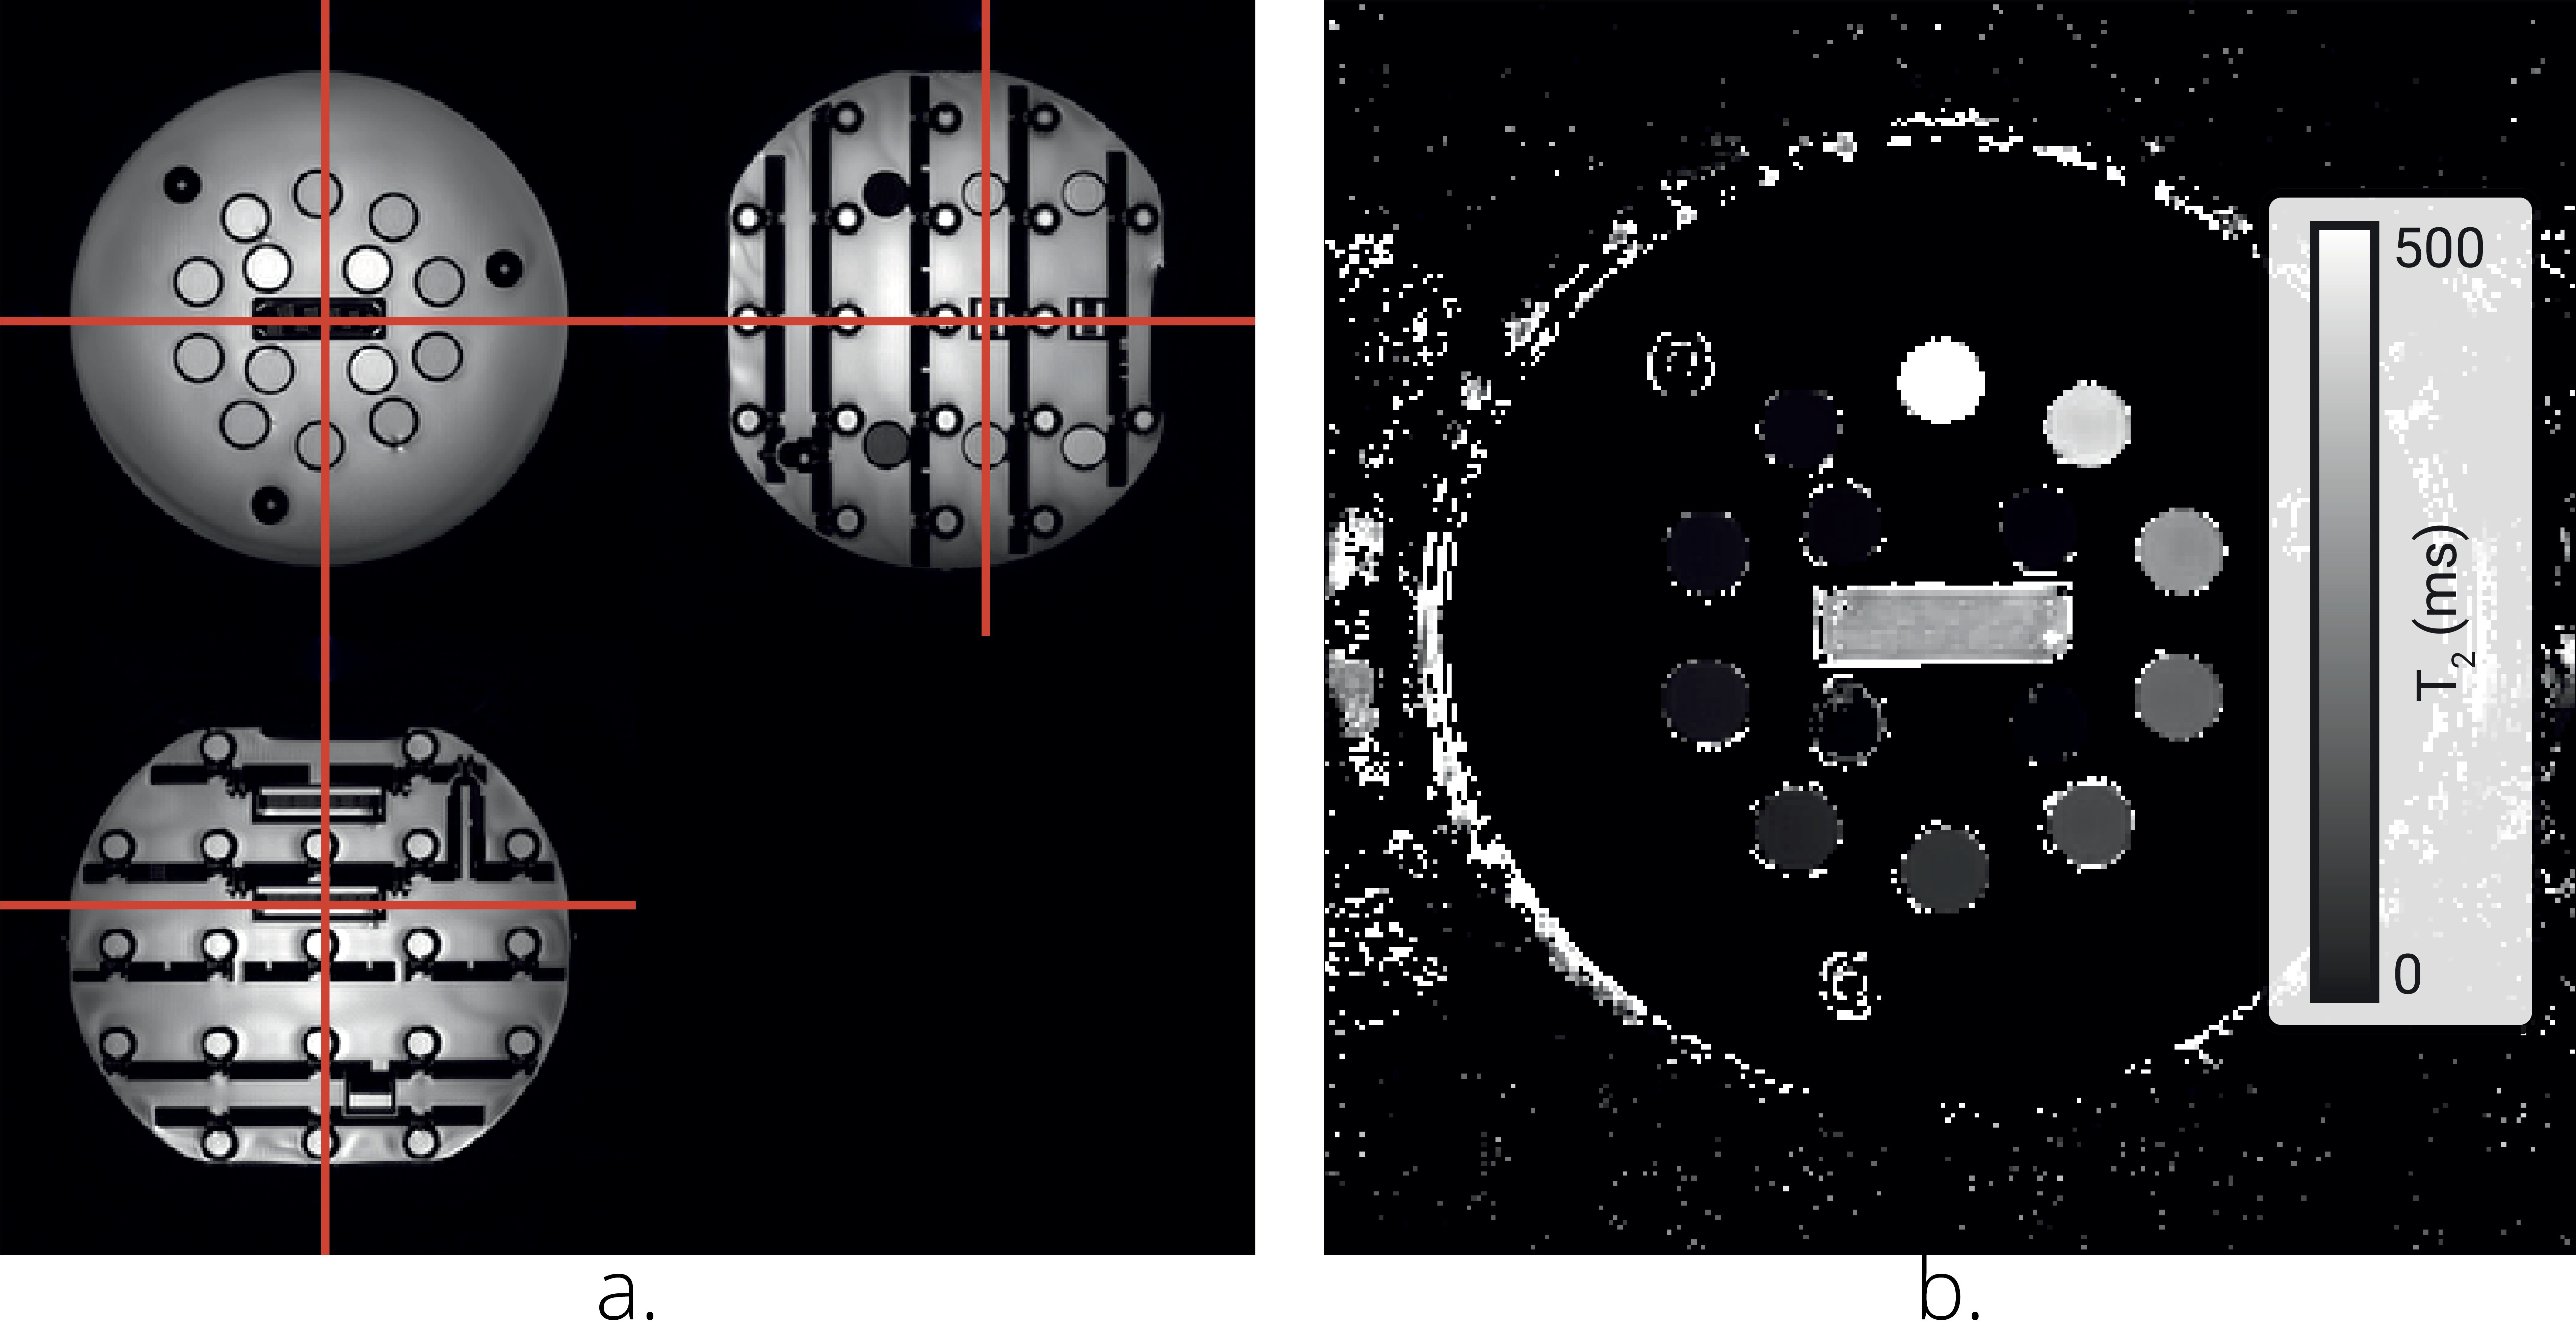
Figure 1: a.
An image of the QalibreMD System Standard Model 130 phantom illustrating the 14
spheres. b. Example T2 map generated using the GraSE sequence.
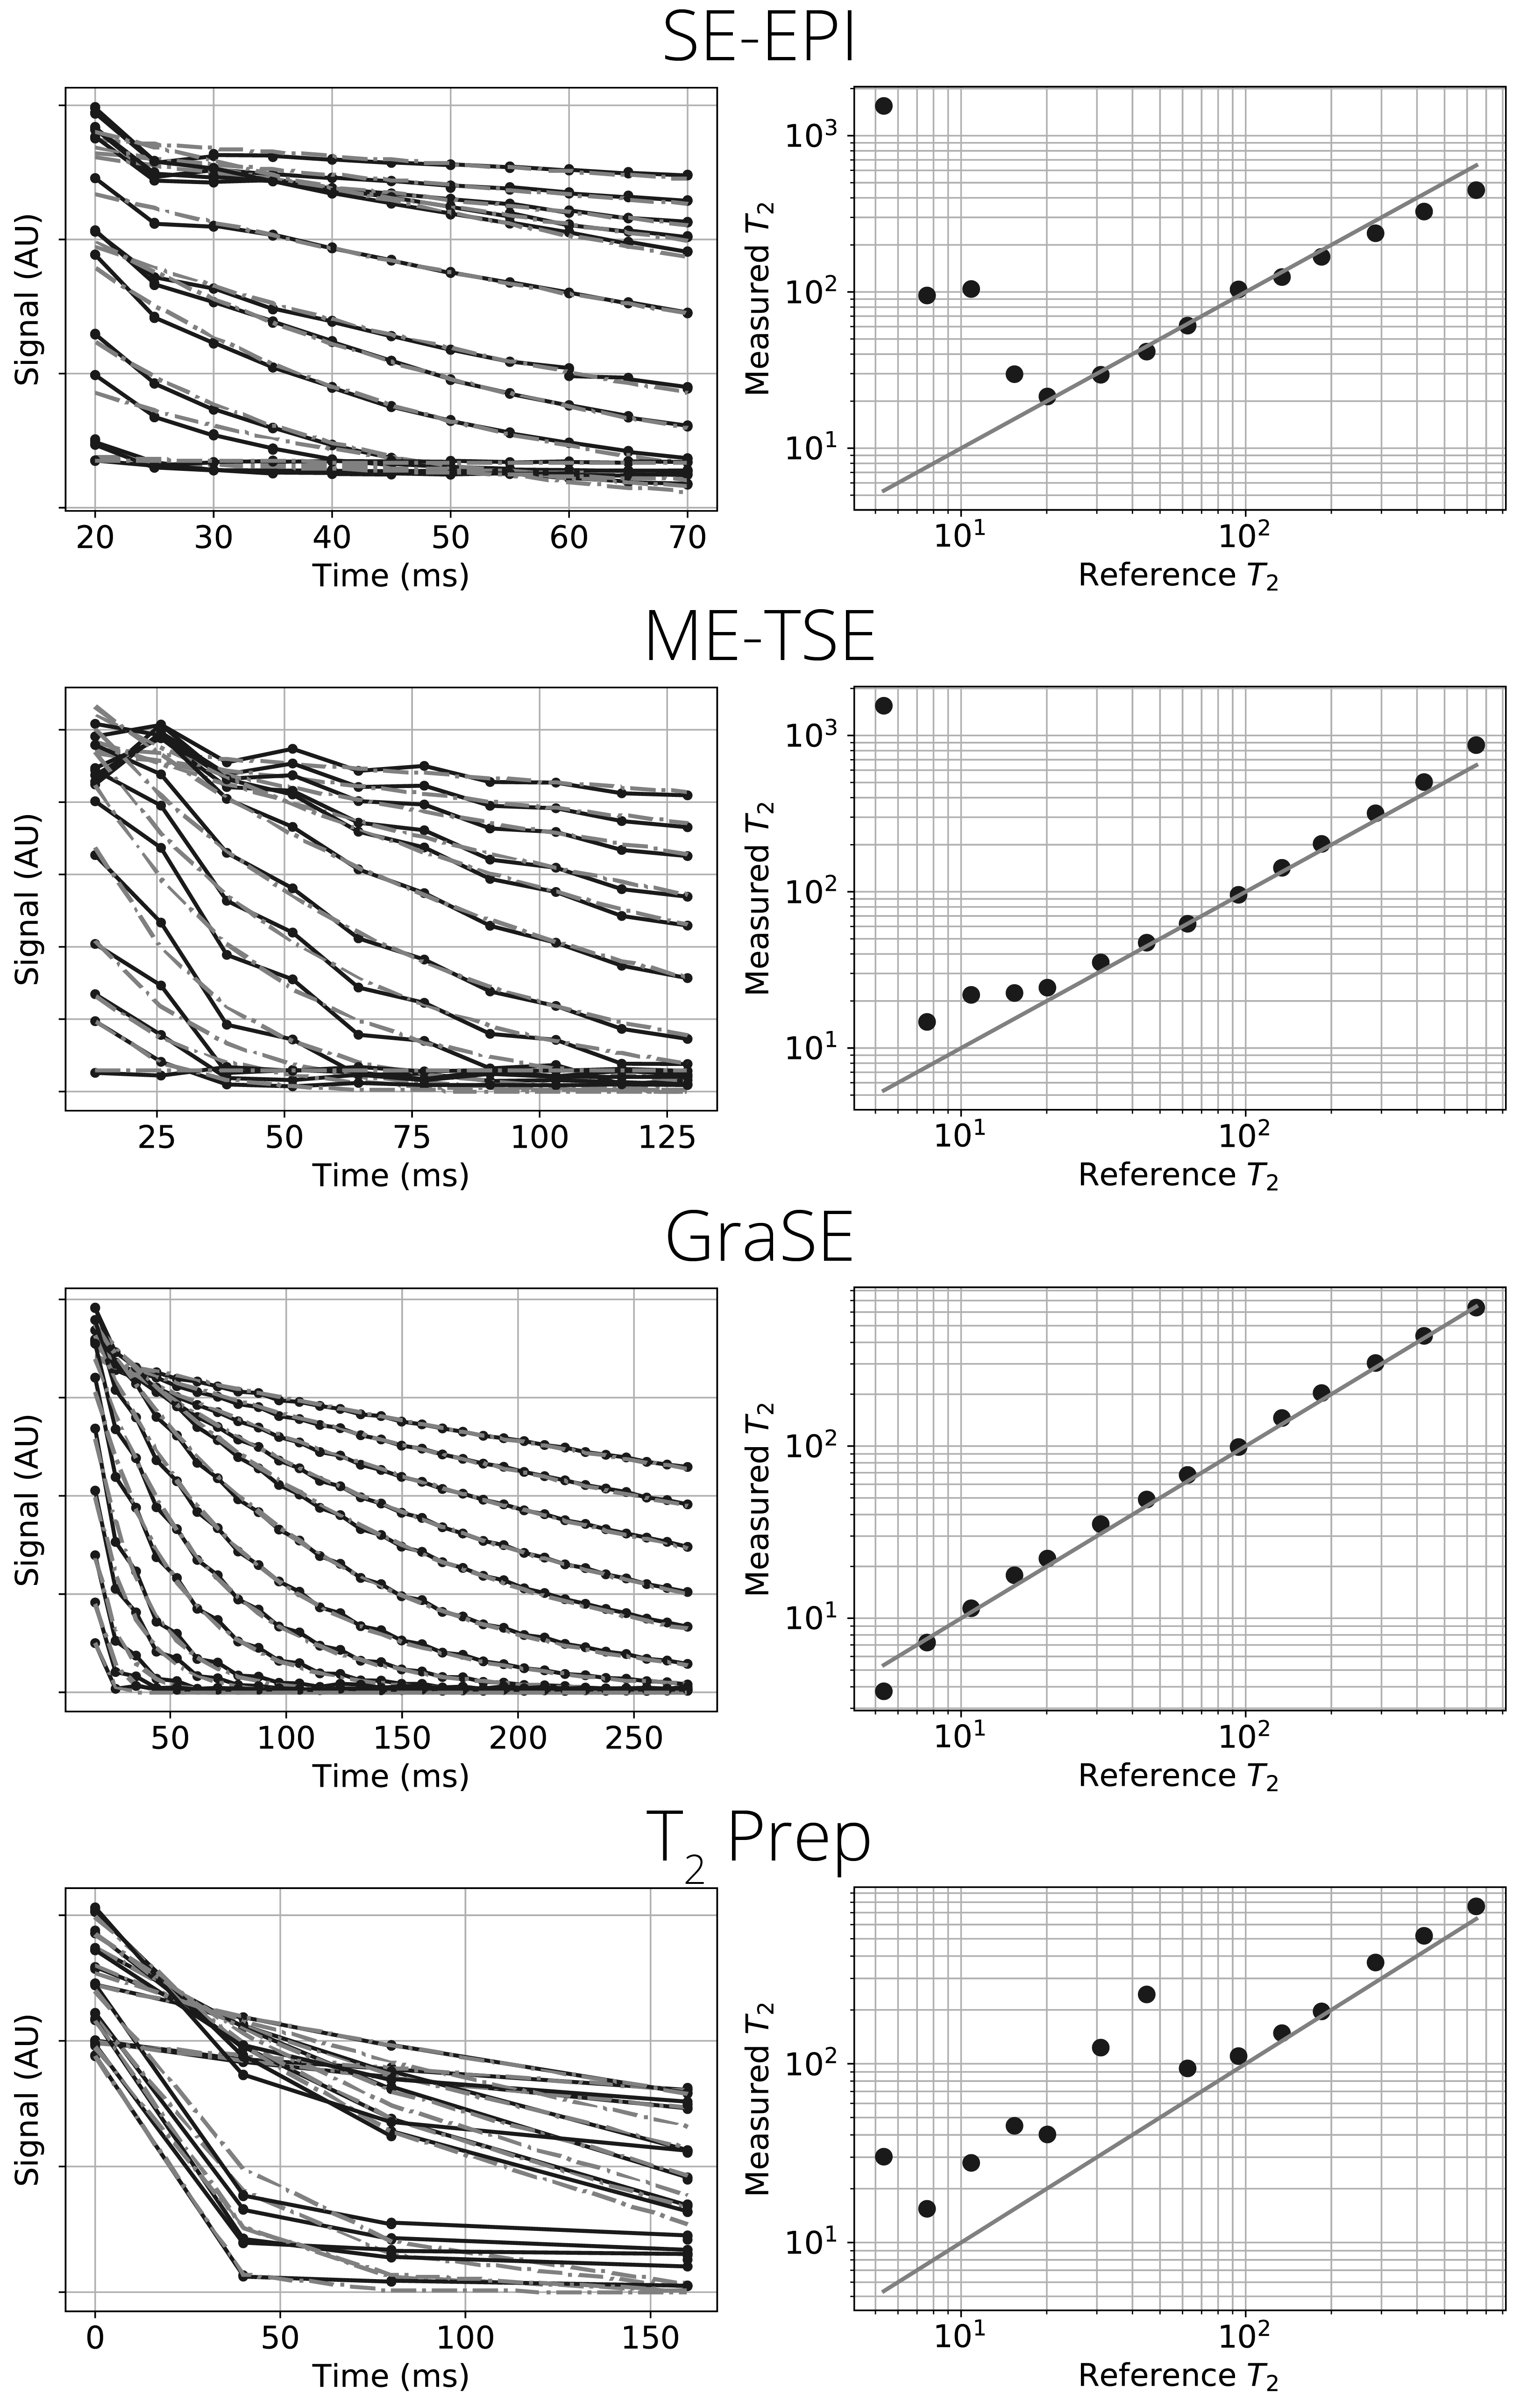
Figure 2: Left panes show the
raw data from each sphere in the phantom (black solid line) and the fit decay
(grey dashed line), right panes show the mean T2 calculated for each
sphere, a perfect correlation is shown as a solid grey line.
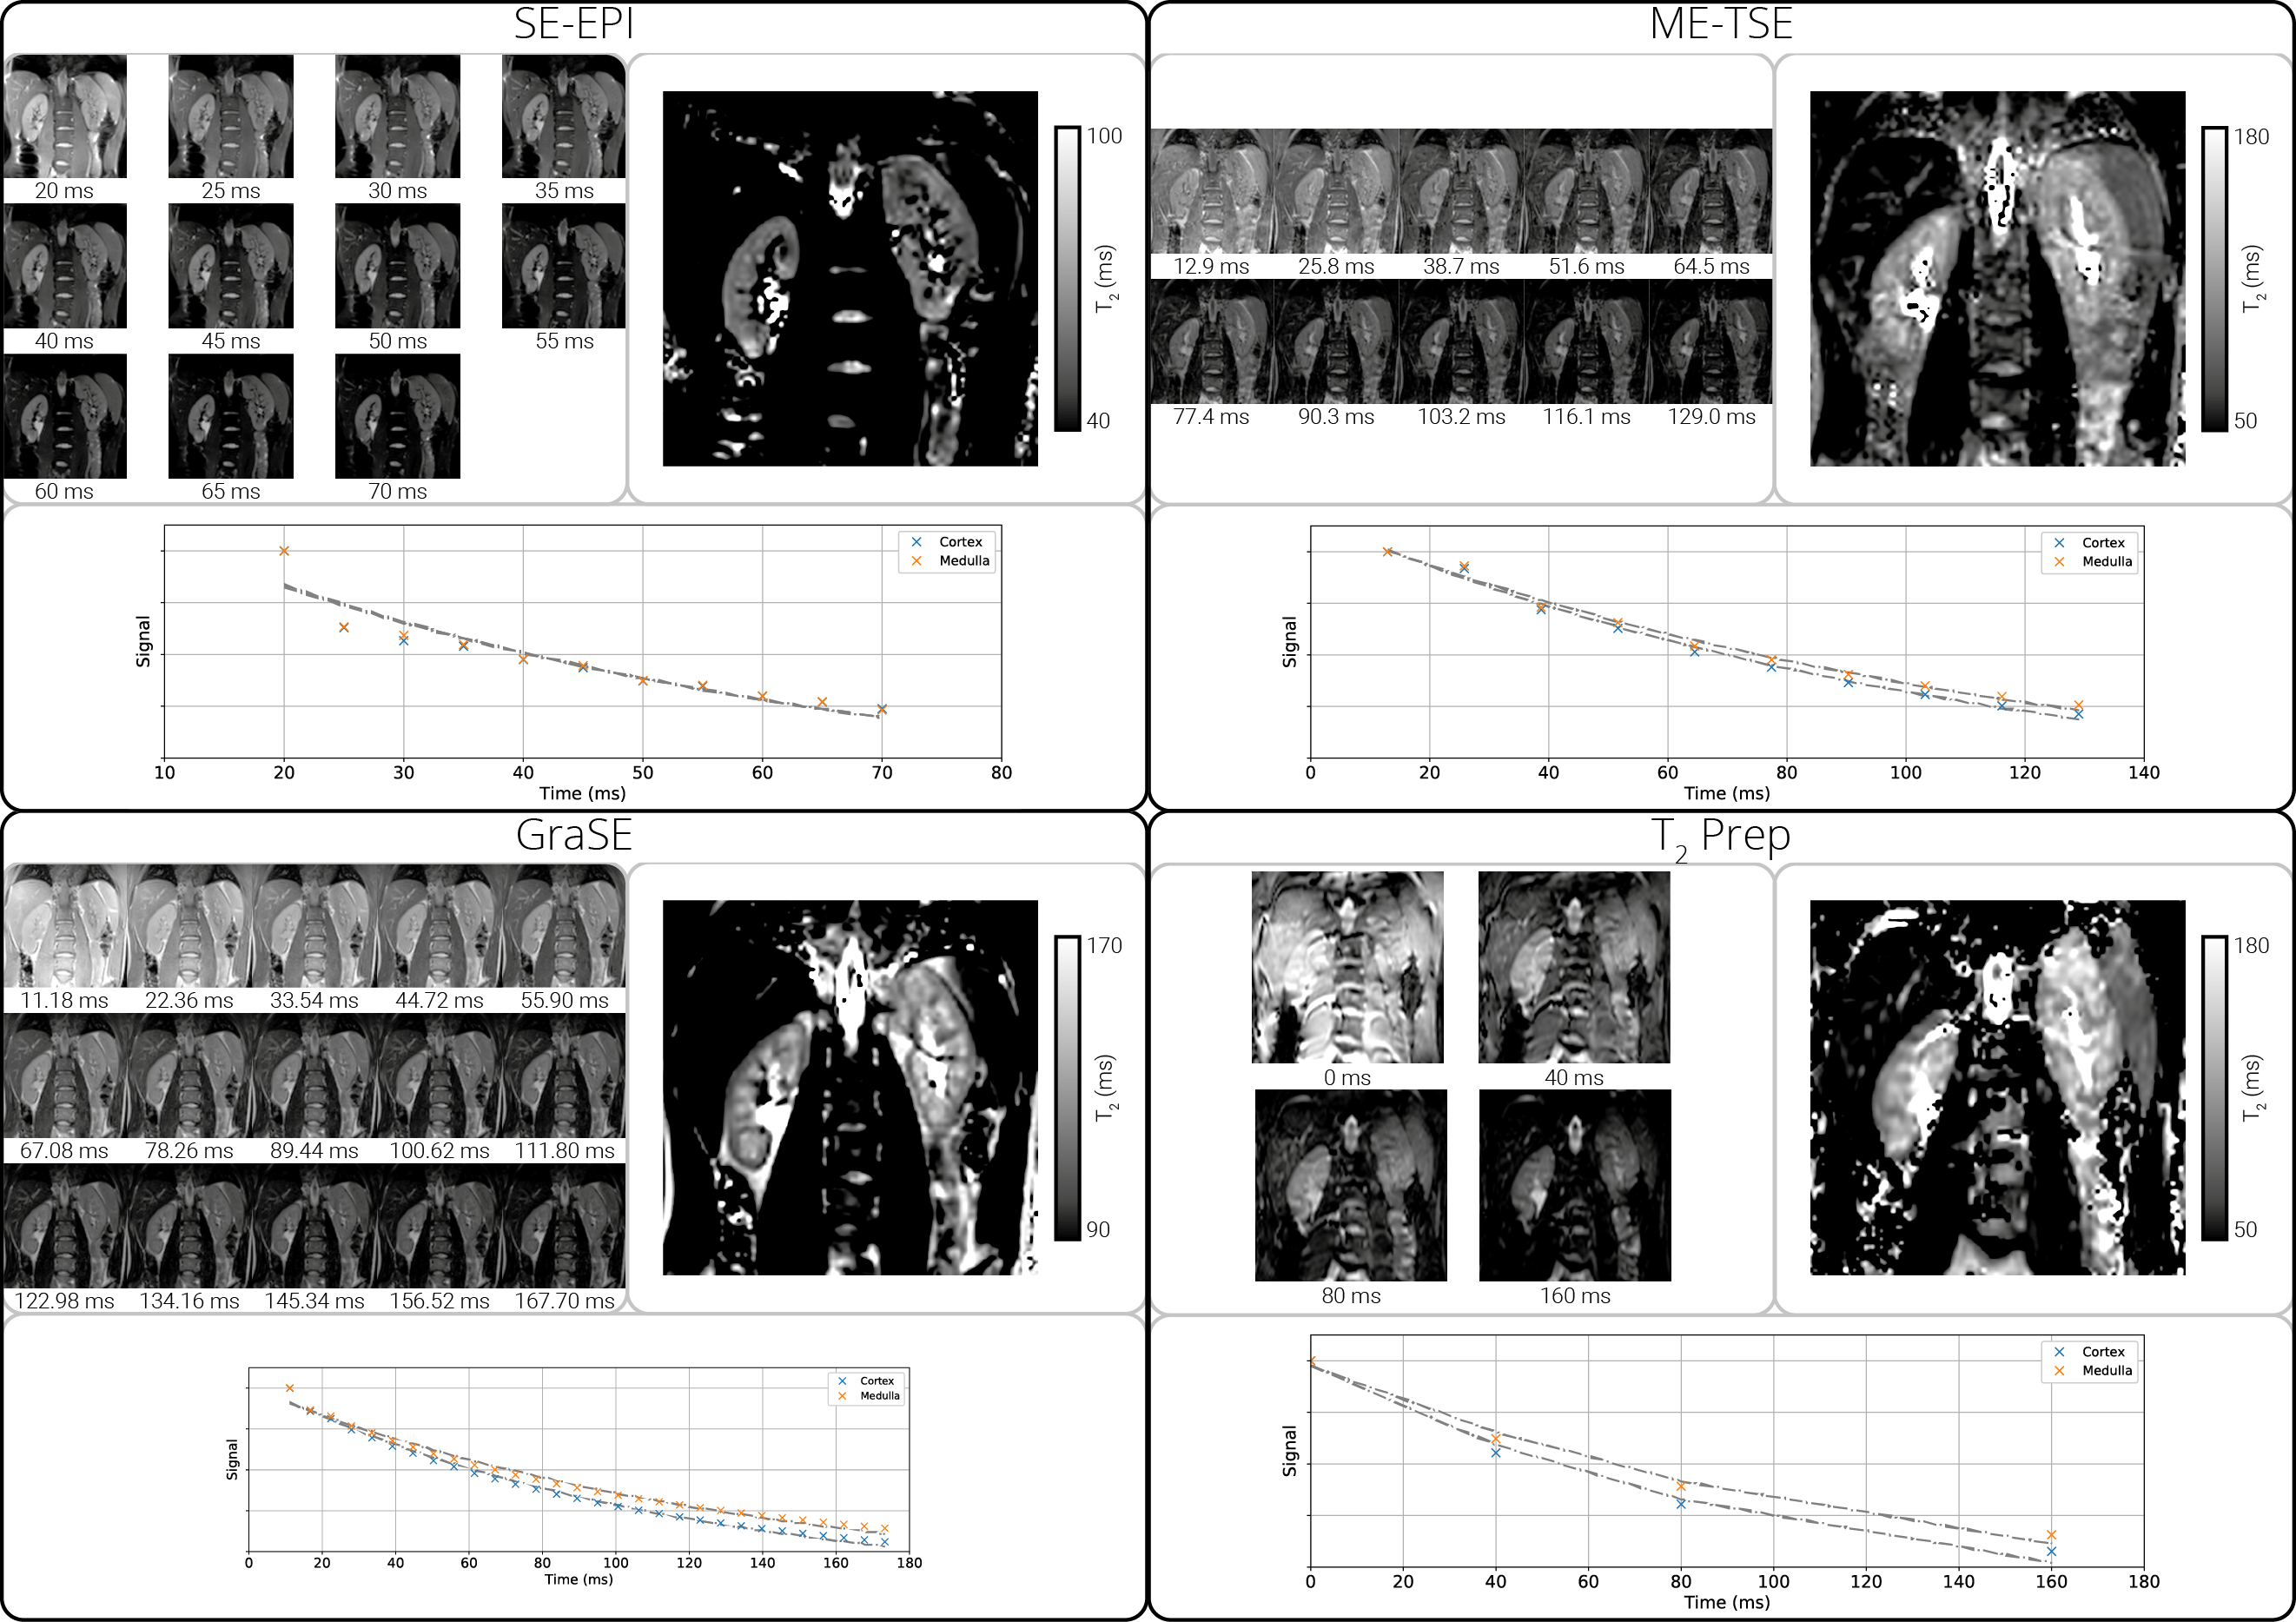
Figure
3: Each subfigure shows the raw data from each TE, the
calculated T2 map and the mean signal for the cortex and medulla
over the range of TE.
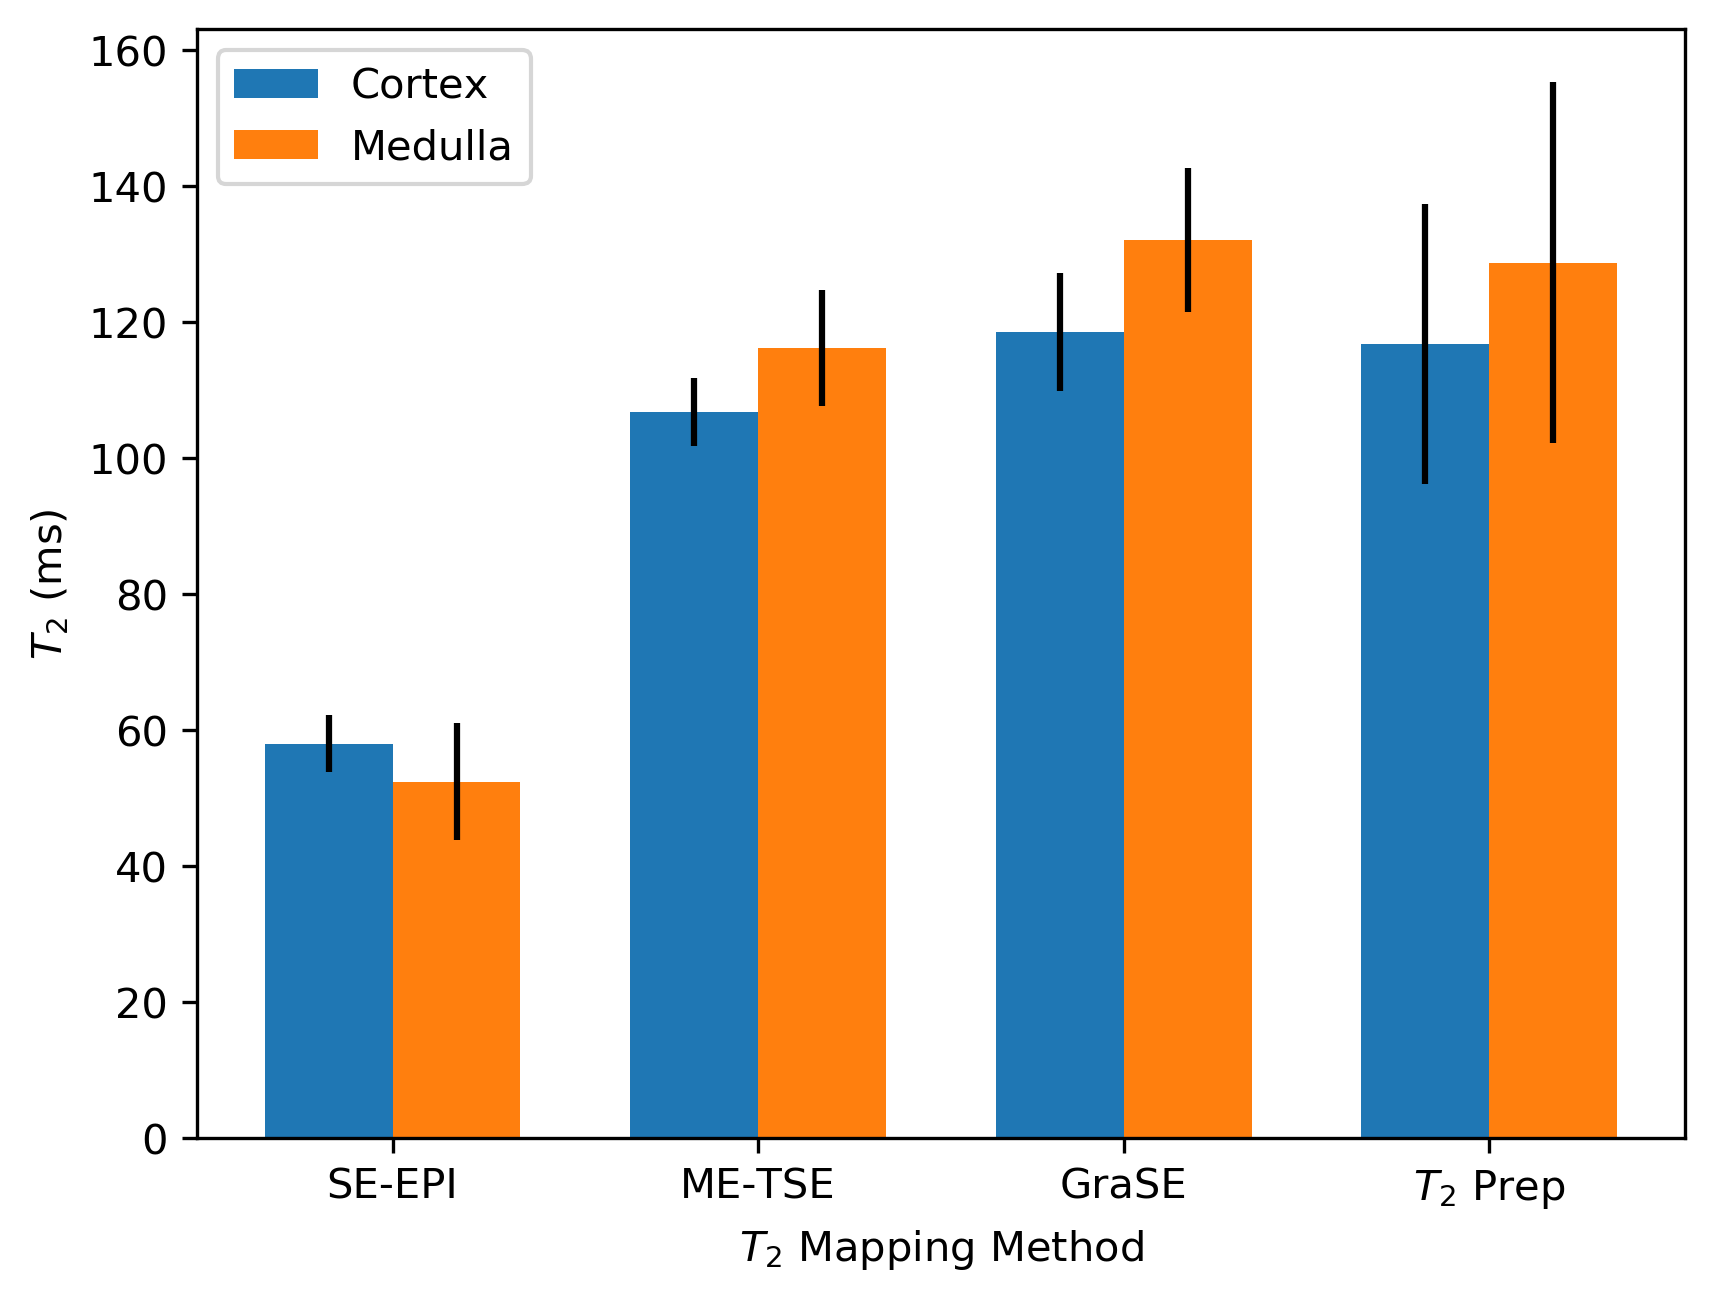
Figure
4: The mean T2 of the renal cortex and
medulla measured using each of the four methods.