0943
Delayed urea differential enhancement CEST (dudeCEST)-MRI with T1 correction for monitoring renal urea handling1Department of Bioengineering, University of California, Berkeley, Berkeley, CA, United States, 2Berkeley Preclinical Imaging Core (BPIC),University of California, Berkeley, Berkeley, CA, United States
Synopsis
Urea recycling is a major component of renal tubular function and may provide an in vivo surrogate for tubular dysfunction in renal diseases. We demonstrate an approach of delayed urea differential enhancement CEST (dudeCEST)-MRI, which detects enhanced urea CEST contrast specific to the inner medulla and papilla of the mouse kidney at 20 minutes after urea injection. To enhance quantification while accounting for different T1 values within the kidney, apparent exchange-dependent relaxation (AREX) correction was applied. The combination of dudeCEST with AREX analysis will be a useful platform for assessment of renal urea recycling as a surrogate for tubular dysfunction.
Introduction
Urea recycling is an essential component of renal tubular function for efficient water reabsorption.1 While plasma and urine biomarkers exist for detection of kidney injury, only invasive biopsy can be used to detect gradual tubular dysfunction from aging, HIV, and infectious disease. Imaging of renal urea handling may non-invasively quantify tubular functional loss in the absence of kidney injury. Previously, we used CEST-MRI to detect intrarenal urea distribution and enhanced contrast in the inner medulla and papilla after infusion.2 However, the impact of regional T1 differences upon urea CEST-contrast was not examined. Further, the use of infusion generated significant variability. Here we demonstrate an approach of delayed urea differential enhancement CEST (dudeCEST) for renal urea concentration imaging, analogous to late gadolinium enhancement (LGE) MRI for detection of scar tissue. We further quantify the impact of regional T1 variation on CEST contrast via apparent exchange-dependent relaxation (AREX) compensation.Methods
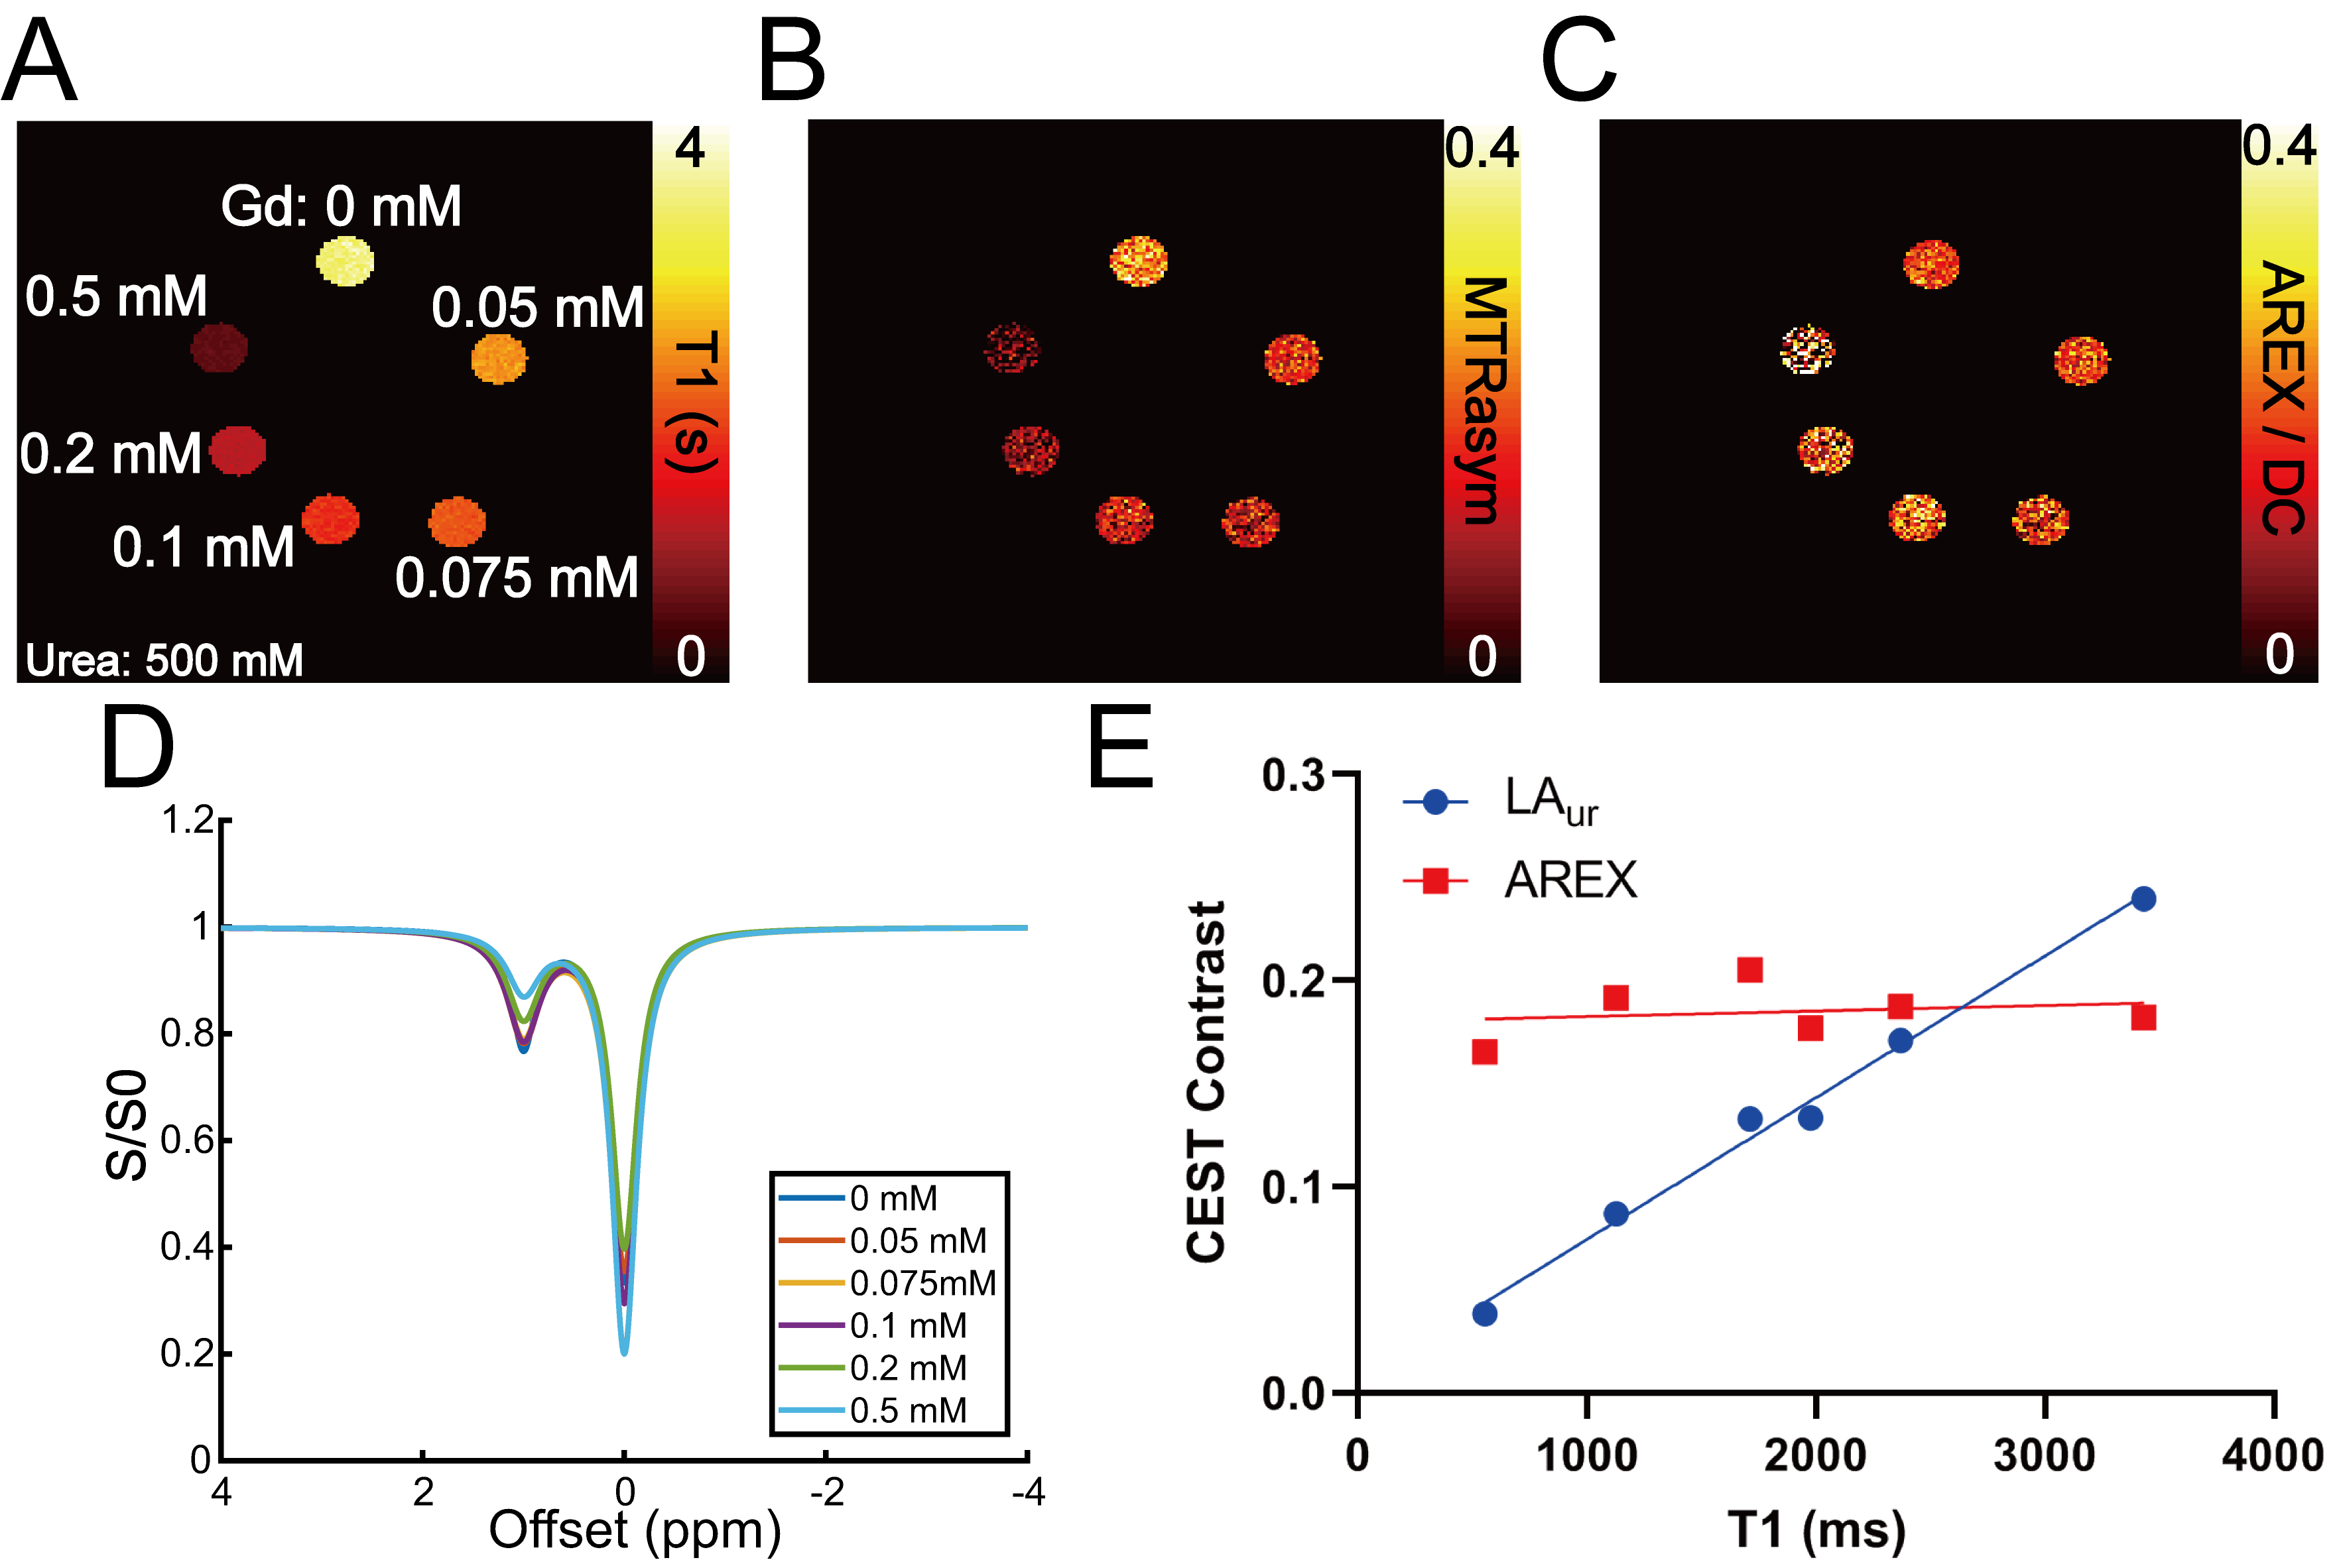
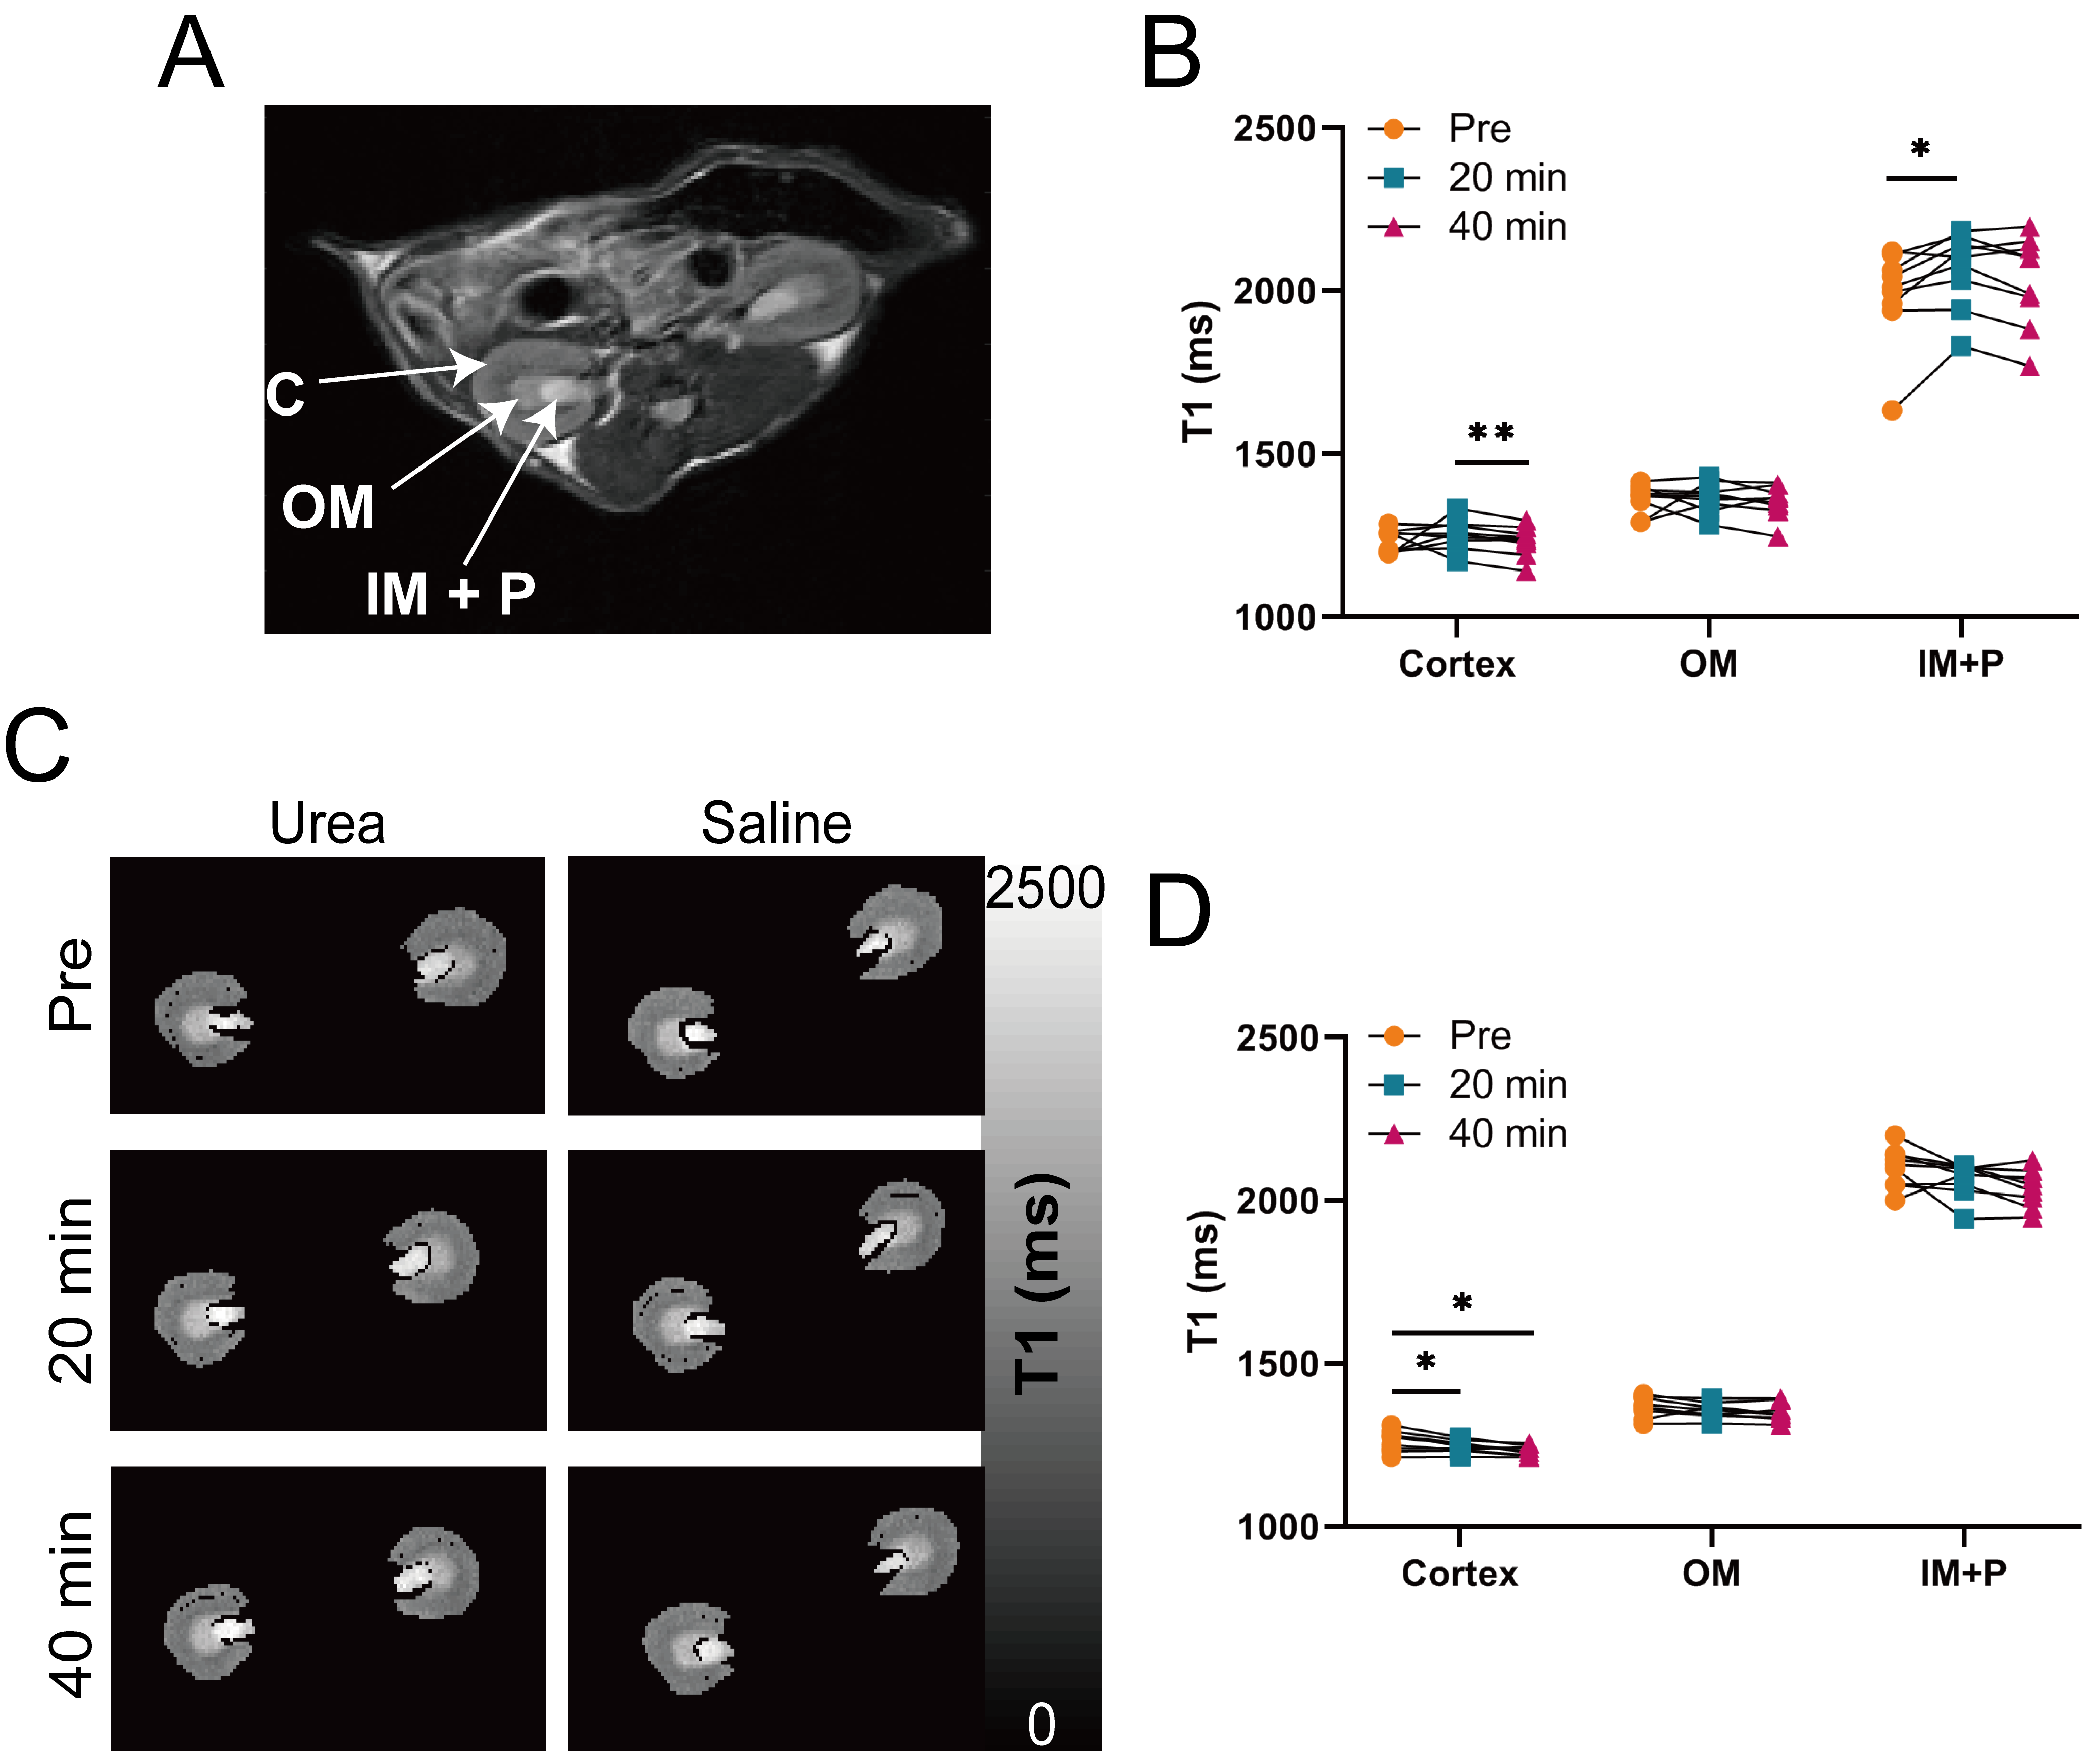
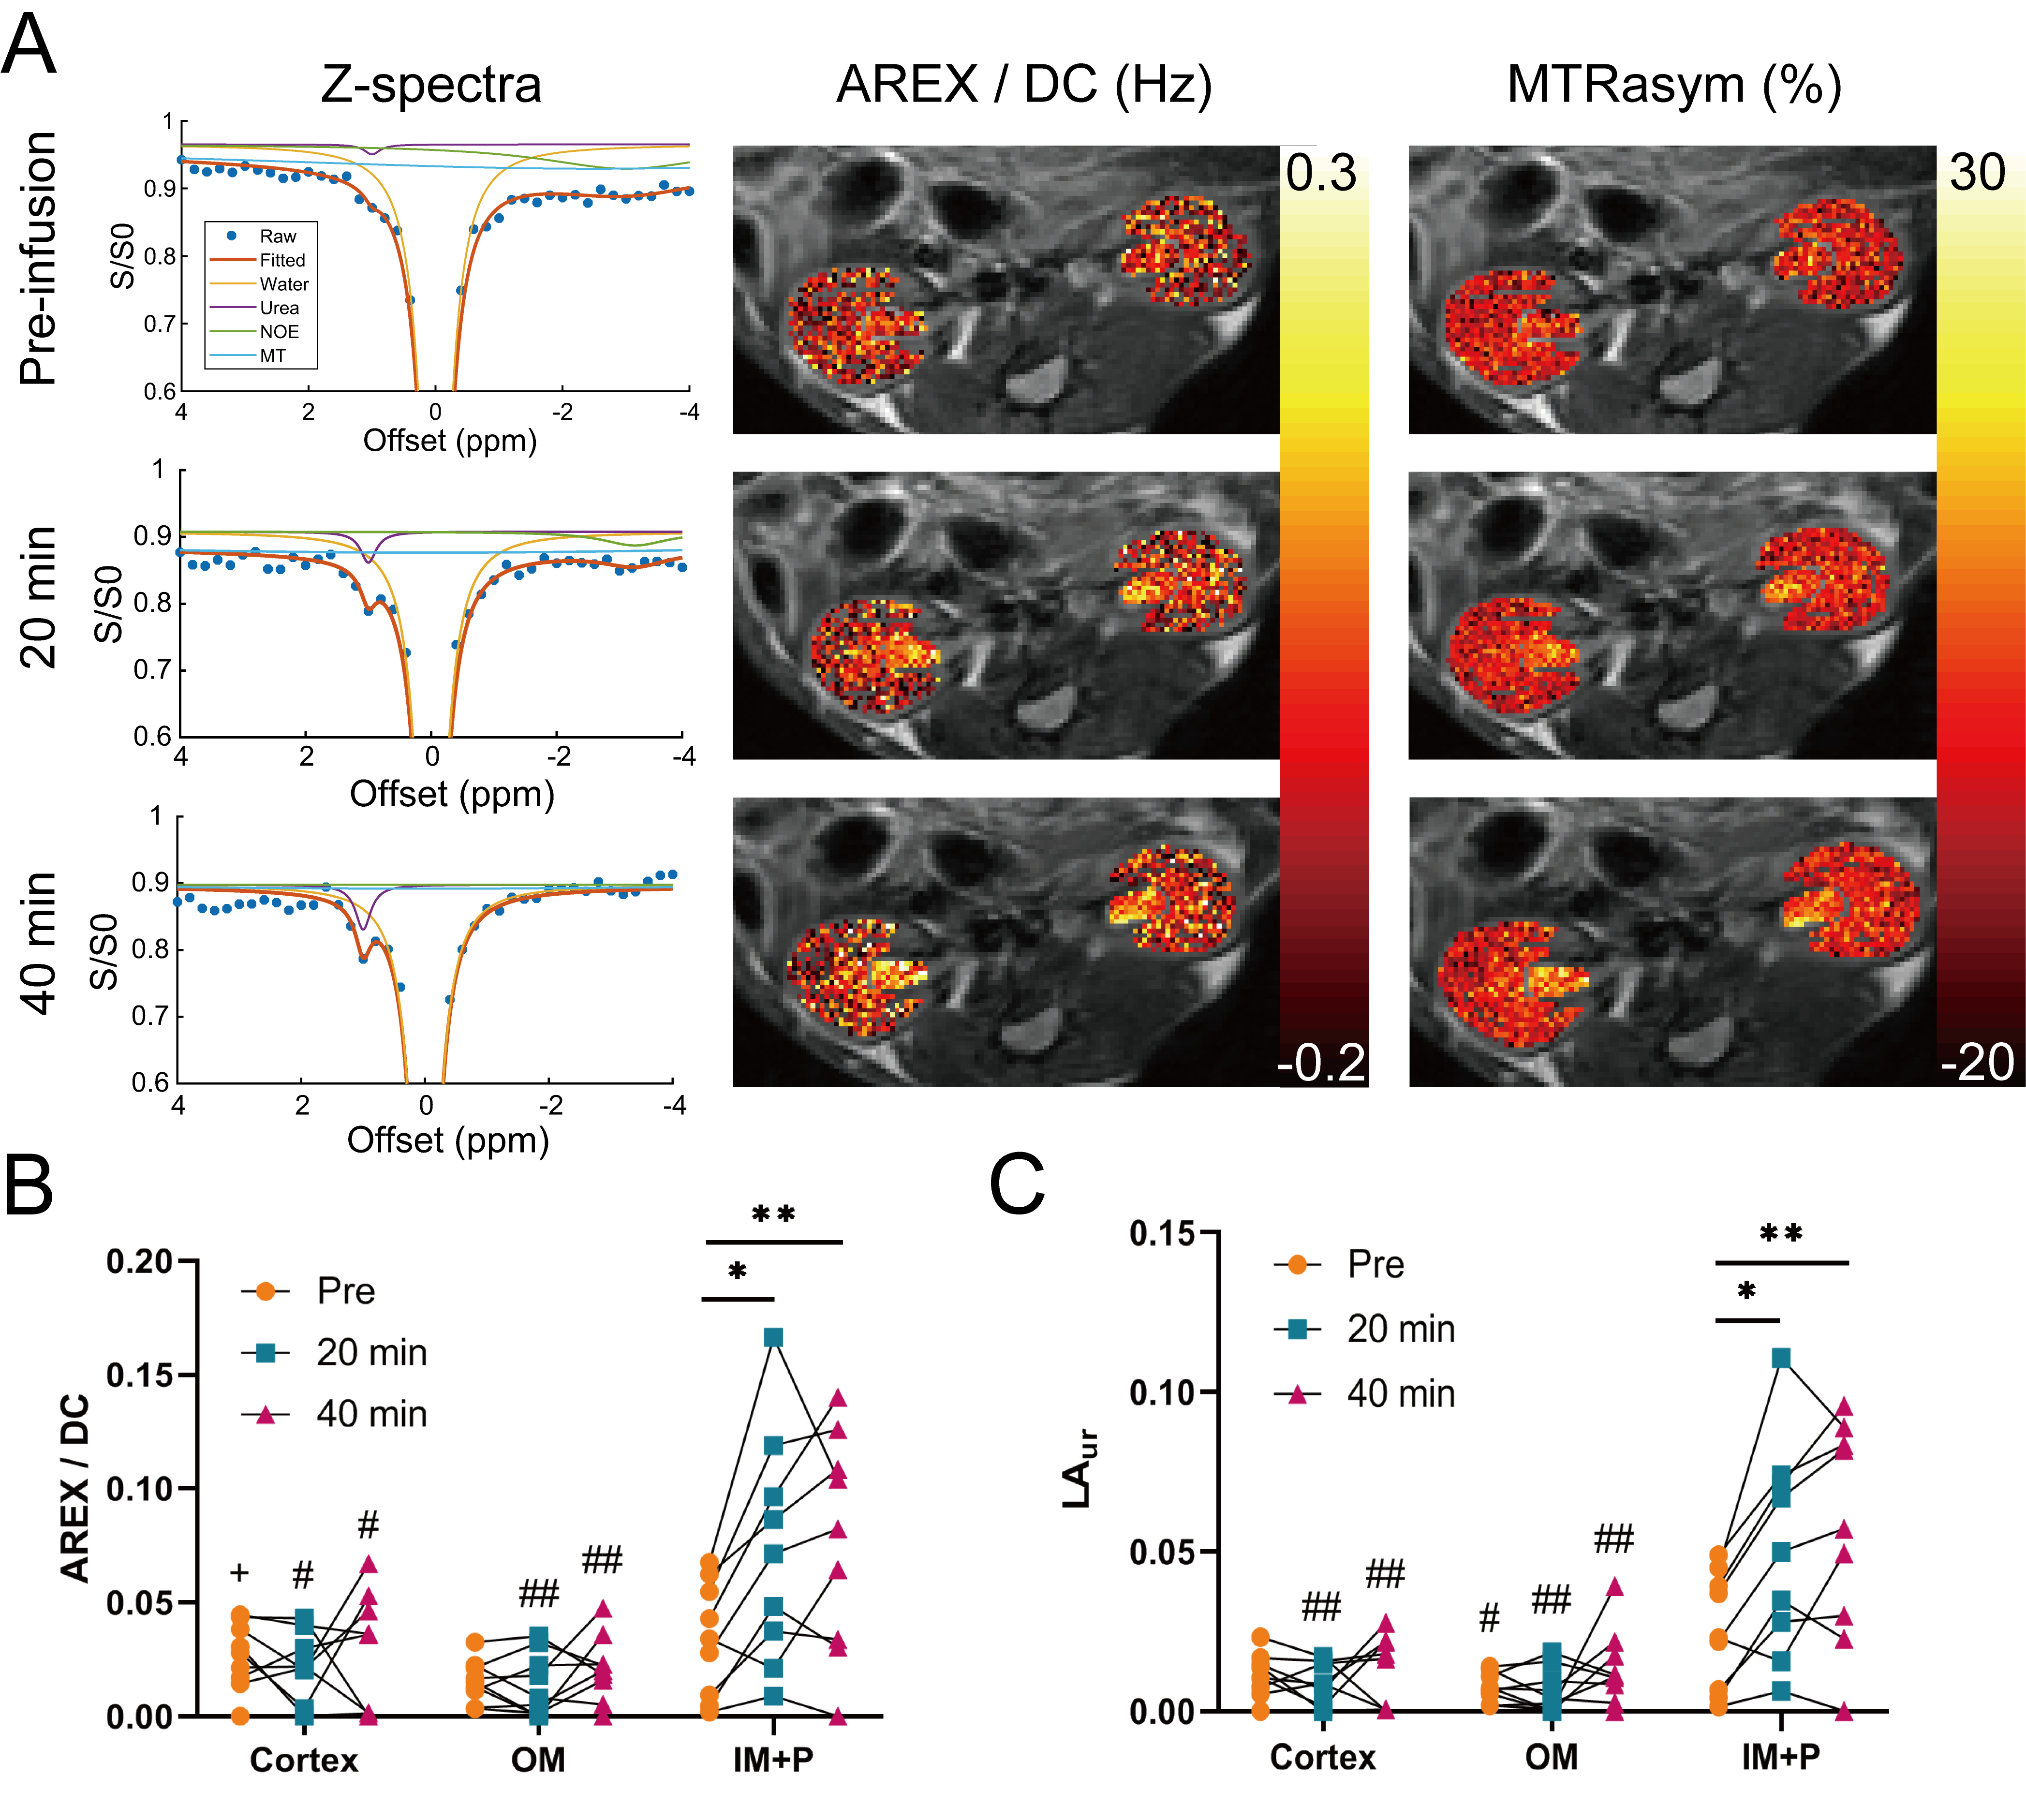
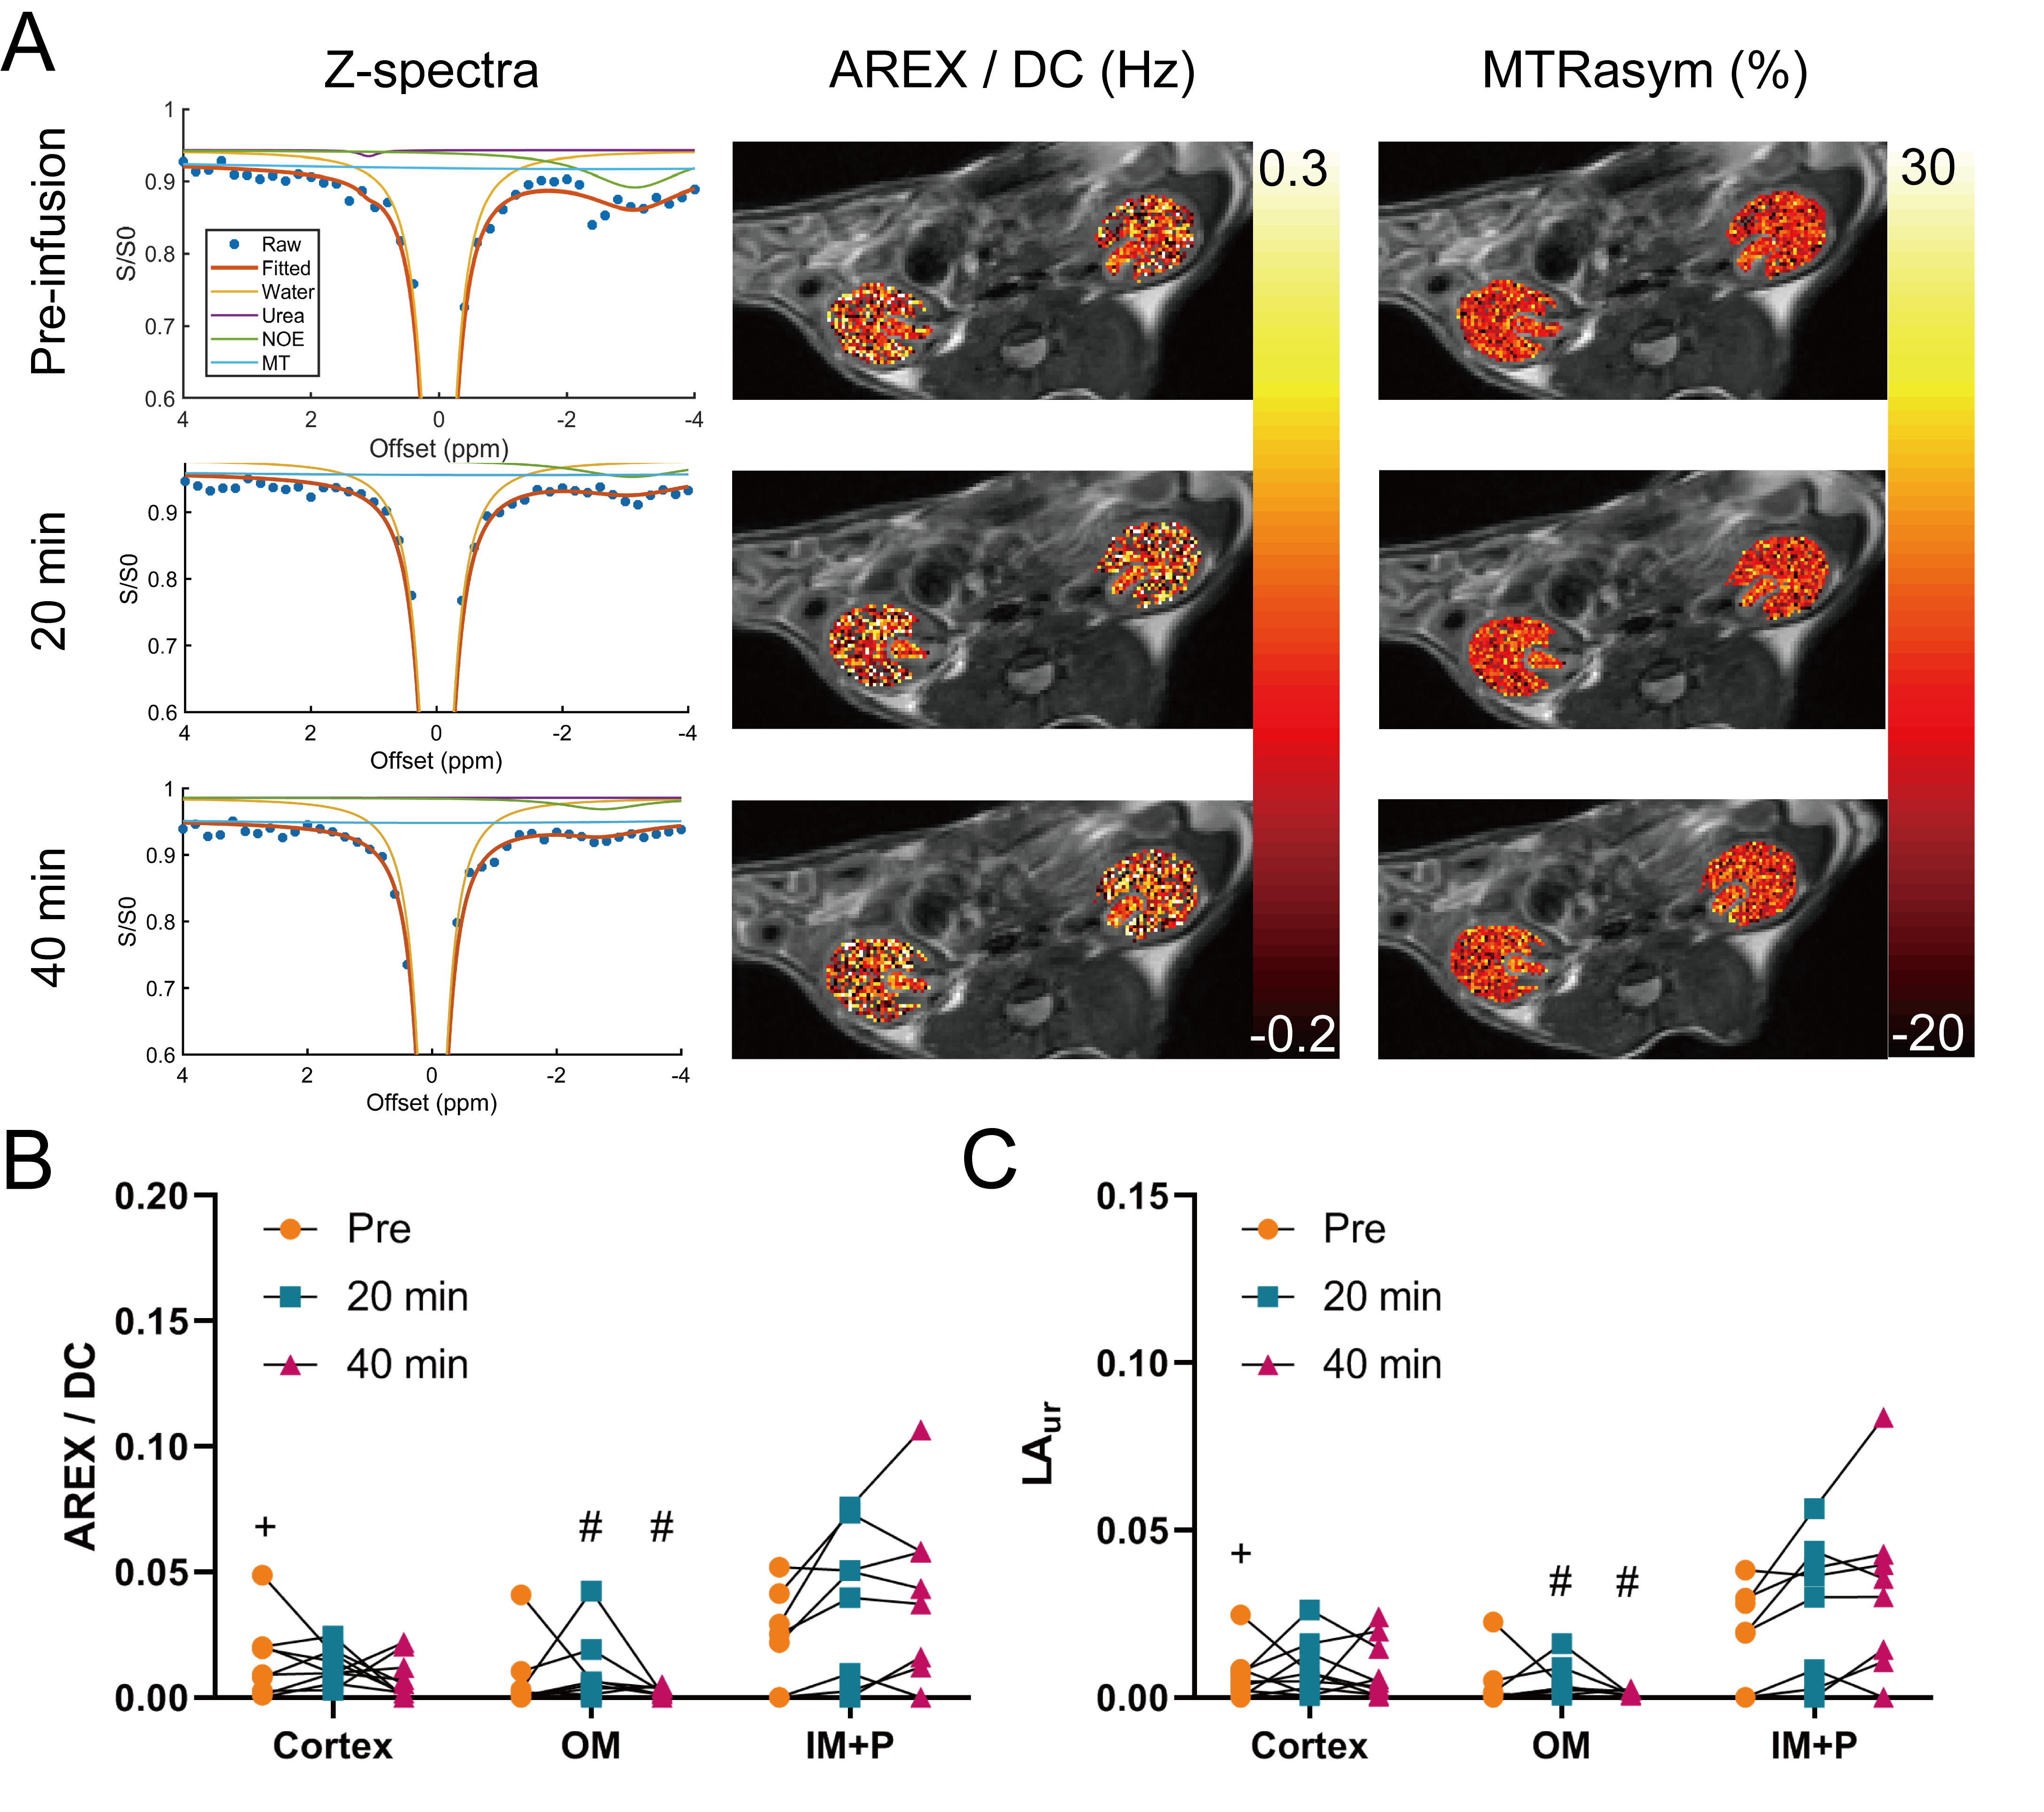
Phantoms with 500 mM urea and different concentrations of gadolinium were scanned at 7T (PharmaScan, Bruker, Ettlingen, Germany). A T1 map (15 inversion times (TI) from 100 to 8000 ms, TR/TE = 4.3/2.1 ms, matrix = 192 × 192, FOV = 3.5 cm × 3.5 cm), an unsaturated image for normalizing Z-spectra (TR/TE = 6.4/3.1 ms, matrix = 192 × 192), and CEST-weighted Z-spectra images (70 Gaussian pulses, B1 = 0.6 µT, pulse duration = 50 ms, duty cycle = 50%, total sat time = 7 sec, 61 offset frequencies from -50 to 50 ppm) were acquired. Two-pool Lorentzian fitting (water and urea) was performed for analyzing urea CEST contrast (both Lorentzian amplitude and AREX) after B0 correction.3 For animal experiments, nine 8 – 12 week-old male C57BL/6J mice were scanned twice, once with the injection of urea (i.p. 150 µL, 2M) and the other with saline injection (i.p. 150 µL). In each mouse, a T2-weighted image (RARE; TR/TE = 2500/52 ms, NA = 2, slice thickness = 2 mm, matrix = 256 × 256, FOV = 3.5 cm × 3.5 cm), a T1 map, an unsaturated image, and CEST-weighted images (same parameters as phantom experiments) were acquired before injection, and 20 and 40 minutes post-injection. The cortex, outer medulla (OM) and inner medulla and papilla (IM+P) were segmented on T2-weighted images. Averaged Z-spectra from each kidney region were analyzed through four-pool (water, urea, semi-solid macromolecules, NOE) Lorentzian fitting. The peak amplitude of the Lorentzian function representing the urea pool (LAur) was used as a non-T1-corrected CEST contrast. AREX was measured via the inverse Z-spectrum analysis with T1-normalization as previously described.4 Maps of AREX normalized by the duty cycle of the saturation pulse (AREX/DC) and MTR asymmetry (MTRasym) from B0-corrected non-fitted data were superimposed on the corresponding T2-weighted image. All mice were euthanized immediately after the second scan (n = 5 for saline scan and n = 4 for urea scan), kidneys were homogenized and total urea content was determined by assay (QuantiChrom Urea Assay Kit, BioAssay Systems, Hayward, CA).Results
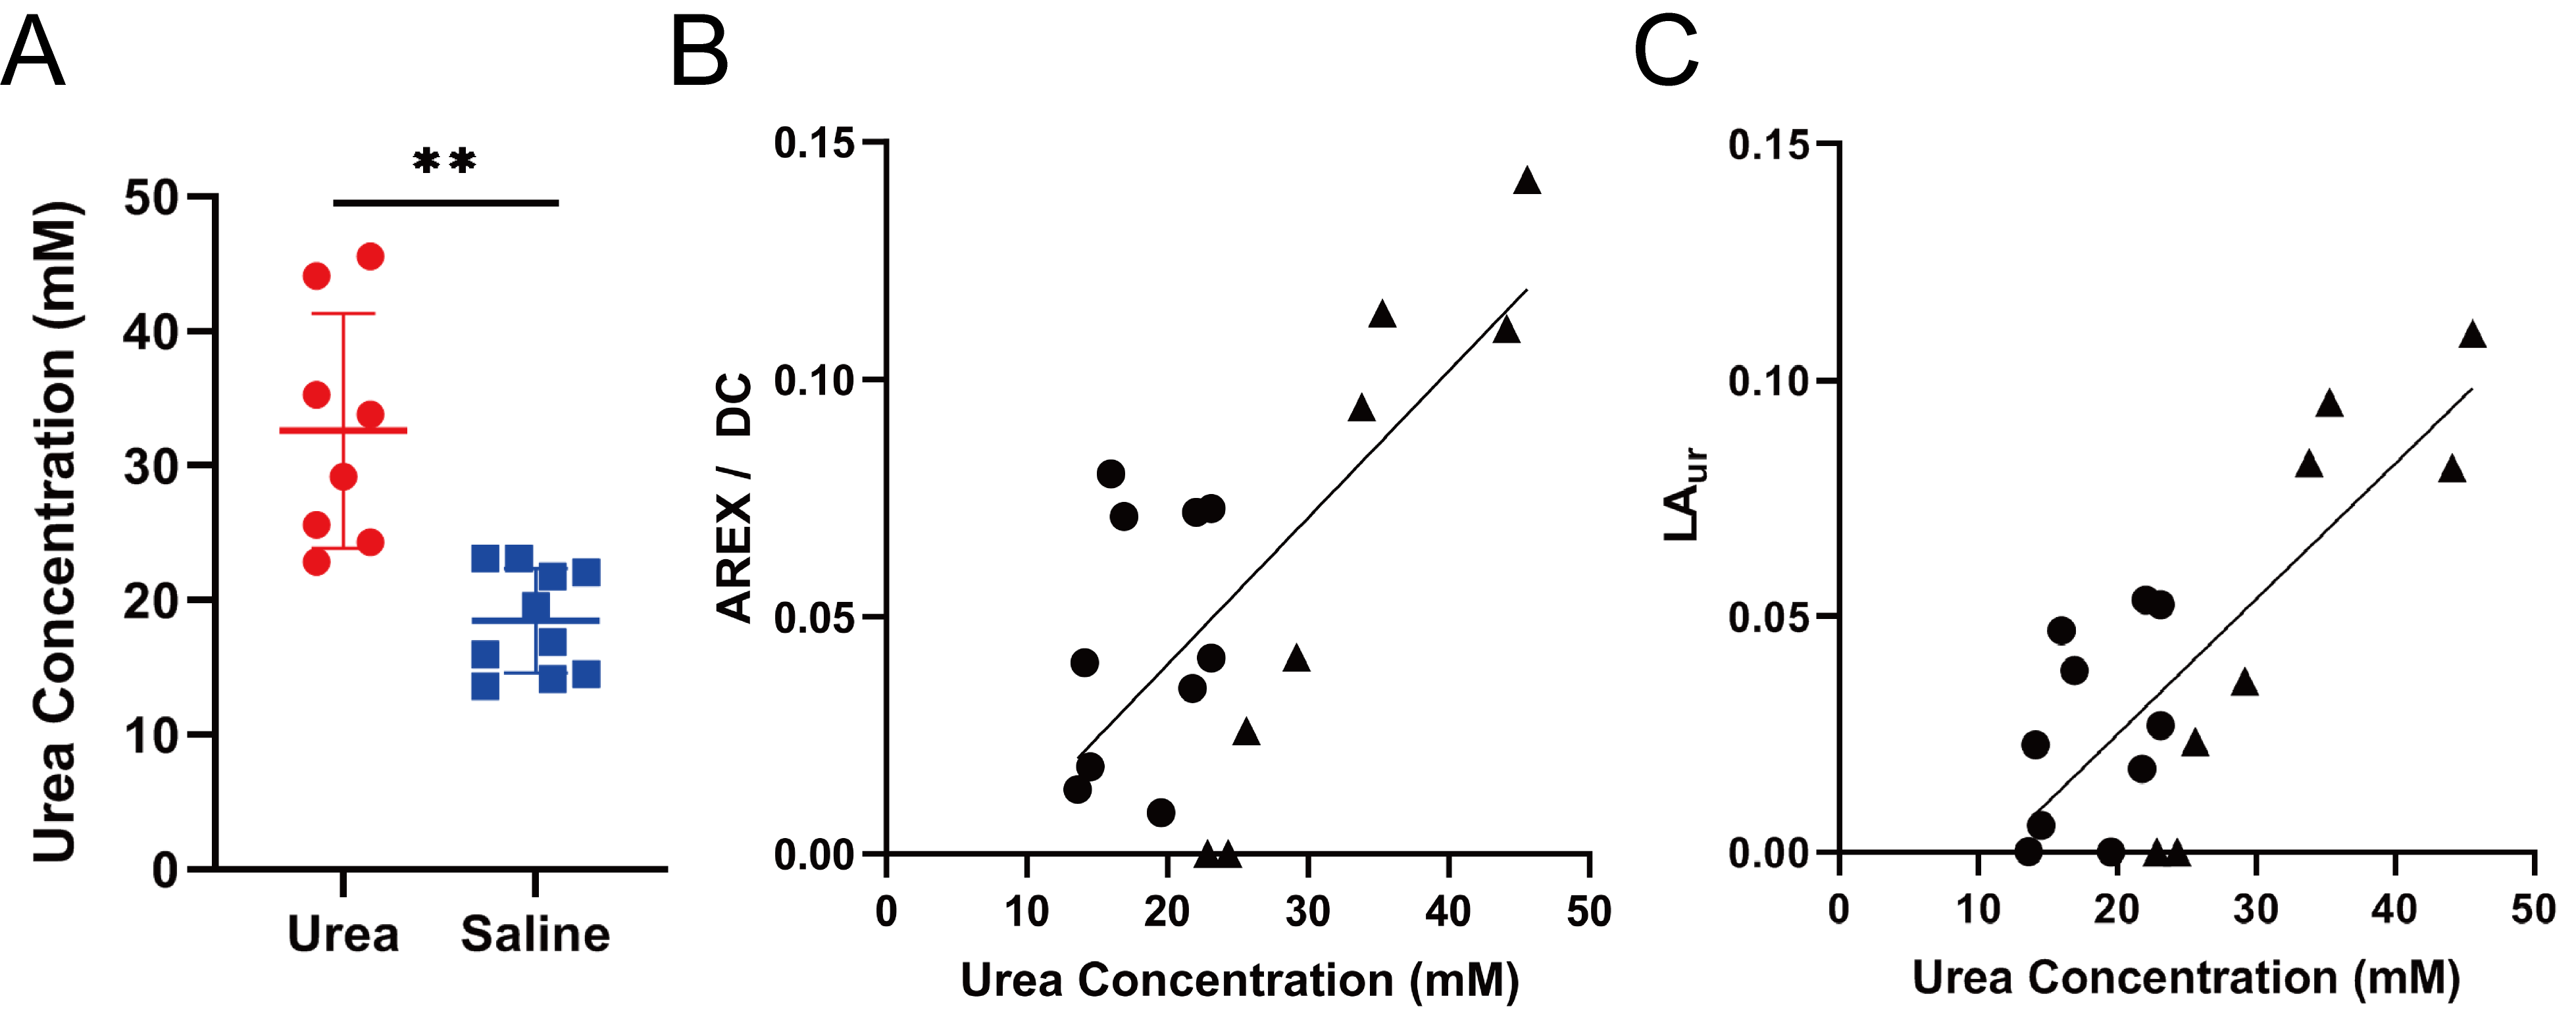
In phantoms the Lorentzian amplitude of the urea pool increased linearly with T1, while AREX remained constant over the range of T1 times tested (Figure 1). In vivo T1 times varied substantially between kidney regions (cortex = 1234±37 ms, OM = 1362±45 ms IM+P = 1987±146 ms, P < 0.0001 for all pair-wise comparisons; Figure 2). While increased CEST contrast in the IM+P following injection of urea is observed in Lorentzian-fit Z-spectra, AREX/DC maps, and MTRasym maps shown in Figure 3, no significant changes were observed in other regions. Saline induced no changes in either AREX and LAur across all regions, while IM+P contrasts remained consistently higher than other kidney regions across time points and in agreement with baseline values for urea injection scans (Figure 4). Urea assay of the kidney homogenate showed significantly higher urea concentration (P = 0.002) from the kidneys of mice infused with urea (32.6±8.7 mM) than the saline-infused group (18.5±3.9 mM; Figure 5A). Both AREX (R2 = 0.4908, P = 0.0012) and LAur values (R2 = 0.6189, P = 0.0001) from the IM+P correlated with underlying urea concentrations in the kidney (Figure 5B, C).Discussion
The combination of dudeCEST and AREX quantification demonstrated contrast enhancement that is specific to the IM+P in healthy mice, reflecting the urea recycling action of the inner medullary collecting duct as reported by prior hyperpolarized 13C MRI studies.5,6 In parallel removal of T1 bias from CEST contrast using AREX correction was shown in phantoms and between kidney regions with variable T1 times. Importantly, in the presence of tubular dysfunction higher urea content in the cortex and OM are expected alongside pH changes that will impact exchange rates.7,8 The combination of these sequelae to a loss of urea homeostasis may result in elevated dudeCEST contrast in kidney regions that demonstrate minimal AREX signal when healthy. Further investigations with distinct pre-clinical models of tubular dysfunction or kidney injury are needed to evaluate the sensitivity and specificity of this contrast mechanism for early and quantitative assessment of tubular dysfunction.Conclusion
dudeCEST reveals the urea recycling process in the inner medulla and papilla. CEST contrast analysis via AREX is required for compensating different T1 values in the kidney regions.Acknowledgements
This study was supported by NIH 1R01HL28592.References
1. Weiner ID, Mitch WE, Sands JM. Urea and Ammonia Metabolism and the Control of Renal Nitrogen Excretion. Clin J Am Soc Nephrol. 2015;10:1444-1458.
2. Shin SH, Wendland MF, Zhang B, et al. Noninvasive imaging of renal urea handling by CEST-MRI. Magn Reson Med. 2019, doi: 10.1002/mrm.27968.
3. Deshmane A, Zaiss M, Lindig T, et al. 3D gradient echo snapshot CEST MRI with low power saturation for human studies at 3T. Magn Reson Med. 2019;81:2412-2423.
4. Zaiss M, Xu J, Goerke S, et al. Inverse Z-spectrum analysis for spillover-, MT-, and T1-corrected steady-state pulsed CEST-MRI — application to pH-weighted MRI of acute stroke. NMR Biomed. 2014;27:240-252.
5. von Morze C, Bok RA, Sands JM, et al., Monitoring urea transport in rat kidney in vivo using hyperpolarized 13C magnetic resonance imaging. Am J Physiol Renal Physiol. 2012;302:F1658-F1662.
6. Reed GD, von Morze C, Verkman AS, et al. Imaging renal urea handling in rats at millimeter resolution using hyperpolarized magnetic resonance relaxometry. Tomography. 2016;2:125-137.
7. Longo DL, Dastru W, Digilio G, et al., Iopamidol as a responsive MRI-chemical exchange saturation transfer contrast agent for pH mapping of kidneys: In vivo studies in mice at 7T. Magn Reson Med. 2011;65(1):202-211.
8. Wu Y, Zhou IY, Igarashi T, et al. A generalized ratiometric chemical exchange saturation transfer (CEST) MRI approach for mapping renal pH using Iopamidol. Magn Reson Med. 2018;79:1553-1558.
Figures