0942
MRI Assessment of Renal Tubular Volume Fraction with an IVIM-NNLS Approach Under Increased Tubular Pressure
Joao Santos Periquito1, Kathleen Cantow2, Thomas Gladytz3, Bert Flemming2, Dirk Grosenick3, Erdmann Seeliger2, Thoralf Niendorf1, and Andreas Pohlmann1
1Max Delbrueck Center for Molecular Medicine, Berlin, Germany, 2Institute for Vegetative Physiology, Charité – Universitaetsmedizin Berlin, Berlin, Germany, 3Physikalisch-Technische Bundesanstalt (PTB), Berlin, Germany
1Max Delbrueck Center for Molecular Medicine, Berlin, Germany, 2Institute for Vegetative Physiology, Charité – Universitaetsmedizin Berlin, Berlin, Germany, 3Physikalisch-Technische Bundesanstalt (PTB), Berlin, Germany
Synopsis
The measurement of tubular volume fraction changes in the kidney may be valuable as a confounder of T2*-derived tissue oxygenation and as a potential biomarker. Diffusion weighted imaging provides information about in-vivo water mobility which can be linked to three sources: tissue water diffusion, blood perfusion within intrarenal microvasculature, and tubular fluid. In this work we explore the feasibility of assessing tubular volume fraction changes using the non-negative least squares (NNLS) approach under different physiological conditions.
Introduction
Renal tissue hypoxia is considered to be an important factor in the development of numerous acute and chronic kidney diseases. Blood oxygenation sensitized MRI can provide quantitative information about changes in renal blood oxygenation via mapping of T2*. Simultaneous MRI and invasive physiological measurements in rat kidneys demonstrated that changes in renal T2* do not accurately reflect renal tissue oxygenation under pathophysiological conditions.1,2 Confounding factors that should be taken into account for the interpretation of renal T2* include renal blood volume fraction and tubular volume fraction.1,2 Tubuli represent a unique structural and functional component of renal parenchyma, whose volume fraction may rapidly change, e.g., due to alterations in filtration or tubular outflow.3,4 Diffusion-weighted imaging (DWI) provides a method for in-vivo evaluation of water mobility. In the kidneys intravoxel incoherent water motion (IVIM)5 may be linked to three different sources: i) renal tissue water diffusion, ii) blood perfusion within intrarenal microvasculature and iii) fluid in the tubules.6,7 The latter provides means to probe for changes in the tubular volume fraction. Recognizing this opportunity this examines the feasibility of assessing tubular volume fraction changes using the non-negative least squares (NNLS) analysis of DWI data obtained for different physiological conditions.8,9 This approach does not require starting values or a fixed model coefficients which is common practice in order to increase fit stability and improve the sensitivity of common IVIM models.Methods
In-vivo experiments with three adult male Wistar rats were performed on a 9.4T small animal-scanner (Bruker Biospec, Ettlingen, Germany). To temporarily increase tubular volume fraction 30mmHg water pressure was applied to the urether: a saline-filled container connected to the ureter via a catheter was elevated by 41 cm above the level of the kidney (baseline level). T2 and ADC maps were used to confirm the success of the challenge. We employed a diffusion-sensitized split-echo RARE method to ensure renal-DWI free of geometric distortion using b-values of: 0, 4, 7, 10, 15, 20, 30, 38, 46, 65, 100, 175, 260, 400, 525 and 700 s/mm2. To account for the non-isotropic diffusion, images of three orthogonal diffusion directions were averaged. Images were de-noised with a spatially-adaptive-non-local-means filter. ROIs were defined in the cortex (COR), outer medulla (OM) and inner medulla (IM) using semi-automated kidney segmentation10. The NNLS method8 was implemented by adapting an open-source toolbox9 and used to analyze the measured signal decay of each ROI. The NNLS analysis yields a spectrum of detected exponential components, where each peak represents a (pseudo)diffusion compartment whose volume fractions are given by the area-under-the-curve.Results
Images of a rat kidney acquired with different diffusion weightings are shown in Fig.1. The ADC and T2 maps confirmed the success of the reversible tubular pressure increase by showing a clear change during the challenge (Fig.2).NNLS revealed three components for all renal layers, at baseline as well as during increased pressure (Fig.3). At baseline these consisted of a slow component fslow= 0.56±0.10 (COR), 0.54±0.07 (OM) and 0.39±0.10 (IM), intermediate component fintermediate= 0.34±0.11 (COR), 0.36±0.06 (OM) and 0.42±0.06 (IM) and fast component ffast= 0.09±0.02 (COR), 0.10±0.02 (OM) and 0.12±0.01 (IM) (Fig.4). During increased pressure alterations in the fractions were observed in all renal layers. While the fslow (%) decreased 15.7±20.1 (COR) 5.2±3.0 (OM) and 7.9±22.1 (IM) and ffast= 4.1±23.3 (COR), 21.1±29.9 (OM) and 30.8±27.9 (IM) mostly decreased, fintermediate= 42.4±44.6 (COR), 11.1±0.78 (OM) and 13.2±12.1 (IM) increased (Fig.5).Discussion and Conclusion
This work demonstrates the feasibility of monitoring changes in the renal tubular volume fraction with DWI in conjunction with a NNLS analysis. These unbiased model-free results confirm the existence of the three exponential components in renal DWI data. The obtained fractions and their changes during increased pressure support the interpretations of slow, intermediate, and fast components as representing tissue diffusion, water movement in tubuli, and blood perfusion respectively6,7. Observed alterations during the challenge may be explained by expected changes in physiological parameters. Increased tubular pressure leads to more water in the kidney which is confirmed by the alterations in T2 and the increases in fintermediate. Probing vascular and tubular volume fractions in the kidney is important for detailing and interpreting the relations between changes in renal hemodynamics, tissue-oxygenation, vascular and tubular volume fraction under (patho)physiological conditions. This renal DWI technique requires further validation, but our novel approach is a promising refinement of the common IVIM analysis for the MRI assessment of renal tubular volume fraction.Acknowledgements
This work was supported in part by the Bundesministerium für Bildung und Forschung (BMBF, German Federal Ministry for Education and Research; grants VIP+ 03P00081, VIP+ 03P00082, VIP+ 03P00083).References
[1] Pohlmann et al., Acta Physiologica (2013) 8(2):673-689; [2] Pohlmann et al., Invest. Radiol. (2014) 49(8):547-60; [3] Niendorf et al. Acta Physiologica (2014) 213(1):19-38; [4] Knepper et al. (1977) 12(5) 313-323; [5] Le Bihan et al. Radiology (1988) 168(2):497-505; [6] van Baalen et al., Magn Reson Med. (2017) 46(1):228-239; [7] van der Bel et al., European Journal of Radiology (2017) 91(3) 168-174; [8] Lawson et al., 1974; [9] Bjarnason et al., Journal of Magnetic Resonance 206(2):200-204; [10] Pohlmann et al., Tomography (2017) 3(4):188-200;Figures

Figure 1 - Diffusion-weighted images of
a rat kidney for selected b-values: 0, 20, 45, 100 and 400 s/mm2. Image
parameters: ESP= 3.3ms, TR= 1.000ms, ETL= 48, matrix size= 96x96, FOV= 45x45mm2,
spatial resolution= 0.46x0.46x1.5mm.
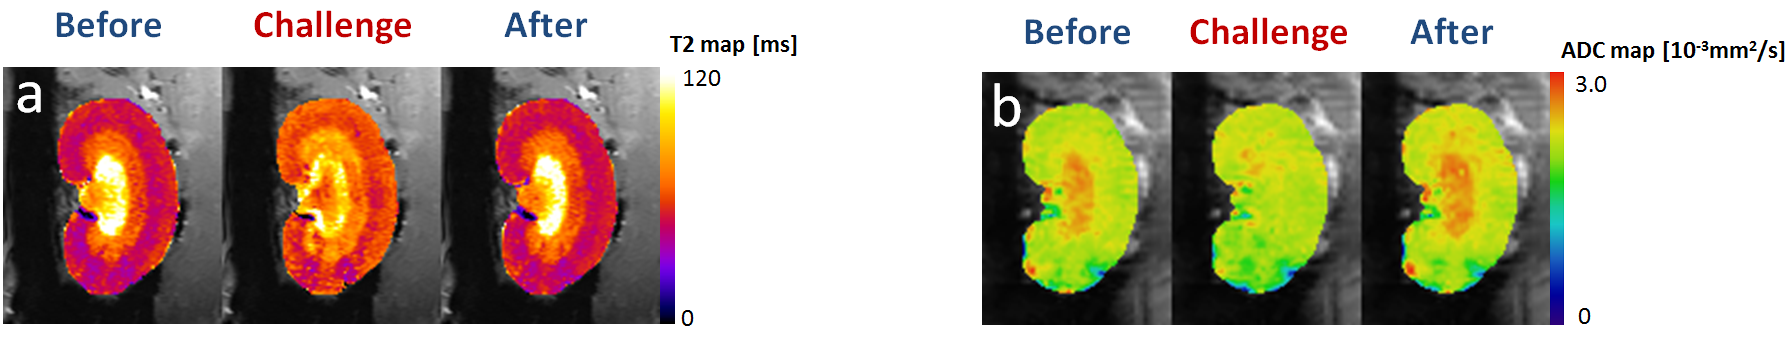
Figure 2 –
a) Renal T2 maps obtained before, during and after
increased urether pressure load. Image
parameters: TE= 6.4ms (13 echoes), ESP= 10ms, TR= 480ms, matrix size= 169x115, FOV= 38.2x48.5mm2, resolution=
0.27x0.42x1.5mm. b) ADC map obtained before, during and after increased
tubular pressure using the conventional mono-exponential fit with all the acquired
b-values.
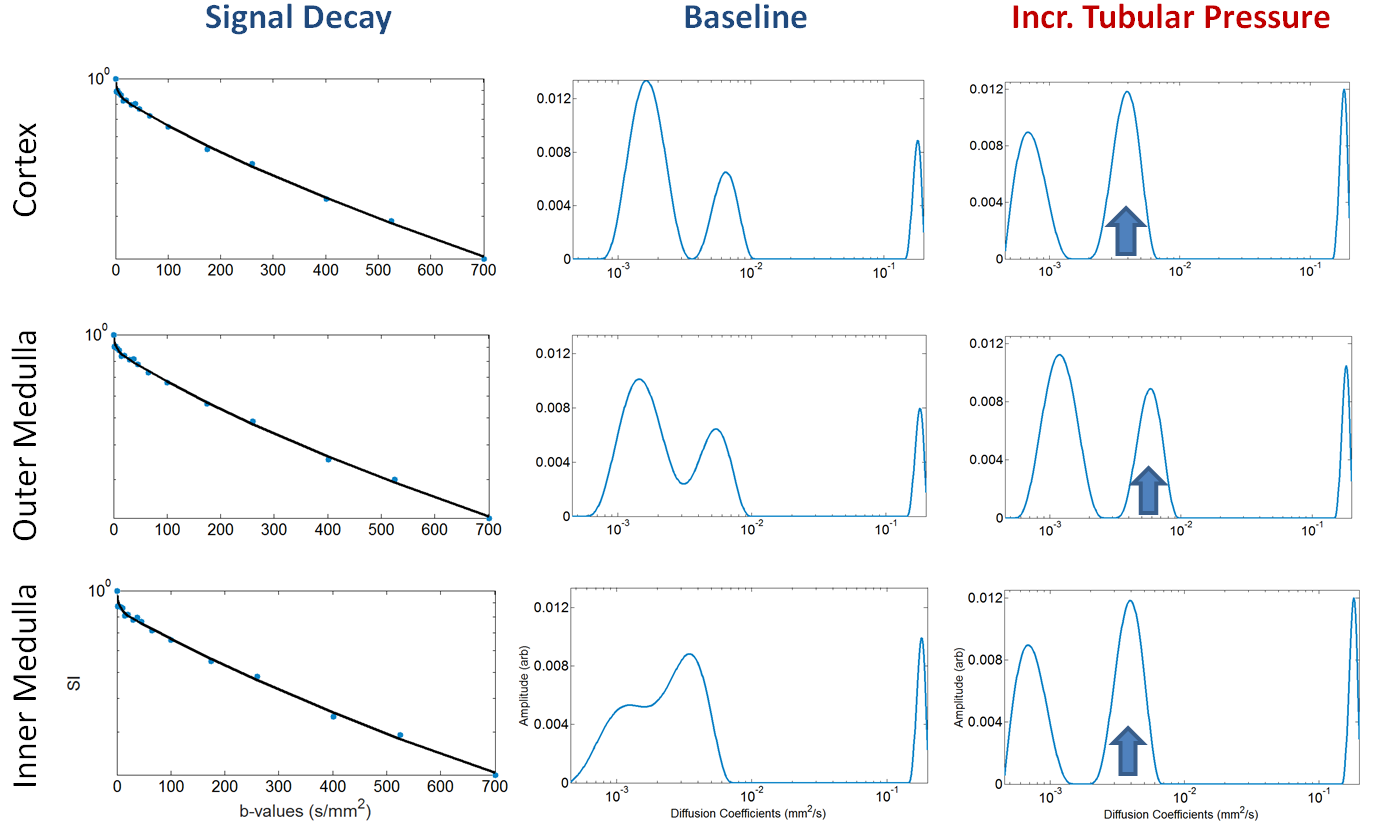
Figure 3 – NNLS Analysis results at
baseline and during increased tubular pressure for one of the three rats. The
first column shows the normalized diffusion signal decay for each renal layer: COR
(top), OM (middle) and IM (bottom). The second and third columns show the NNLS
spectrum at baseline and during increased tubular pressure, respectively. For
each renal layer the NNLS spectrum reveals a slow, intermediate and fast
compartment.
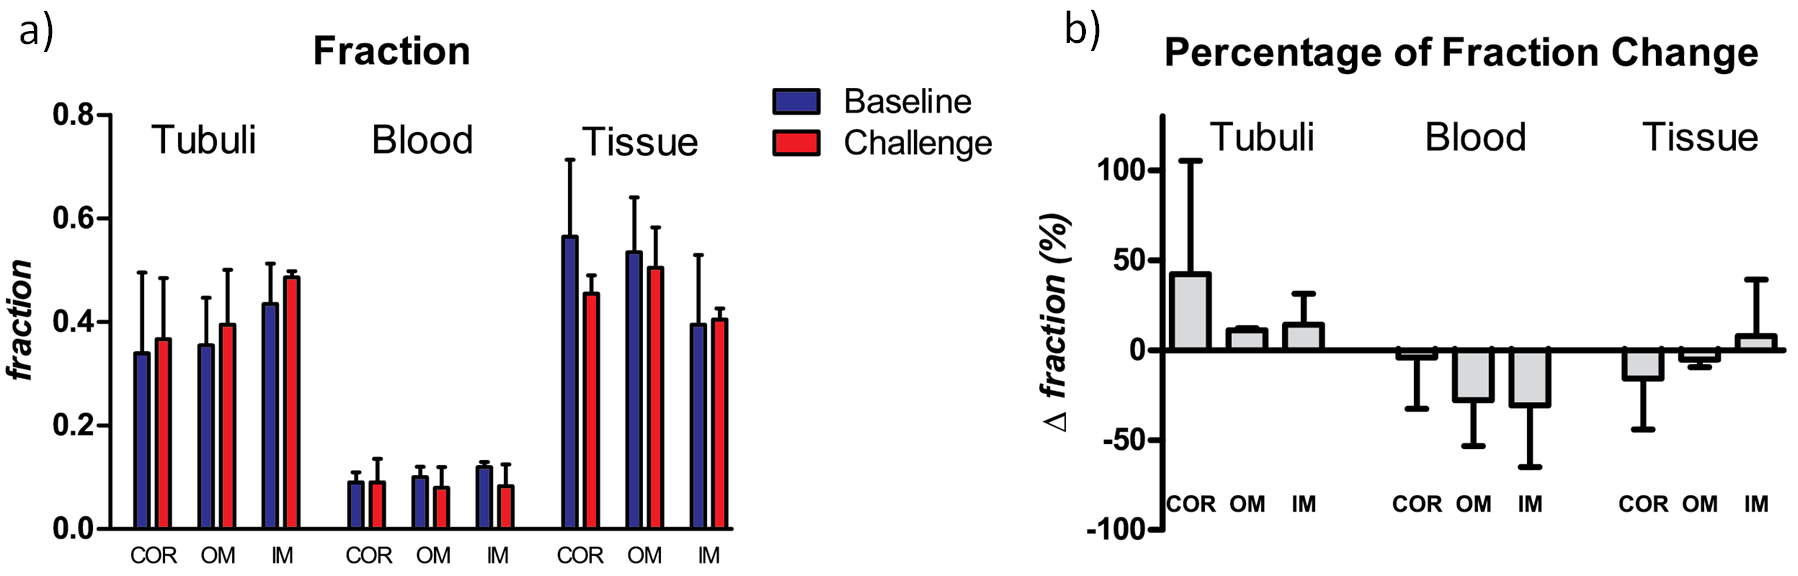
Figure 4 – a) Volume fractions
of the tubuli, blood, and tissue compartment under baseline (blue) and during increased
tubular pressure (red). b)
Percentage of volume fractions change of the tubuli, blood, and tissue
compartment during increased tubular pressure compared to baseline. Results
from 3 rats (mean, SD) are shown for the renal cortex (COR), outer medulla (OM)
and inner medulla (IM).