0941
Single Nephron Glomerular Filtration and Macromolecular Dynamics in Perfused Kidneys using MRI1Radiology, Washington University in St. Louis, St. Louis, MO, United States, 2Biomedical Engineering, Arizona State University, Tempe, AZ, United States, 3Pediatrics, University of Virginia, Charlottesville, VA, United States, 4Radiology, Washington University in St. Louis, Saint Louis, MO, United States
Synopsis
In this work, we use contrast agents cationic ferritin and gadolinium-DTPA (Gd-DTPA) to visualize dynamics of macromolecules and freely filtering particles in individual nephrons throughout entire perfused rat kidneys. Further, we also look at dynamics in kidneys that received a vasoconstriction agent, angiotension II (AngII). Voxel time courses were fitted with a bi-exponential model for each experiment (Experiment I, CF infusion and Experiment II, Gd-DTPA bolus). From fitting we assess CF uptake rates and measure single nephron glomerular filtration rate (snGFR). CF uptake rates and values of snGFR were mapped spatially and observed to be heterogeneously distributed throughout the kidney.
Introduction
The kidney serves a primary role in maintaining osmostic homeostasis, blood pressure, and metabolite concentrations. Clinical tools to assess kidney function are insensitive to early stages of kidney disease(17). Nephron endowment and function is heterogeneous within and between individuals(9). Conventional tools can probe function in individual nephrons, have revealed functional heterogeneity in small subset of nephrons within the kidney but not in the whole kidney (8, 12, 18). Here we demonstrate MRI to measure and map macromolecular filtration and single nephron glomerular filtration rates (snGFR) in the intact, perfused rat kidney, under normal conditions and in a kidney receiving the vasoconstrictor angiotension II (AngII). This is the first report of whole-kidney measurements of renal physiology mapped to individual nephrons.Methods
Male Sprague-Dawley rats (n=4) were anesthetized with ketamine/xylazine for terminal surgery. Procedure to isolate the right kidney was adapted from (1), and using the organ preservative solution Lifor(14) to maintain organ function during transportation (on ice) to MRI. A custom holder and radiofrequency coil were constructed. To mimic physiological conditions, temperature was maintained at 37oC; a cell-free blood substitute of Krebs-Ringer solution mixed with Fraction V BSA (5.5g/100mL) and 95/5% O2/CO2 was bubbled into the solution. Perfusion was 6 mL/min throughout the experiment (15, 16).We used two different contrast agents to probe individual glomeruli. Experiment I: Cationic ferritin (CF) visualized the dynamics of a large particle that does not freely filter through the glomerulus but binds to the glomerular basement membrane and is detectable by MRI(2, 3). CF was mixed with the perfusate solution (0.033mg/mL) and 60mL was perfused into the kidney. Experiment II: A bolus of Gd-DTPA, 6.25 uM, mixed with the perfusate solution was injected into the line. Gd-DTPA was used to image the dynamics of a freely filtering particle through the individual glomerulus(5, 6). In a separate experiment, hemodynamics were modulated with the vasoconstrictor, ANGII (10ng/min throughout)(13).
Imaging was performed on a Bruker 7T/30 MRI. A T2*-weighted(T2*-w) 3D gradient recalled echo (GRE) sequence was used for Experiment I with TE/TR = 12.6/45, ϴflip=45, resolution = 104.2x184.9x220.0 um3, and a temporal resolution of 2.83 minutes between scans with a total of 7 scans. A T1-weighted(T1-w) 3D GRE sequence was used for Experiment II with TE/TR = 3.23/22, ϴflip =45, resolution = 104.2x184.9x220.0 um3, and 1.38 minutes between scans with a total of 11 scans acquired.
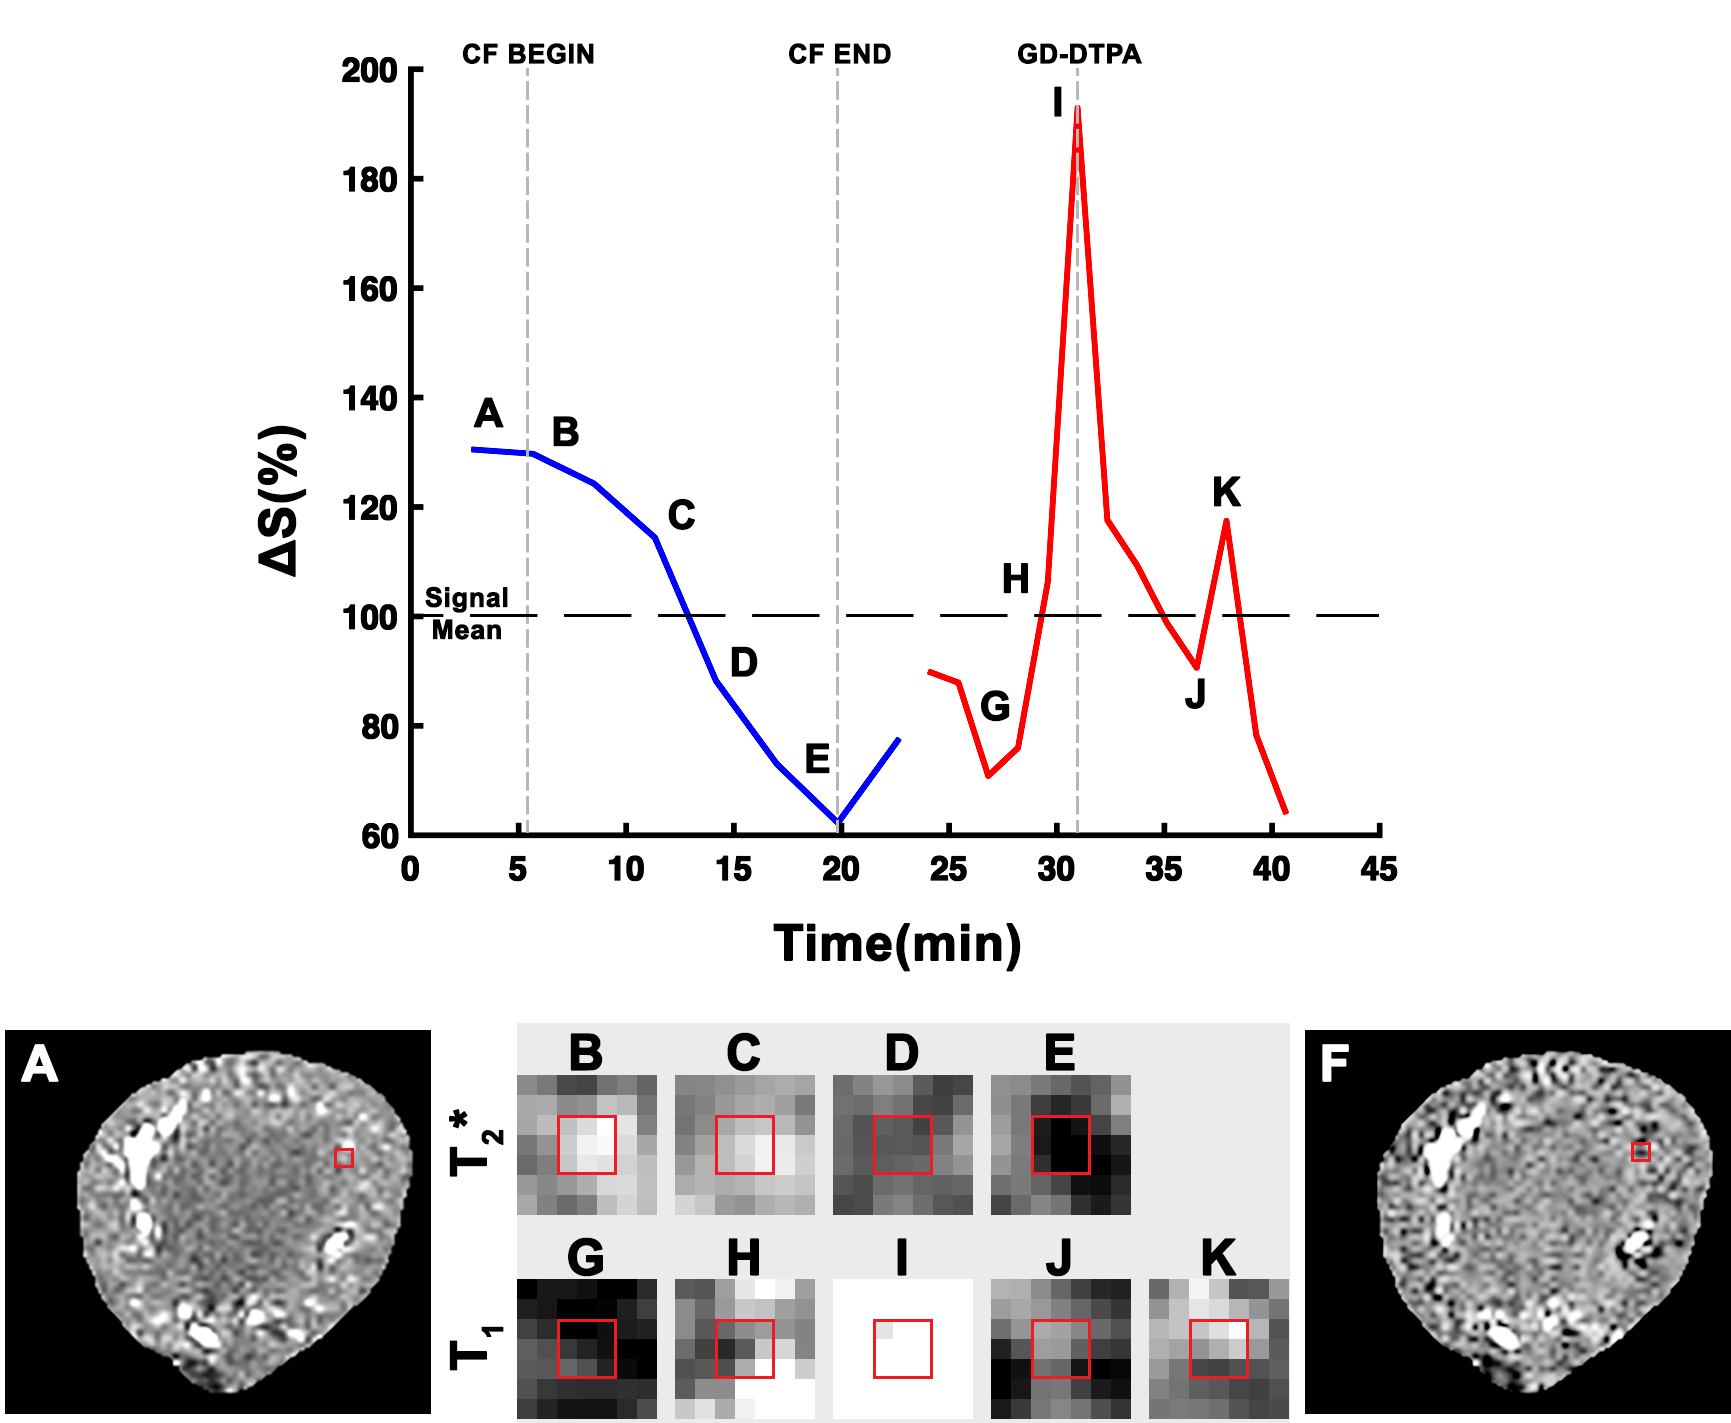
Post processing and analysis were performed using AFNI and Matlab. Images were first co-registered. Voxel signal in each experiment was normalized to its mean and time courses were modeled with a bi-exponential function(4); Sn(t)=Y0+M⋅t+k⋅(e−α1(t−t0) -e−α2(t−t0)). Here, Y0=Y-Intercept, M=Linear Factor, k = Scale Constant, t0 = Time Offset, α1 = Phase II Rate, α2 = Phase I Rate. In experiment I, fitting was performed over the entire time course (Phase I: CF infusion, Phase II: Signal after CF, in voxels with identified glomeruli). In experiment II, we fitted from the peak of the Gd-DTPA bolus (Phase I) until ~6 minutes post bolus at the second peak due to the concentration of filtered Gd-DTPA in the distal tubule (Phase II). Calculating snGFR - Using α1 from Experiment II, we first multiplied α1 with the voxel volume. Next, we divided by a constant to represent the volume fraction occupied by mean tubule diameter (10) as a scale factor.
Results
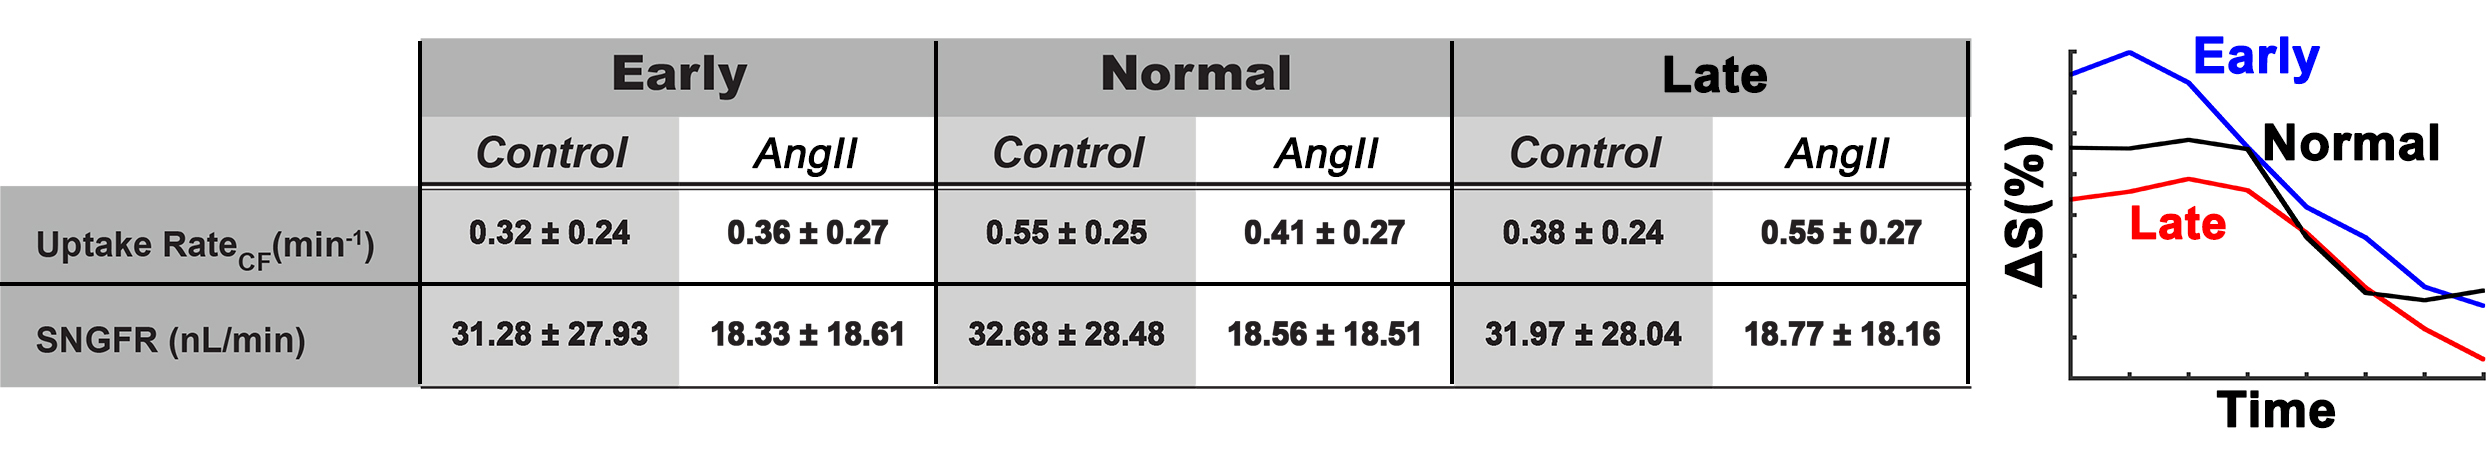
Experiment I - T2* weighted MRI during CF infusion into the kidney resolved glomeruli in cortex. Glomerular voxels decreased in signal with CF infusion (Figure 1,A-E). Experiment II - T1-weighted MRI after the bolus of Gd-DTPA showed a ~100% spike in normalized signal at the time Gd-DTPA entered the kidney (t~31min), followed by a second peak at t~37min in the voxels containing glomeruli (Figure 1, F-J). These were consistent with an initial delivery of Gd-DTPA to the vasculature and proximal tubule, movement of filtered Gd-DTPA through the proximal tubule, then a later rise from concentrated Gd-DTPA in the distal convoluted tubule. Voxels containing glomeruli were separated into 3 groups based on the shape of their time course during CF infusion: (1) a ‘Early’ time course where signal begins to decrease at t~5min, (2) a ‘Normal’ time course where signal decrease begins at t~10min and decreases rapidly, and (3) a ‘Late’ time course where the decrease in signal begins at t~10min or later and decreases slowly (Figure 2, Right). There was no significant difference in average uptake rate of CF between kidneys with (0.44±0.27 min-1) and without (0.42±0.24min-1 ) AngII. Mean snGFR was significantly lower (18.6±18.4 nL/min ) after AngII compared to no AngII (32.0±28.1 nL/min).Discussion
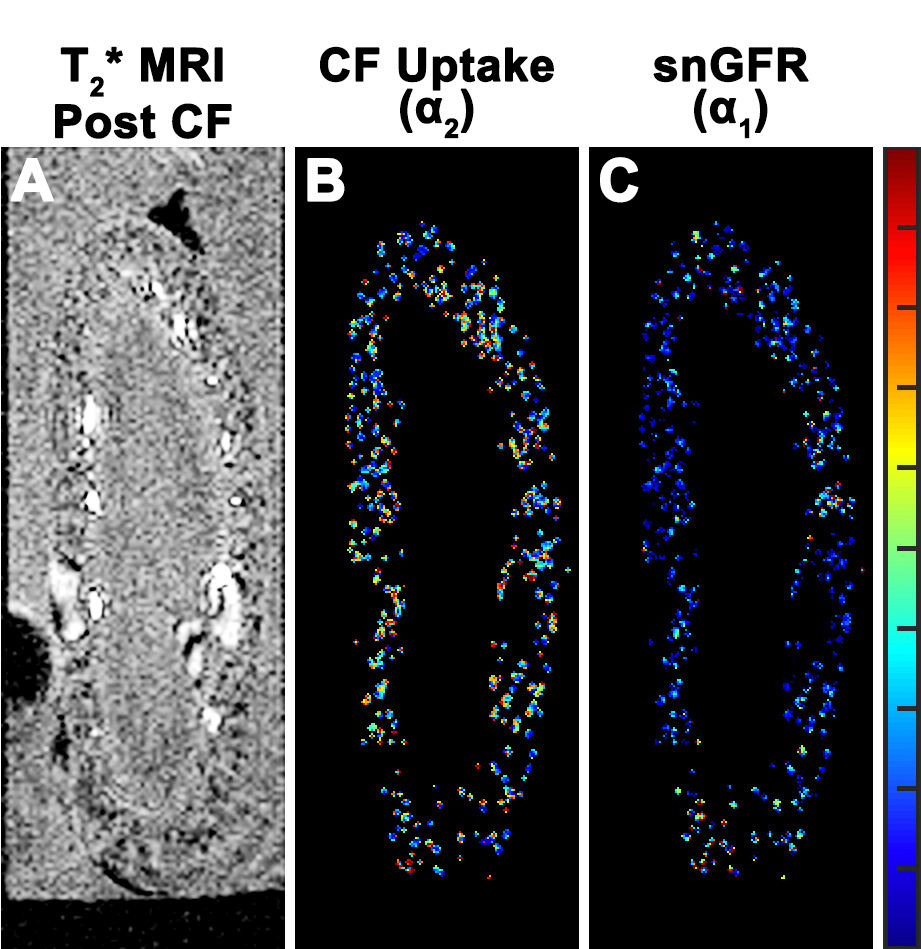
Contrast enhanced MRI combined with a custom imaging setup enabled the visualization and measurement of snGFR and macromolecular dynamics throughout the entire kidney. Values of snGFR and CF binding rate to the GBM were spatially heterogeneous (Figure 3). Mean values of snGFR obtained with MRI were consistent with literature values(8). Future work will be aimed at direct validation(11) of MR measurements in the same kidney. Recently developed imaging protocols and improvements in hardware(7, 19) should increase temporal and spatial resolution. Perfused organ studies have been critical to understanding renal physiology. This work establishes a framework for measurements of single nephron physiology by MRI in the whole, intact kidney.Acknowledgements
We would like to thank the molecular imaging core at the University of Virginia and Jack Roy for his support with this work.References
1. AU Czogalla J, AU Schweda F, AU Loffing J. The Mouse Isolated Perfused Kidney Technique. JoVE : e54712, 2016.
2. Beeman SC, Zhang M, Gubhaju L, Wu T, Bertram JF, Frakes DH, Cherry BR, Bennett KM. Measuring glomerular number and size in perfused kidneys using MRI. Am J Physiol Renal Physiol 300: F1454–F1457, 2011.
3. Bennett KM, Zhou H, Sumner JP, Dodd SJ, Bouraoud N, Doi K, Star RA, Koretsky AP. MRI of the basement membrane using charged nanoparticles as contrast agents. Magn Reson Med 60: 564–574, 2008.
4. Bröchner-Mortensen J. A Simple Method for the Determination of Glomerular Filtration Rate. Scandinavian Journal of Clinical and Laboratory Investigation 30: 271–274, 2009.
5. Grenier N, Mendichovszky I, de Senneville BD, Roujol S, Desbarats P, Pedersen M, Wells K, Frøkiær J, Gordon I. Measurement of glomerular filtration rate with magnetic resonance imaging: principles, limitations, and expectations. Semin Nucl Med 38: 47–55, 2008.
6. Grenier N. Functional Imaging of the Kidney. In: Radiological Imaging of the Kidney, edited by Quaia E. Berlin, Heidelberg: Springer Berlin Heidelberg, 2011, p. 845–869.
7. Heidemann RM, Özsarlak Ö, Parizel PM, Michiels J, Kiefer B, Jellus V, Müller M, Breuer F, Blaimer M, Griswold MA, Jakob PM. A brief review of parallel magnetic resonance imaging. Eur Radiol 13: 2323–2337, 2003.
8. Horster M, Thurau K. Micropuncture studies on the filtration rate of single superficial and juxtamedullary glomeruli in the rat kidney. Pflüger's Archiv für die gesamte Physiologie des Menschen und der Tiere 301: 162–181, 1968.
9. Hoy WE, Douglas-Denton RN, Hughson MD, Cass A, Johnson K, Bertram JF. A stereological study of glomerular number and volume: Preliminary findings in a multiracial study of kidneys at autopsy. Kidney International 63: S31–S37, 2003.
10. Knepper MA, Danielson RA, Saidel GM, Post RS. Quantitative analysis of renal medullary anatomy in rats and rabbits. Kidney Int 12: 313–323, 1977.
11. Peti-Peterdi J, Sipos A. A high-powered view of the filtration barrier. J Am Soc Nephrol 21: 1835–1841, 2010.
12. Qian C, Yu X, Pothayee N, Dodd S, Bouraoud N, Star R, Bennett K, Koretsky A. Live nephron imaging by MRI. AJP: Renal Physiology 307: F1162–F1168, 2014.
13. Rahgozar M, Guan Z, Matthias A, Gobe GC, Endre ZH. Angiotensin II facilitates autoregulation in the perfused mouse kidney: An optimized in vitro model for assessment of renal vascular and tubular function. Nephrology (Carlton) 9: 288–296, 2004.
14. Regner KR, Nilakantan V, Ryan RP, Mortensen J, White SM, Shames BD, Roman RJ. Protective effect of Lifor solution in experimental renal ischemia-reperfusion injury. J Surg Res 164: e291–e297, 2010.
15. Rosenberger C, Rosen S, Shina A, Bernhardt W, Wiesener MS, Frei U, Eckardt K-U, Heyman SN. Hypoxia-inducible factors and tubular cell survival in isolated perfused kidneys. Kidney Int 70: 60–70, 2006.
16. Ross BD. The Isolated Perfused Rat Kidney. Clinical Science and Molecular Medicine 55: 513–521, 1978.
17. Snyder S, Pendergraph B. Detection and evaluation of chronic kidney disease. Am Fam Physician 72: 1723–1732, 2005.
18. Vallon V. Micropuncturing the nephron. Pflugers Arch - Eur J Physiol 458: 189–201, 2008.
19. van Vaals JJ, Brummer ME, Dixon WT, Tuithof HH, Engels H, Nelson RC, Gerety BM, Chezmar JL, Boer den JA. “Keyhole” method for accelerating imaging of contrast agent uptake. J Magn Reson Imaging 3: 671–675, 1993.
Figures