0939
Assessing Focal Cortical Dysplasia Using Advanced Diffusion Imaging Sequences1Institute of Science and Technology for Brain-Inspired Intelligence, Fudan University, Shanghai, China, 2Department of Neurology, Zhongshan Hospital, Fudan University, Shanghai, China, 3Human Phenome Institute, Fudan University, Shanghai, China
Synopsis
Focal cortical dysplasia (FCD) are neurodevelopmental disorders characterized by localized cortical malformation that is highly associated with the drug-resistant epilepsy. In this study, we examined the advanced diffusion MR imaging-neurite orientation dispersion and density imaging (NODDI) in the FCD mice model. The orientation dispersion index (ODI) that represents the dispersion of neurite is significantly higher in the FCD group compared with the control group which are compatible with the pathological observation. Meanwhile, no significant differences are observed in conventional DTI measurements FA and MD indicating that NODDI is more sensitive in detecting FCD lesion.
Introduction
Focal cortical dysplasia (FCD) are neurodevelopmental disorders characterized by localized cortical malformation that is highly associated with the drug-resistant epilepsy and cognitive impairments1,2. Recent advances showed FCD pathological features including cortical dyslamination and, dysmorphic neurons are caused by somatic mutations and subsequent hyperactivation of mechanistic target of rapamycin (mTOR) signaling3. In clinical routine, MRI is the most effective tool for identifying morphological features and increases the reliability of the lesion detection associated with the epileptogenic zone4,5. However, conventional structural MR images, such as T1- and T2-weighted images, fail to detect most FCD lesions as there are many so-called MRI-negative FCDs.In this study, we examined the advanced diffusion MR imaging-neurite orientation dispersion and density imaging (NODDI) in the FCD mice model to show that the addition parameters in NODDI are compatible with the intrinsic neuropathological changes and could assist in the identification of FCD lesions.
Methods
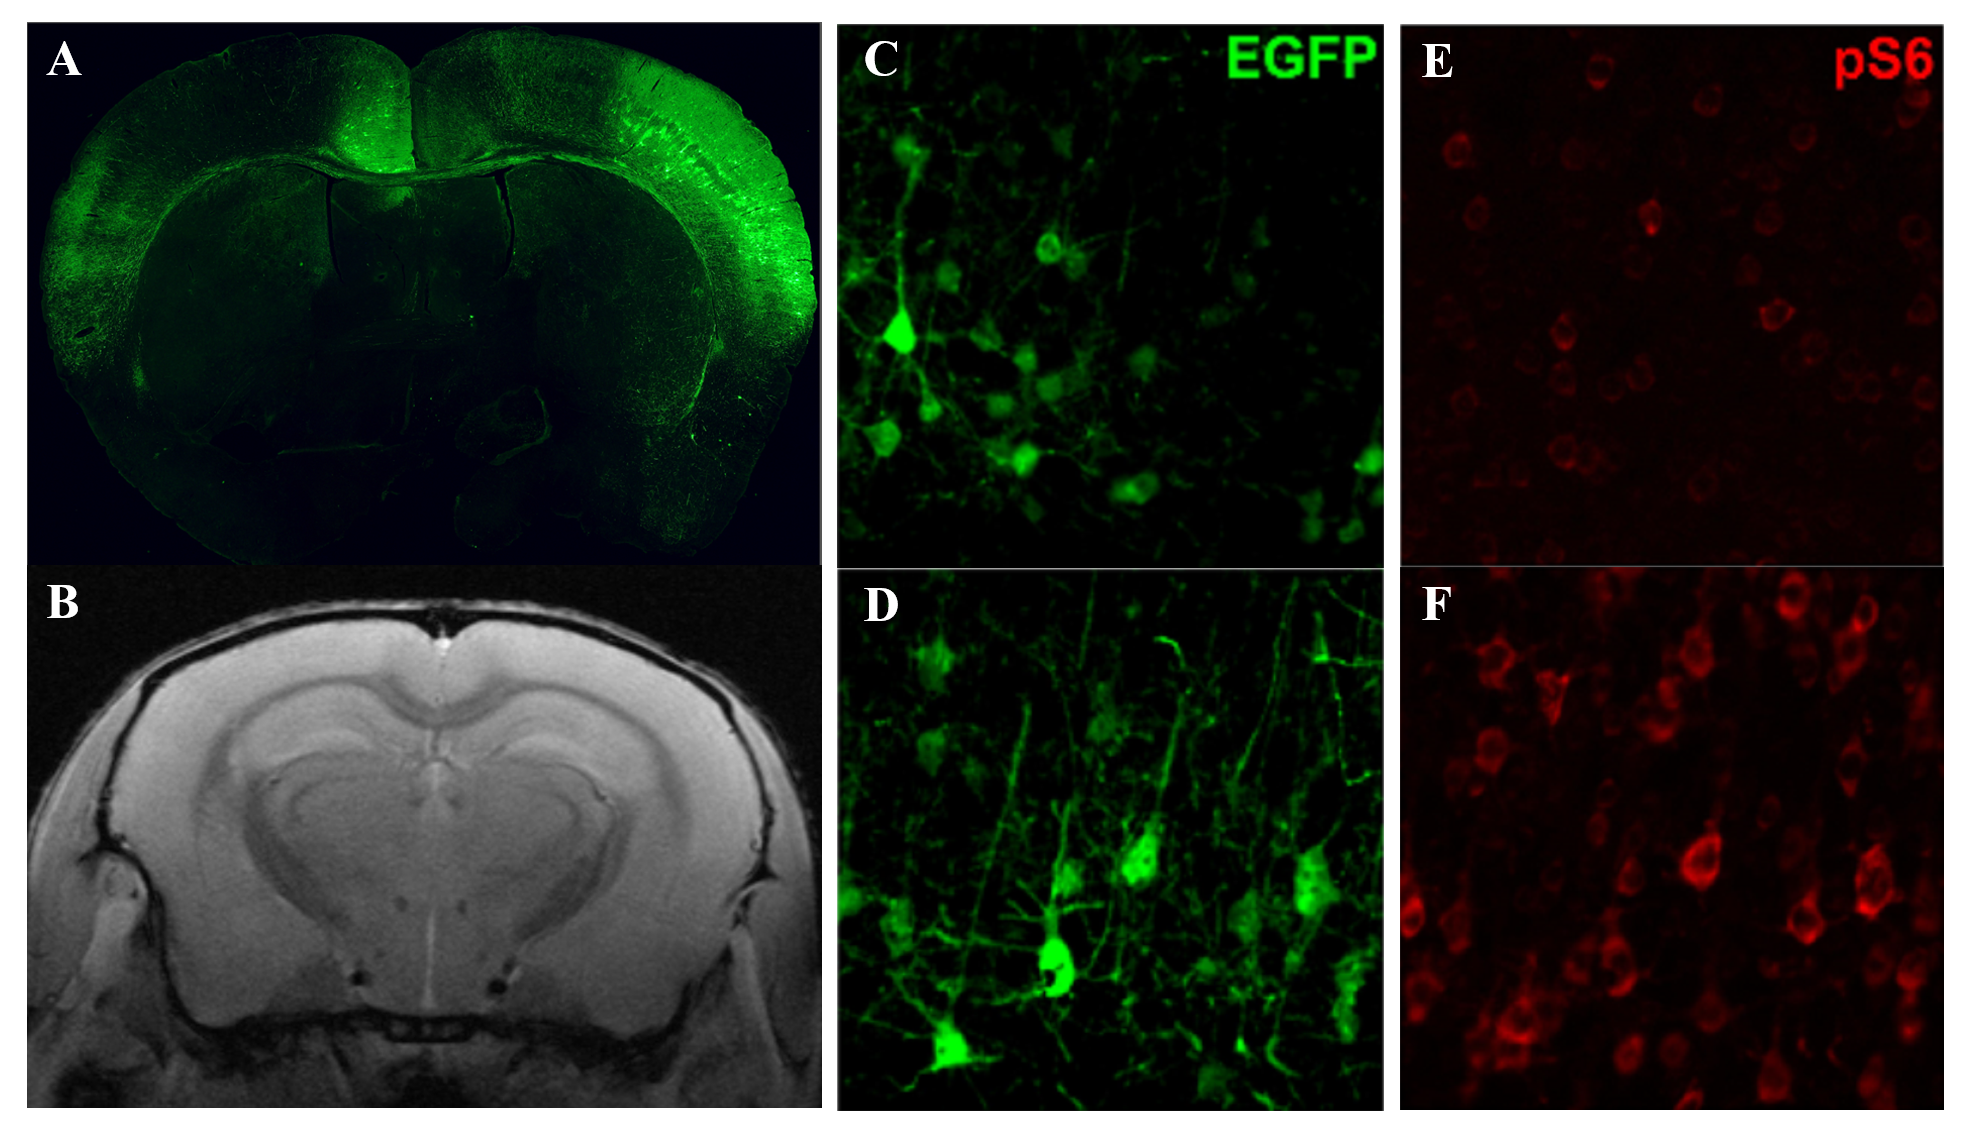
This study was approved by the local ethics committee. To recapitulate FCD Type II generation, we used in-utero electroporation to induce control or mutated PIK3CA plasmid into fetal mouse brains at embryonic day 14.5. After birth, pups were screened for successful electroporation via expression of fluorescent protein markers under fluorescence microscope. Both groups of animals were careful breeded to adulthood before MRI scanning.The Noddi protocol was carried out on an 11.7T preclinical MR scanner consisted of two high angular resolution diffusion imaging shell (field-of-view, matrix size, slice number, TE , TR , 4 non-diffusion weighted acquisitions, 30 directions with b-value 1000 s/mm2 and 2000 1000 s/mm2, total scan time 21 min). Fitting was performed with the toolbox6 to generate maps of intracellular volume fraction (ICVF) and orientation dispersion index (ODI). Conventional DTI measurements including fraction anisotropy (FA) and mean diffusivity (MD) were also obtained using the FSL toolbox. After scanning, mice were sacrificed for slicing and histological tests.
Results and Discussion
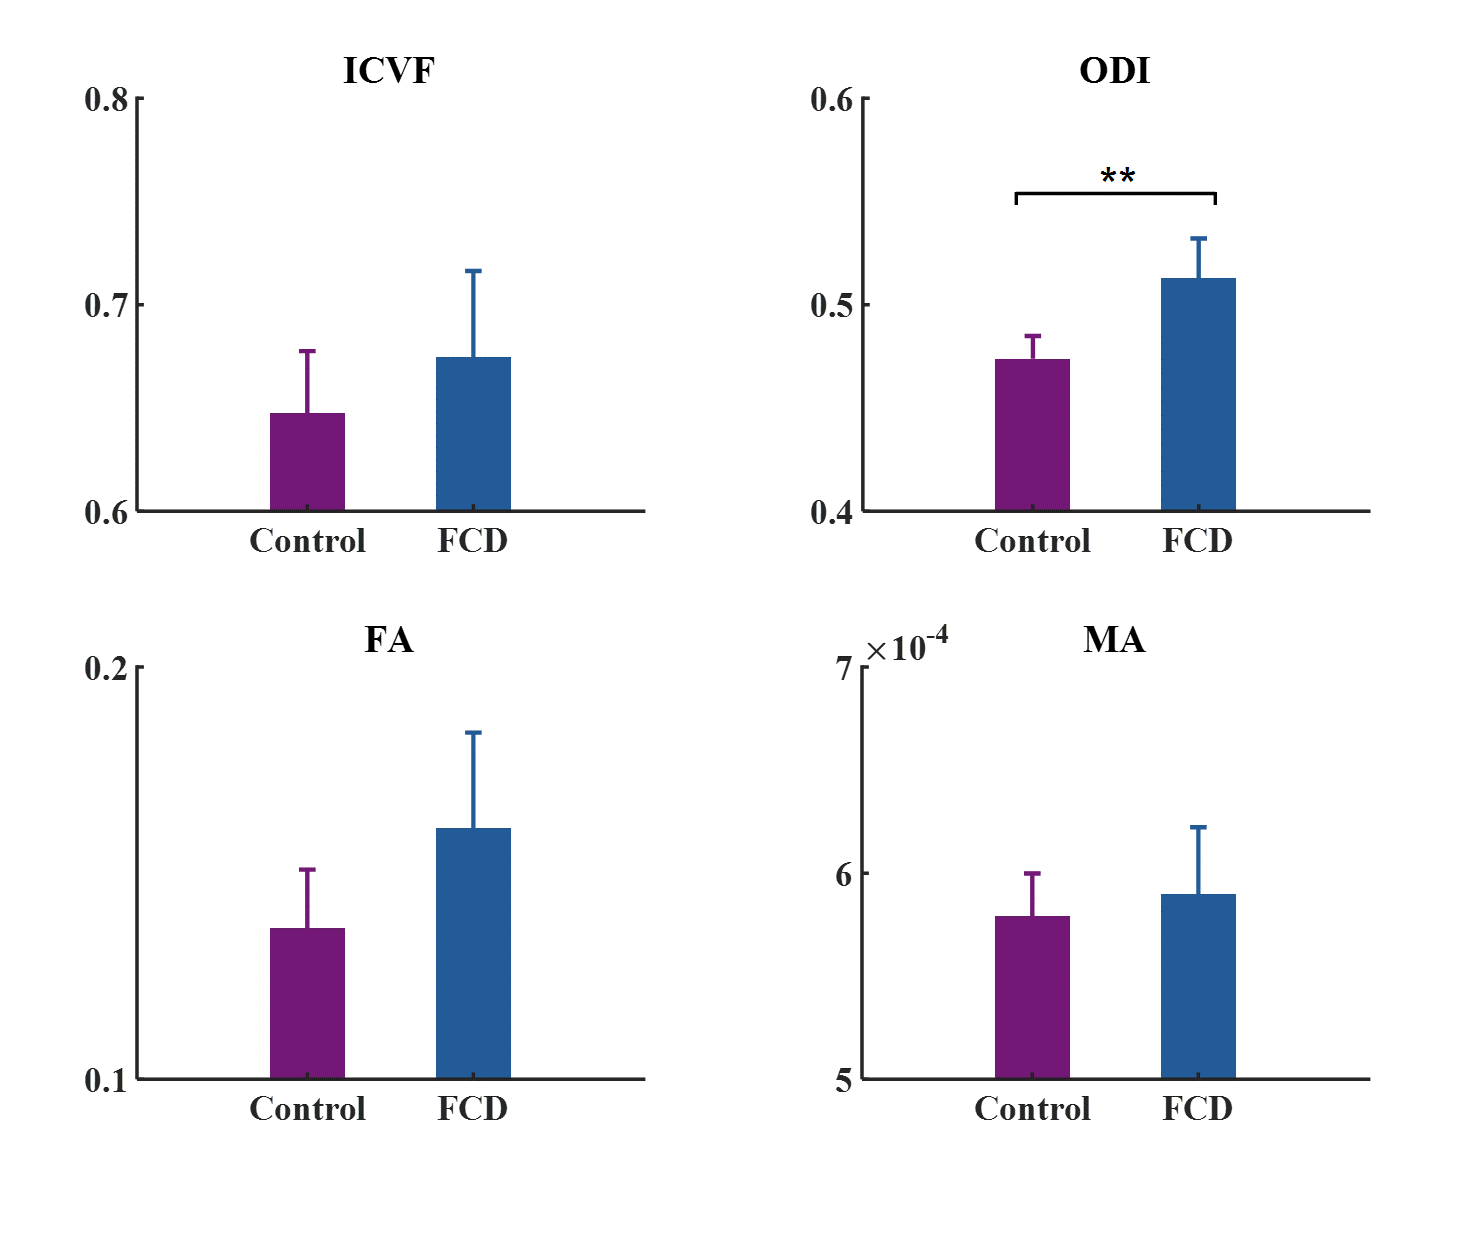
In-utero electroporation induced localized mutated PIK3CA expression and cortical malformation in right somatosensory cortex and left cingulate cortex within FCD mice as shown in Figure1A. FCD lesions presented giant neurons and radial-migration anomalies which mimics human pathologies (Figure1C, E).Regions of interest (ROI) were manually delineated along the edge of the lesions in each slice in order to derive the whole lesion volume from the background. This work was finished with reference to the pathological images to precisely localize the FCD lesions. Statistical results are shown in Figure2. ODI is significantly higher in the FCD group (0.51±0.01) compared with the control group (0.47±0.02) which are compatible with the pathological observation. No significant difference is observed between the FCD group (0.67±0.04) and the control group (0.65±0.03). Meanwhile, FA and MD are also no significant difference between the FCD group and the control group indicating that the advanced diffusion model-NODDI is more sensitive in detecting FCD lesion.
Conclusion
In current study, we examined the advanced diffusion MR imaging- NODDI in the FCD mice model to show that the addition parameters in NODDI are compatible with the intrinsic neuropathological changes and could assist in the identification of FCD lesions.Acknowledgements
This work was supported by Shanghai Municipal Science and Technology Major Project (No.2017SHZDZX01), Shanghai Municipal Science and Technology Major Project (No.2018SHZDZX01) and ZJLab, Shanghai Natural Science Foundation (No. 17ZR1401600) and the National Natural Science Foundation of China (No. 81971583).References
1.Hsieh LS, Wen JH, Claycomb K, et al. Convulsive seizures from experimental focal cortical dysplasia occur independently of cell misplacement. Nature Communications 2016;7.
2.Nguyen LH, Mahadeo T, Bordey A. mTOR Hyperactivity Levels Influence the Severity of Epilepsy and Associated Neuropathology in an Experimental Model of Tuberous Sclerosis Complex and Focal Cortical Dysplasia. Journal of Neuroscience 2019;39(14):2762-2773.
3.Crino PB. mTOR Signaling in Epilepsy: Insights from Malformations of Cortical Development. Cold Spring Harbor Perspectives in Medicine 2015;5(4).
4.Winston GP, Micallef C, Symms MR, Alexander DC, Duncan JS, Zhang H. Advanced diffusion imaging sequences could aid assessing patients with focal cortical dysplasia and epilepsy. Epilepsy Research 2014;108(2):336-339.
5.Wang Y, Zhou Y, Wang H, et al. Voxel-based automated detection of focal cortical dysplasia lesions using diffusion tensor imaging and T2-weighted MRI data. Epilepsy & Behavior 2018;84:127-134.
6.Daducci A, Canales-Rodriguez EJ, Zhang H, Dyrby TB, Alexander DC, Thiran J-P. Accelerated Microstructure Imaging via Convex Optimization (AMICO) from diffusion MRI data. Neuroimage 2015;105:32-44.
Figures