0938
Quantitative susceptibility mapping reveals abnormal zinc, calcium and iron levels in focal cortical dysplasia lesions1King's College London, London, United Kingdom, 2UCL, London, United Kingdom, 3UCL, LONDON, United Kingdom
Synopsis
We estimated quantitative susceptibility maps (QSM) in 19 children with histologically confirmed focal cortical dysplasia (FCD), a frequent cause of drug-resistant epilepsy. QSM allowed measurement of cortical and sub-cortical layered structure and its alteration in FCD lesions. Moreover, QSM was sensitive to abnormal deposits of calcium, zinc, and iron, which were validated using X-ray fluorescence in brain tissue specimens available following surgical treatment. QSM could provide a non-invasive biomarker of cortical tissue changes in epilepsy and could be used to determine alterations in mineral deposits in different brain disorders.
Introduction
Focal cortical dysplasia (FCD) is the most common cause of drug-resistant focal epilepsy in children1,2. Resective surgery is the most effective treatment to eliminate seizures, provided there is a well-characterised epileptic focus. Surgery is often performed on lesions with FCDIIa subtype, that present dysmorphic neurons, and FCDIIb that exhibit dysmorphic neurons, balloon cells and demyelination1,2.Magnetic susceptibility changes in epilepsy lesions are unknown and there is a lack of data describing cortical susceptibility, particularly in children. As quantitative susceptibility mapping (QSM) can discriminate between diamagnetic and paramagnetic substances, it could potentially provide more specific markers to characterise pathological alterations in FCD lesions3.
To investigate this, we calculated QSM in paediatric FCD patients. Quantitative investigation of susceptibility profile changes within lesions and homologous regions was performed. To assess which tissue pathological features specific to FCD may underlie susceptibility changes synchrotron radiation x-ray fluorescence (SRXRF) was performed on brain tissue resected from two patients5,8.
Methods
19 patients (mean age=7.5±5years) with radiologically and histologically confirmed FCD (16 FCDIIb, 4 FCDIIa) were scanned on a 3T whole-body MRI system (Magnetom Prisma, Siemens Medical Systems, Germany), using a 20-channel receive head coil and a body coil for transmission. Three-dimensional MPRAGE, FLAIR and multi-echo T2*-weighted images (TR=38ms, α=15°, TE1/ΔTE/TE7 =3/4/27ms, resolution=1.15x1.15x1.15mm3, GRAPPA acceleration factor 2, 6/8 partial Fourier) were acquired in 15 minutes.The processing pipeline for QSM included: brain masking with the FSL6.0 Brain Extraction Tool11 from, non-linear fitting7 of the complex GRE signal over multiple echoes, Laplacian phase unwrapping8, background field removal using the Laplacian boundary value method9, local field-to-susceptibility inversion using Tikhonov regularization10 with a regularisation parameter of 0.06 selected using L-curve methods and correction for susceptibility underestimation.
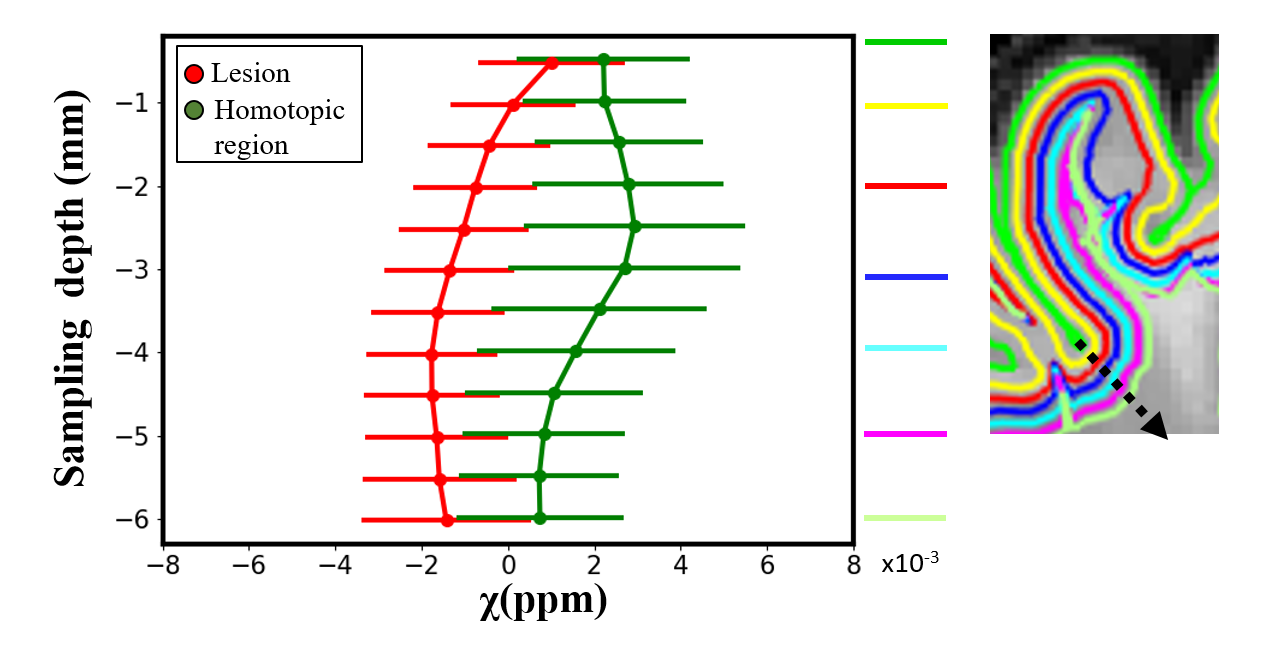
A surface-based approach using FreeSurfer6.0 was applied to investigate susceptibility changes across different cortical and subcortical depths within lesions and homologous regions.
We used SRXRF to perform a quantitative analysis of the chemical elements present in brain tissue specimens resected during epilepsy surgery. Two specimens from two FCDIIb lesions were scanned and analysed. Each specimen was placed in fixative solution immediately after brain surgery and embedded in paraffin wax, from which sections (7μm-thick) were obtained and mounted onto 4μm-thick Ultralene film secured to a customized holder for SRXRF.
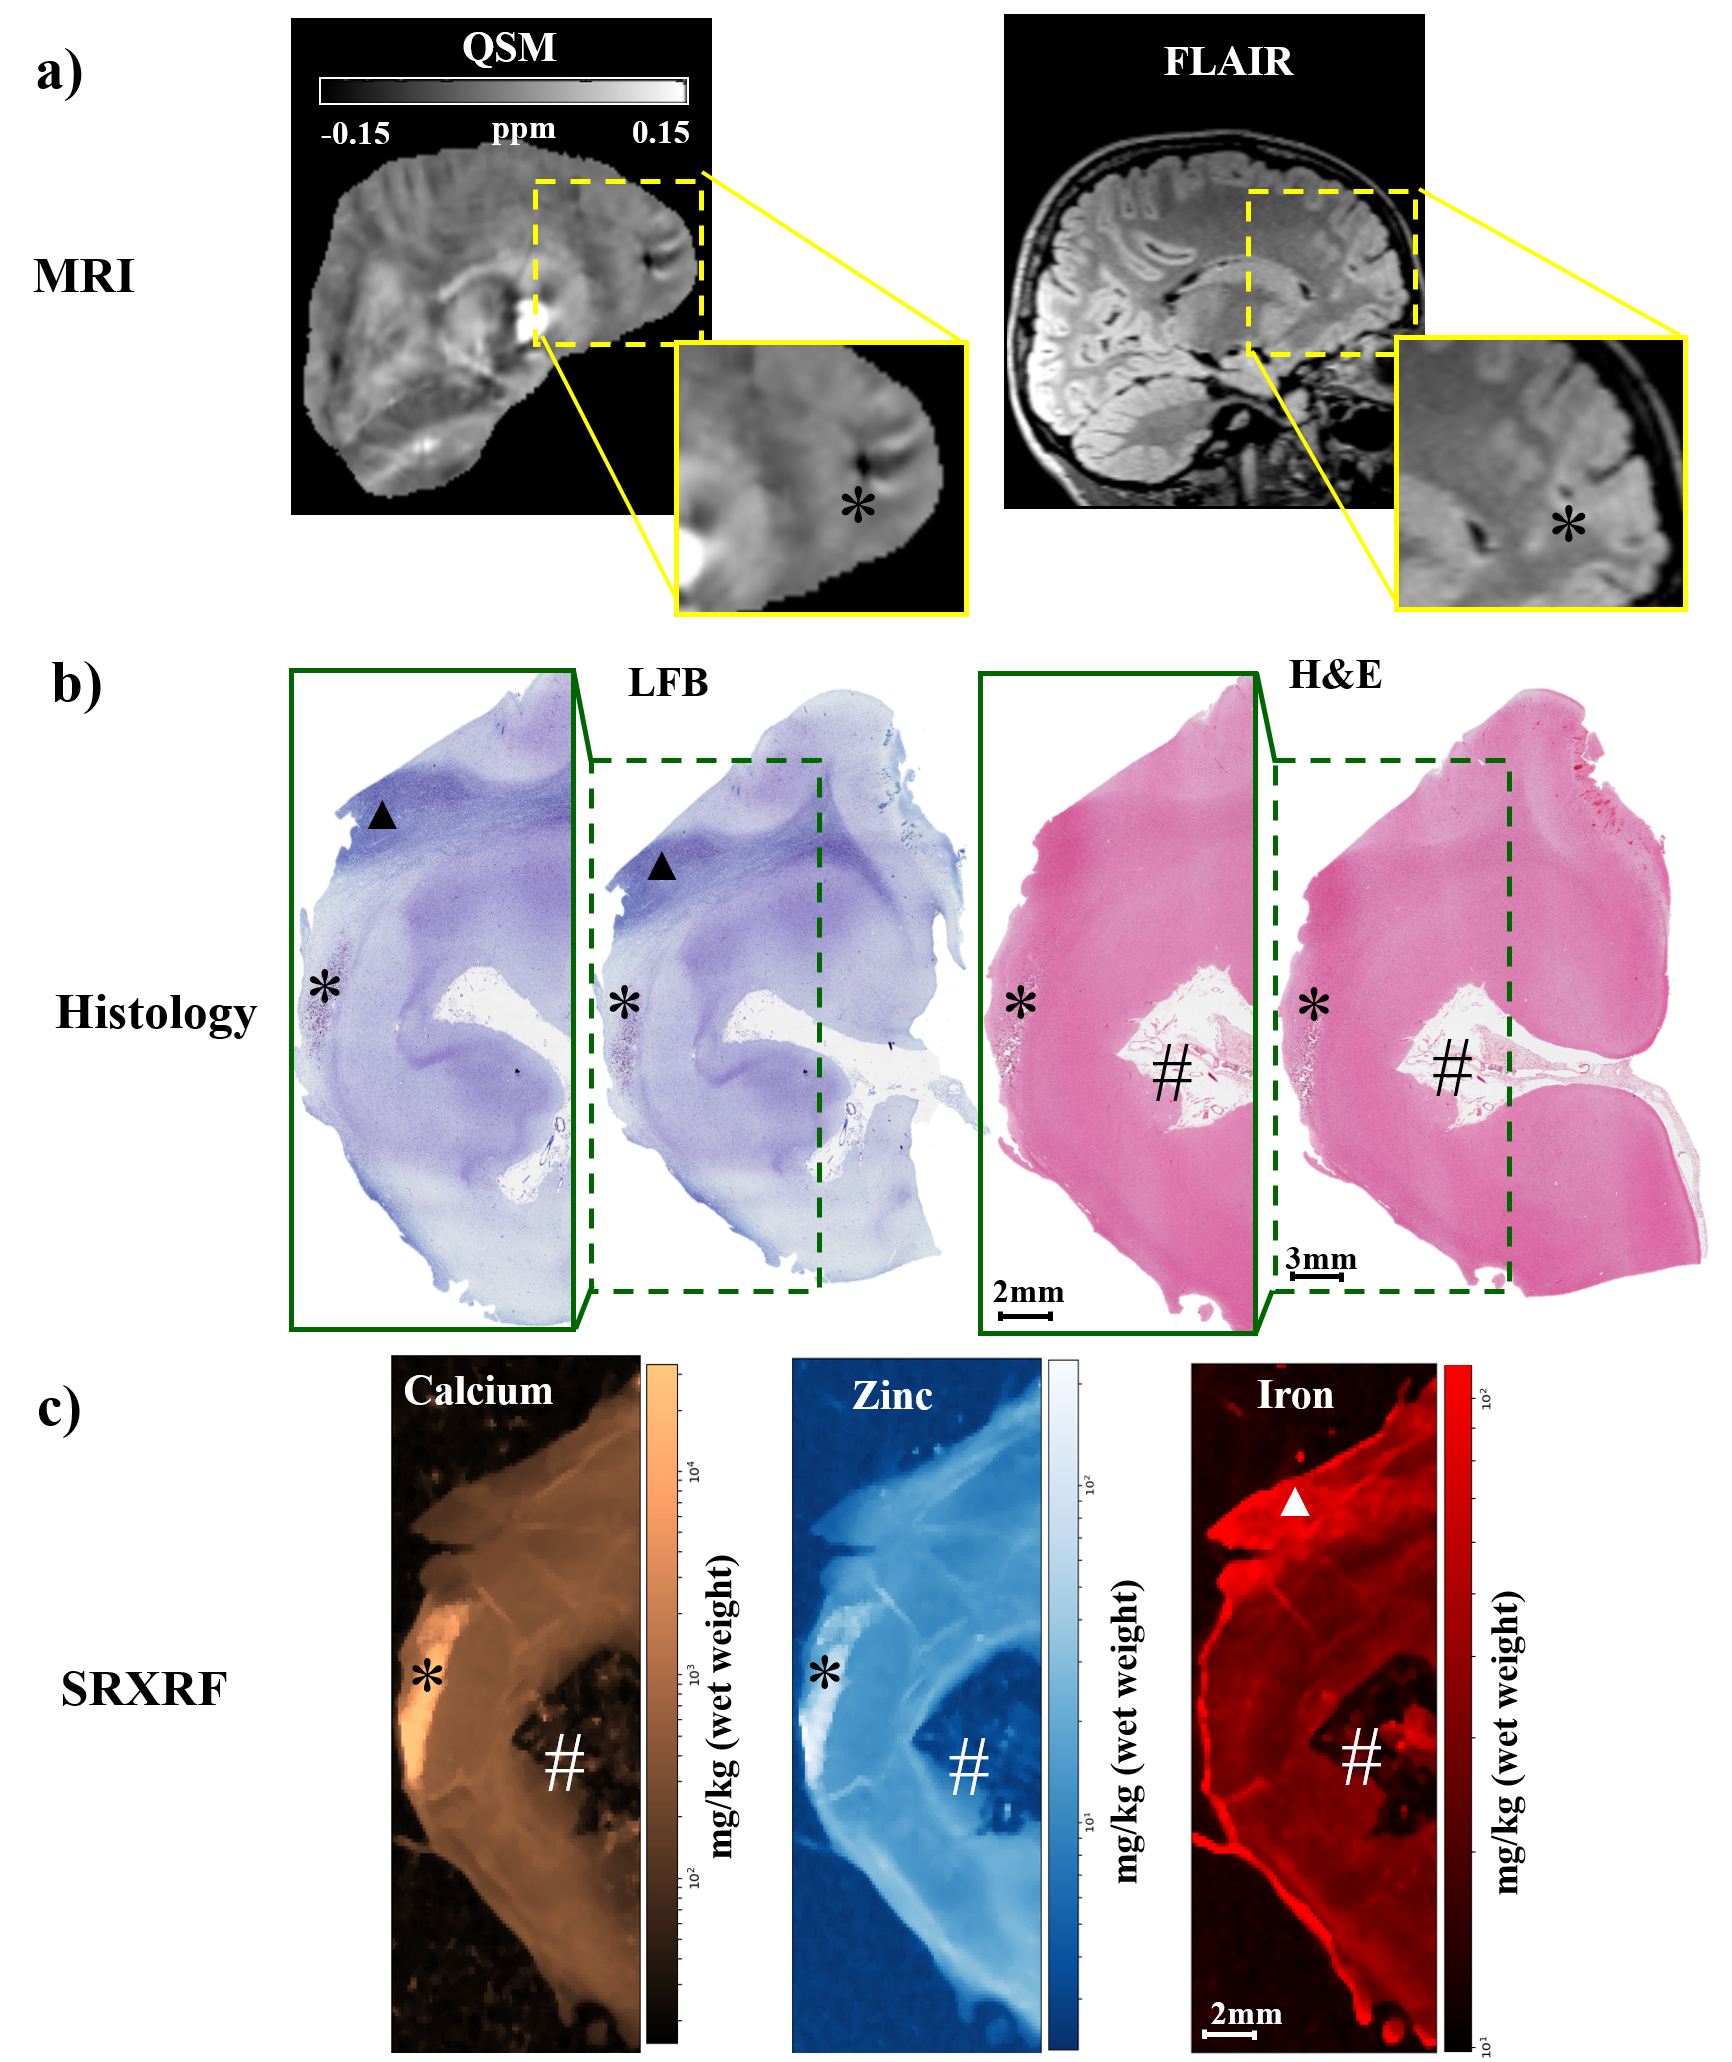
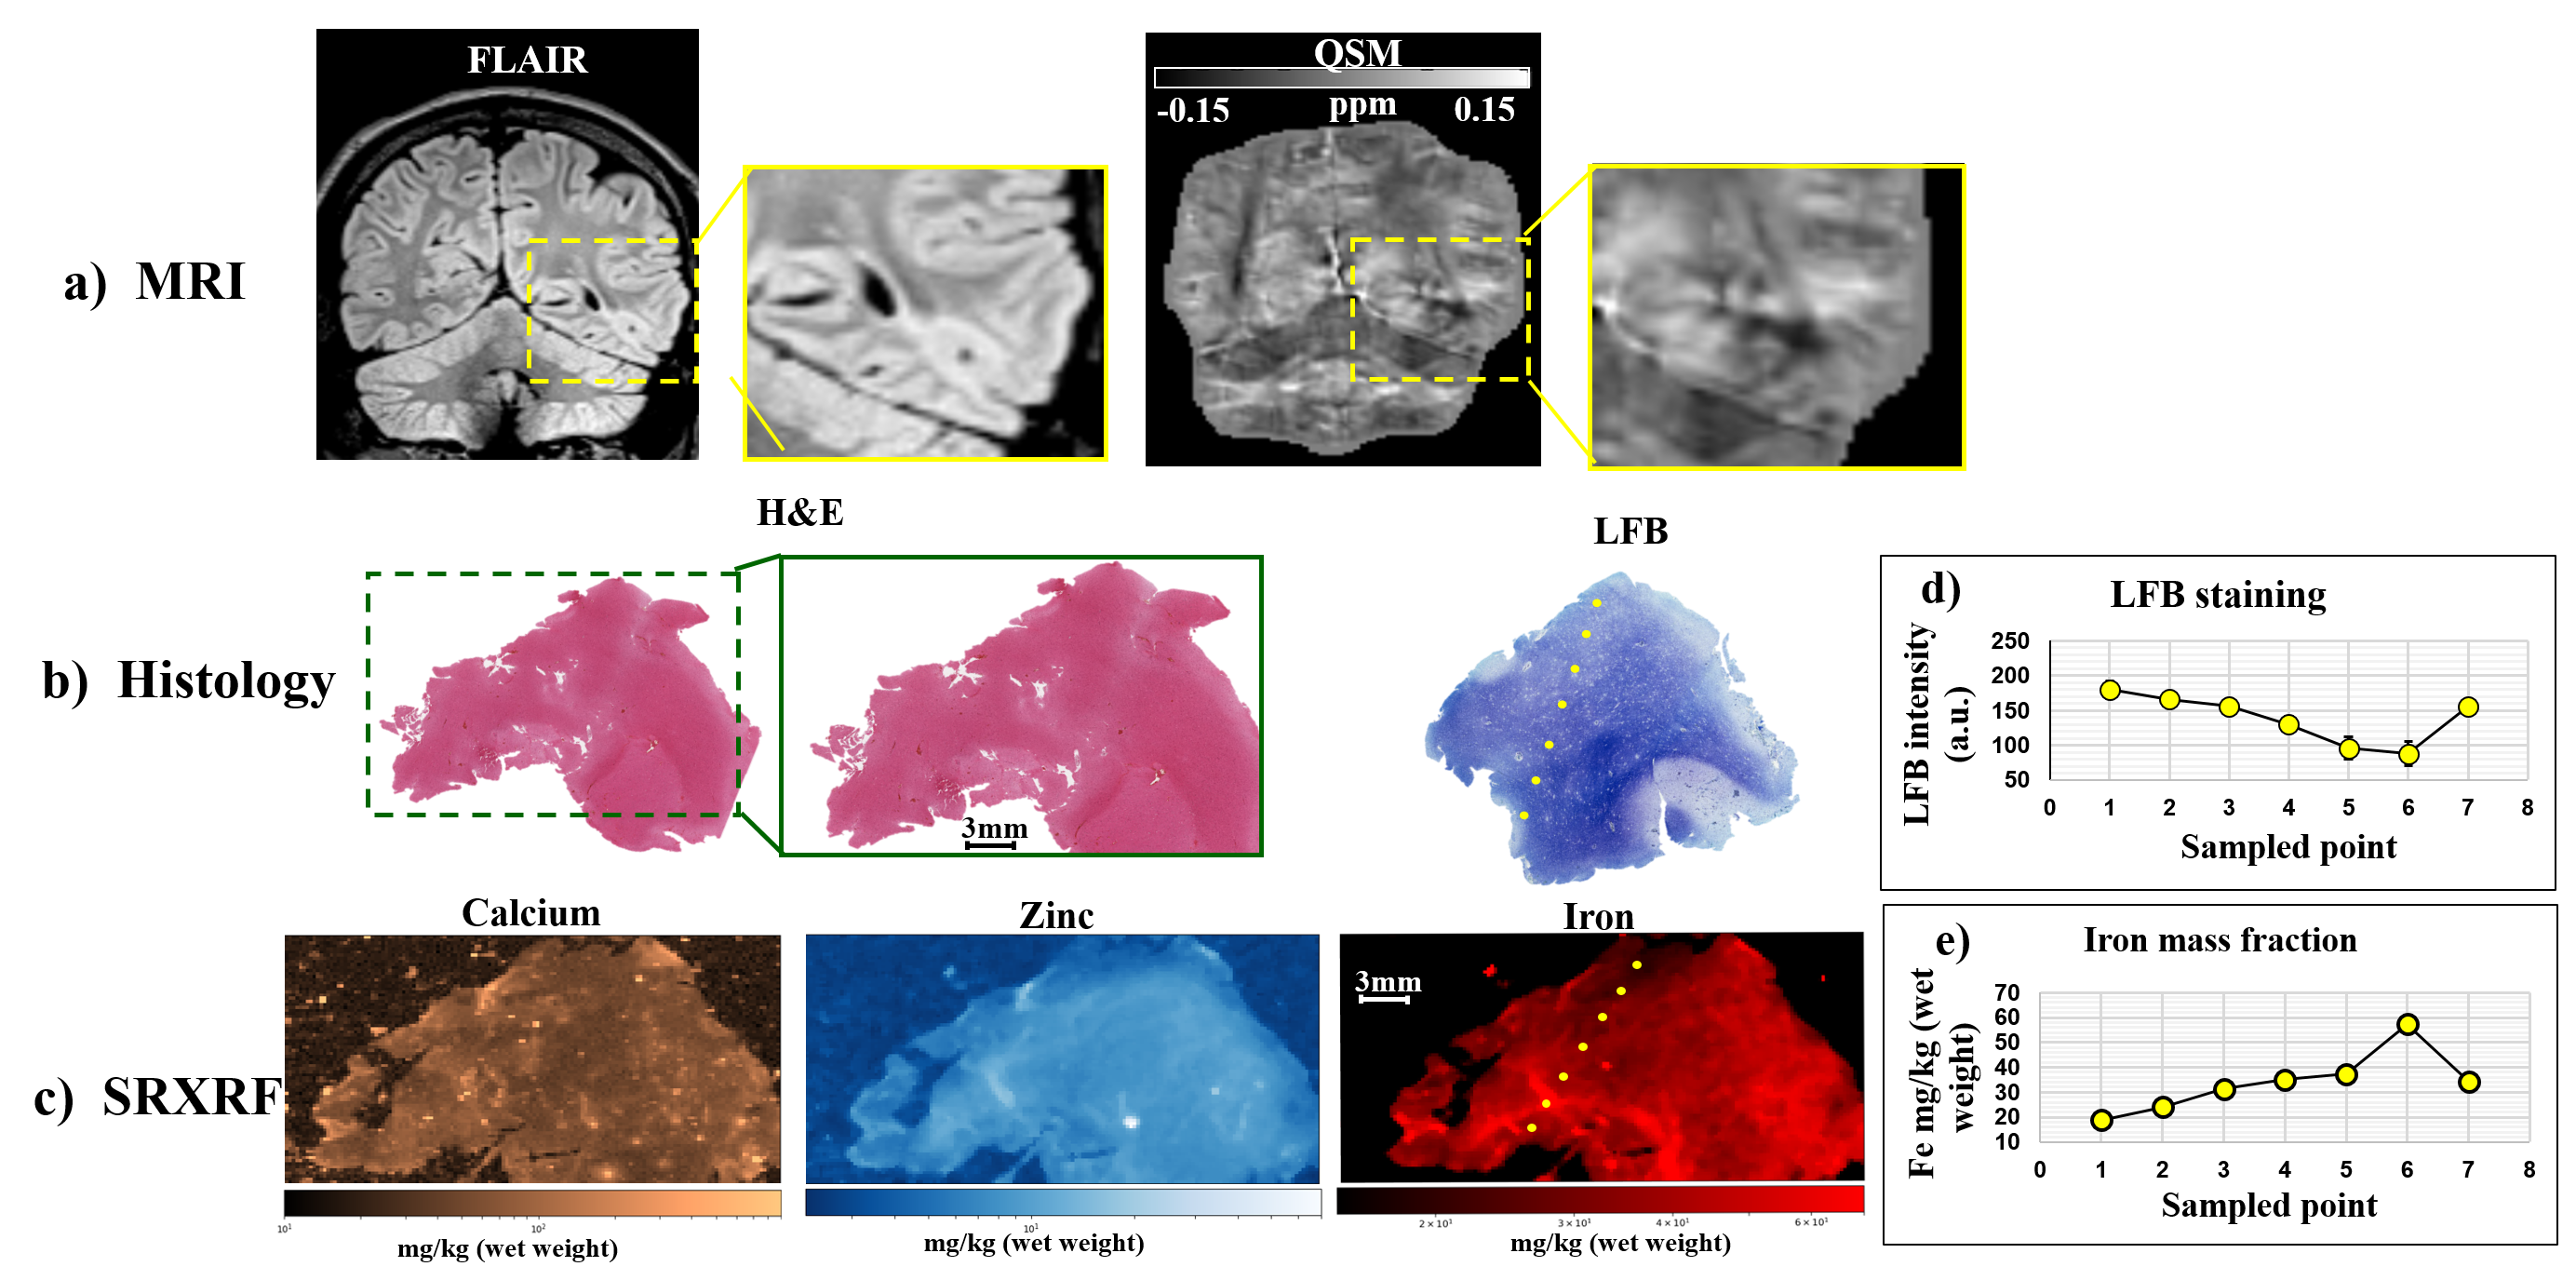
SRXRF was performed at the Diamond Light Source (Didcot, UK), with the beam energy tuned to 11keV and focused to 100×100μm resolution. Raw data, consisting of full energy dispersive spectra for each sample point exposed to the beam, were fitted and the net peak areas of iron, zinc and calcium were evaluated using PyMca16. Quantification of elemental concentrations was performed by measuring the photon flux on a reference metal film (AXO, Dresden, GmbH). 2D SRXRF elemental maps of iron, zinc and calcium were manually aligned to the corresponding luxol fast blue (LFB) and haematoxylin and eosin (H&E) sections (Figures 4,5) using ImageJ. Regions of interest (ROIs) were drawn manually using ImageJ to quantify iron, zinc and calcium concentrations in selected regions for comparison with QSM data.
Results
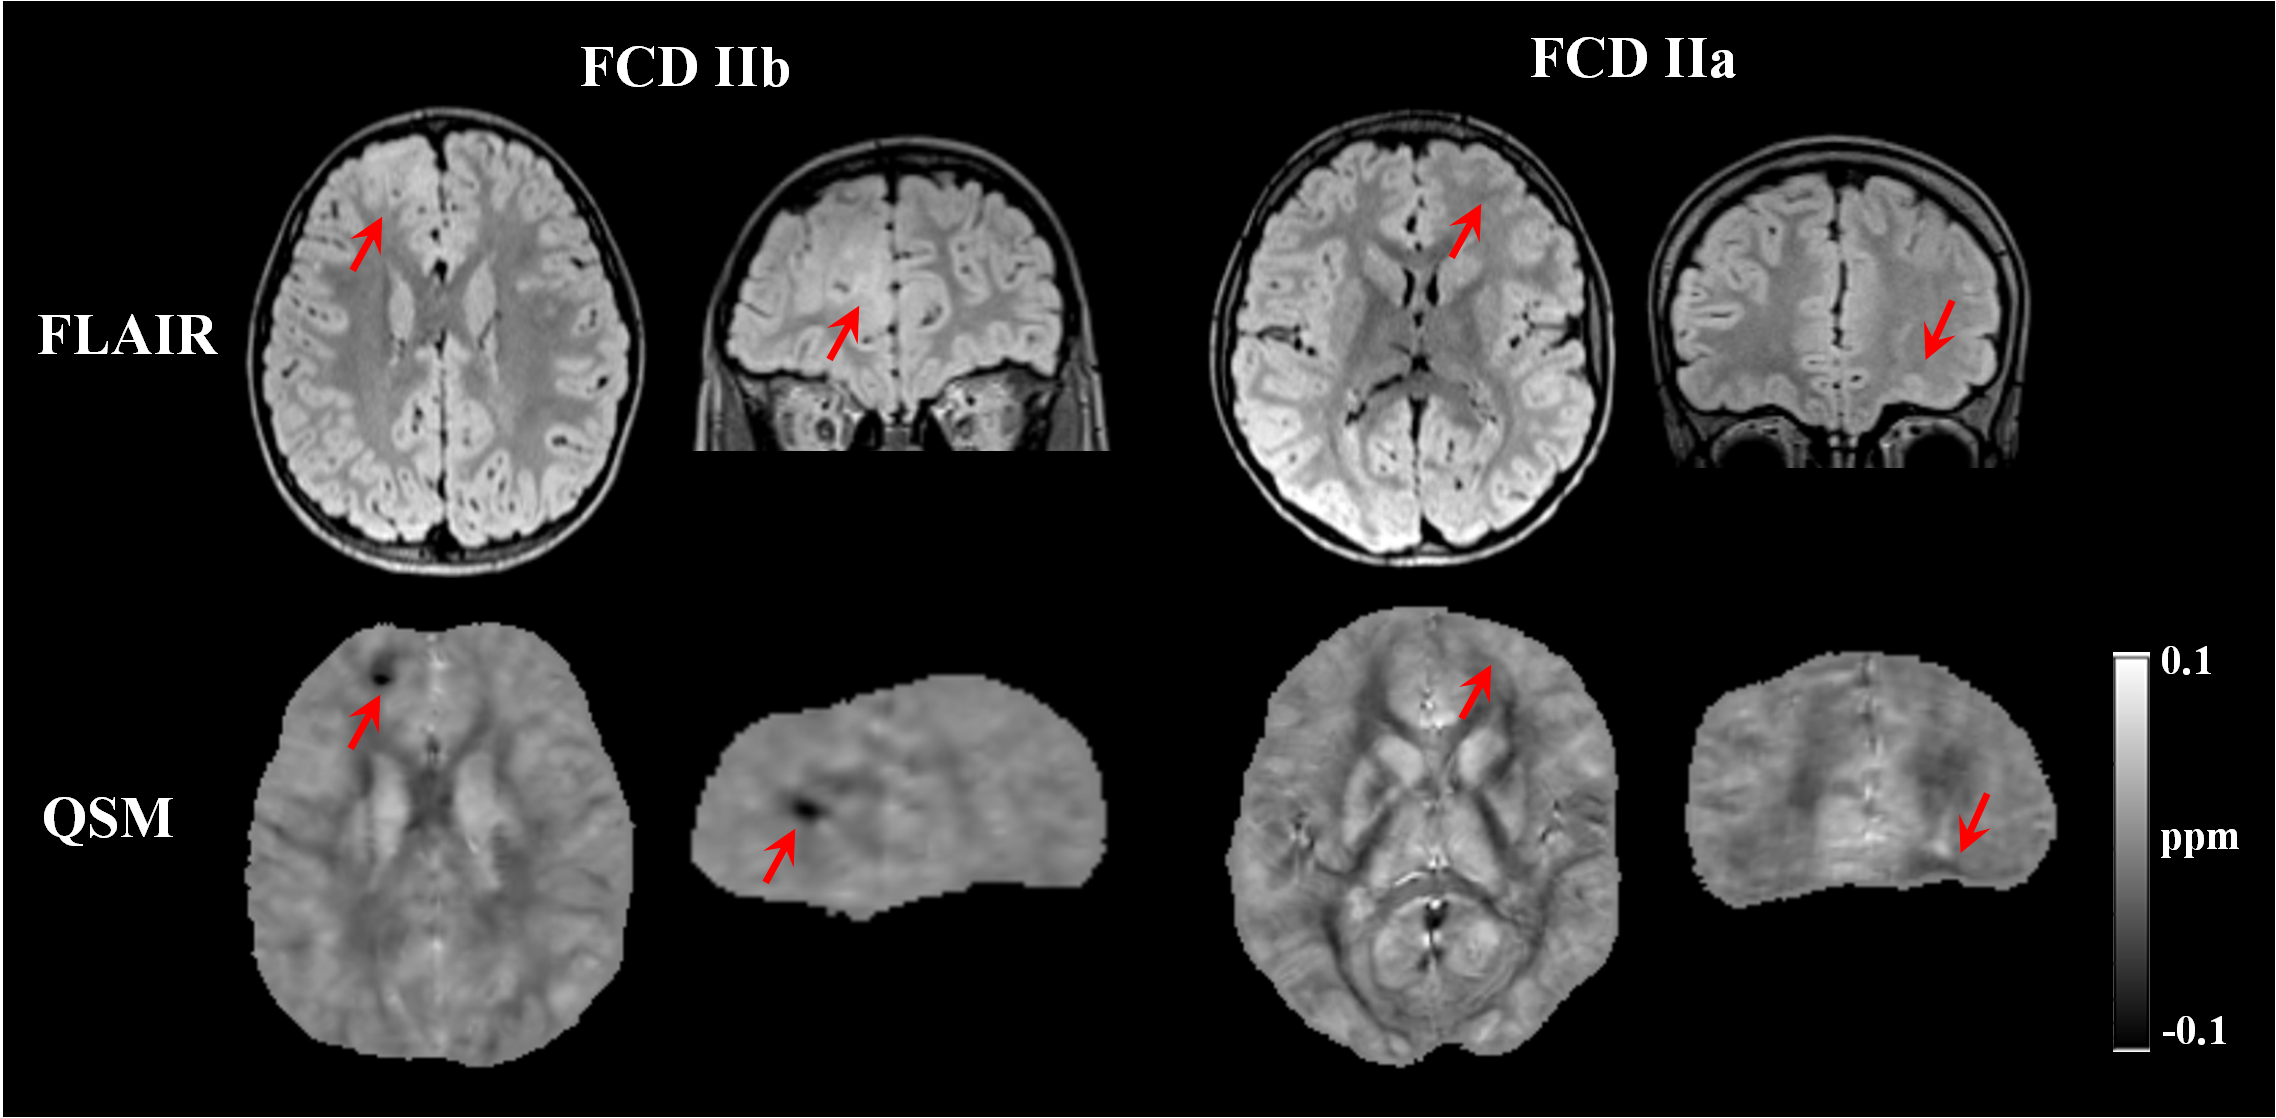
FCDIIb lesions were visible on the QSM (Figure 1). Susceptibility profiles in healthy cortical/subcortical regions showed positive susceptibility values with a peak at 2-3mm sampling depth (Figure 2).In FCDIIb lesions, the susceptibility was uniform across sampling depths and significantly reduced becoming more diamagnetic with increasing depth (Figure 2).
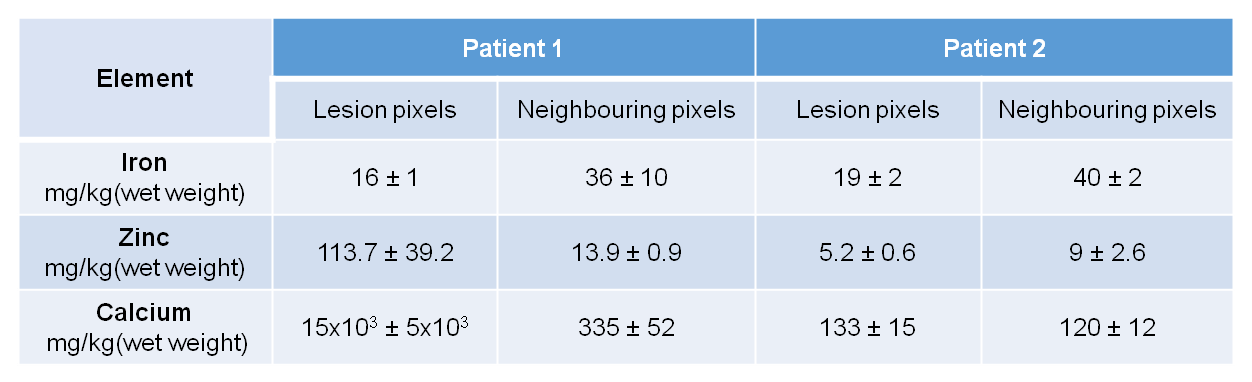
In one patient, SRXRF analysis showed increased zinc and calcium content compatible with the FCD lesion exhibiting negative susceptibility (Figures 3,4). Moreover, in the subcortical white matter belonging to the lesion, there was decreased iron content compared to adjacent tissue (Figures 3,4).
In another patient, we found decreased iron and zinc in the lesion with respect to the neighbouring tissue (Figures 3,5) and no significant calcium changes. In order to assess if the iron changes observed on the SRXRF maps were related to myelin content variation, since myelin is known to have high iron concentrations12, we performed LFB staining for both patients on tissue sections adjacent to those used for SRXRF analysis. LFB staining suggested that areas with low iron content also had decreased myelin (Figures 4,5).
Discussion
In non-lesional cortical/subcortical regions, QSM profiles showed increased susceptibility values at 2-3.5mm depth that could be related to the presence of iron co-localising with myelin in deeper layers13,14. These changes were absent in the contralateral regions affected by FCDIIb lesions, which exhibited decreased susceptibility across sampling depths.SRXRF on two FCDIIb specimens showed increased levels of zinc and calcium in one brain region exhibiting strong negative susceptibility values, and decreased iron in two regions with low susceptibility. Dystrophic calcifications have been observed in a spectrum of neurological disorders, and are associated with abnormal mineral accumulation in areas of degenerated or necrotic tissue15. Zinc dyshomeostasis has also been shown to be involved in variety of excitotoxicity conditions, including epilepsy16,17.
A decrease of iron was observed in specimens from two patients and co-localised with demyelination highlighted by LFB staining. This finding is concordant with the histo-pathological features of FCDIIb lesions, and it could explain the QSM hypointensity observed in vivo.
Conclusion
QSM could provide a non-invasive and reliable informative measurement of magnetic tissue property alterations in FCDIIb lesions and potentially be used for non-invasive tissue characterisation for surgical planning.Acknowledgements
This work was supported by the Henry Smith Charity and Action Medical Research (GN2214), the Wellcome EPSRC Centre for Medical Engineering at Kings College London (WT 203148/Z/16/Z) and by the National Institute for Health Research (NIHR) Biomedical Research Centre based at Guy’s and St Thomas’ NHS Foundation Trust and King’s College London. The views expressed are those of the authors and not necessarily those of the NHS, the NIHR or the Department of Health.
References
1. Blümcke I, Thom M, Aronica E, et al. The clinicopathologic spectrum of focal cortical dysplasias: a consensus classification proposed by an ad hoc Task Force of the ILAE Diagnostic Methods Commission. Epilepsia 2011;52:158–174 doi: 10.1111/j.1528-1167.2010.02777.x.
2. Harvey AS, Cross JH, Shinnar S, Mathern GW, Mathern BW, ILAE Pediatric Epilepsy Surgery Survey Taskforce. Defining the spectrum of international practice in pediatric epilepsy surgery patients. Epilepsia 2008;49:146–155 doi: 10.1111/j.1528-1167.2007.01421.x.
3. Adler S, Lorio S, Jacques TS, et al. Towards in vivo focal cortical dysplasia phenotyping using quantitative MRI. NeuroImage Clin. 2017;15:95–105 doi: 10.1016/j.nicl.2017.04.017.
4. Zheng W, Nichol H, Liu S, Cheng Y-CN, Haacke EM. Measuring iron in the brain using quantitative susceptibility mapping and X-ray fluorescence imaging. NeuroImage 2013;78:68–74 doi: 10.1016/j.neuroimage.2013.04.022.
5. Walker T, Michaelides C, Ekonomou A, et al. Dissociation between iron accumulation and ferritin upregulation in the aged substantia nigra: attenuation by dietary restriction. Aging 2016;8:2488–2506 doi: 10.18632/aging.101069.
6. Smith SM. Fast robust automated brain extraction. Hum. Brain Mapp. 2002;17:143–155 doi: 10.1002/hbm.10062.
7. Liu T, Wisnieff C, Lou M, Chen W, Spincemaille P, Wang Y. Nonlinear formulation of the magnetic field to source relationship for robust quantitative susceptibility mapping. Magn. Reson. Med. 2013;69:467–476 doi: 10.1002/mrm.24272.
8. Schweser F, Deistung A, Sommer K, Reichenbach JR. Toward online reconstruction of quantitative susceptibility maps: Superfast dipole inversion. Magn. Reson. Med. 2013;69:1581–1593 doi: 10.1002/mrm.24405.
9. Zhou D, Liu T, Spincemaille P, Wang Y. Background field removal by solving the Laplacian boundary value problem. NMR Biomed. 2014;27:312–319 doi: 10.1002/nbm.3064.
10. Kressler B, Rochefort L de, Liu T, Spincemaille P, Jiang Q, Wang Y. Nonlinear Regularization for Per Voxel Estimation of Magnetic Susceptibility Distributions From MRI Field Maps. IEEE Trans. Med. Imaging 2010;29:273–281 doi: 10.1109/TMI.2009.2023787.
11. Solé VA, Papillon E, Cotte M, Walter Ph, Susini J. A multiplatform code for the analysis of energy-dispersive X-ray fluorescence spectra. Spectrochim. Acta 2007;62:63–68 doi: 10.1016/j.sab.2006.12.002.
12. Langkammer C, Krebs N, Goessler W, et al. Quantitative MR imaging of brain iron: a postmortem validation study. Radiology 2010;257:455–462 doi: 10.1148/radiol.10100495.
13. Deistung A, Schäfer A, Schweser F, Biedermann U, Turner R, Reichenbach JR. Toward in vivo histology: A comparison of quantitative susceptibility mapping (QSM) with magnitude-, phase-, and R2⁎-imaging at ultra-high magnetic field strength. NeuroImage 2013;65:299–314 doi: 10.1016/j.neuroimage.2012.09.055.
14. Fukunaga M, Li T-Q, van Gelderen P, et al. Layer-specific variation of iron content in cerebral cortex as a source of MRI contrast. Proc. Natl. Acad. Sci. U. S. A. 2010;107:3834–3839 doi: 10.1073/pnas.0911177107.
15. Aggarwal M, Li X, Gröhn O, Sierra A. Nuclei-specific deposits of iron and calcium in the rat thalamus after status epilepticus revealed with quantitative susceptibility mapping (QSM). J. Magn. Reson. Imaging JMRI 2018;47:554–564 doi: 10.1002/jmri.25777.
16. Sensi SL, Paoletti P, Bush AI, Sekler I. Zinc in the physiology and pathology of the CNS. Nat. Rev. Neurosci. 2009;10:780–791 doi: 10.1038/nrn2734.
17.
Sensi SL, Paoletti P, Koh JY, Aizenman E, Bush AI, Hershfinkel M. The
neurophysiology and pathology of brain zinc. J. Neurosci. 2011;31:16076–16085
doi: 10.1523/JNEUROSCI.3454-11.2011.
Figures