0935
Using High-resolution 3D MR Fingerprinting for Characterization of Focal Cortical Dysplasia1Epilepsy Center / Neurological Institute, Cleveland Clinic, Cleveland, OH, United States, 2Radiology, Case Western Reserve University, Cleveland, OH, United States, 3Imaging Institute, Cleveland Clinic, Cleveland, OH, United States, 4Neuropathology, University of Erlangen, Erlangen, Germany, 5Biomedical Engineering, Case Western Reserve University, Cleveland, OH, United States
Synopsis
We investigate in this study quantitative T1 and T2 values as potential biomarkers of tissue properties in epilepsy patients with focal cortical dysplasia (FCD) using a novel high-resolution 3D magnetic resonance fingerprinting (MRF) technique. We first investigated the quantitative T1 and T2 values in various Brodmann areas to verify the sensitivity of MRF in probing tissue properties of the human cortex. We then investigated the MRF T1 and T2 values in different subtypes of FCD lesions, which were higher than their corresponding cortical regions in the controls.
INTRODUCTION
Focal cortical dysplasia (FCD) is one of the most common underlying pathologies for medically intractable epilepsies1. Although a fair percentage of FCD lesions can be visually appreciated on conventional MRI, it is challenging to distinguish subtle FCD lesions from normal brain tissues, partly due to a lack of sensitive and specific MRI measurements. Recent studies have shown that FCD causes abnormalities in both cyto- and myelo-architectures of the cortex2,3. Here, we investigated quantitative T1 and T2 values as potential biomarkers of tissue properties in epilepsy patients with FCD using a novel high-resolution 3D magnetic resonance fingerprinting (MRF) technique4. We also investigated quantitative T1 and T2 values among Brodmann areas (BA) to test the sensitivity of MRF variation across the cortex.METHODS
MRI acquisition: A 3D whole-brain MRF scan was acquired from 10 healthy subjects and 8 patients with medically intractable epilepsy and histopathologically confirmed FCD (6 FCD type II and 2 MCD, i.e., malformation of cortical development) in a Siemens 3T Prisma scanner (FOV=300x300x144 mm3, 1.2 mm3 isotropic voxel, scan time=10.4 minutes)4,5. T1 and T2 maps were then generated based on the direct matching of the data to a predefined dictionary4. T1-weighted (T1w) images were synthesized from the MRF maps. The routine clinical 3D T1w MPRAGE scan was additionally obtained, followed by the 3D MRF scan.Cortical maps: The cortical surface of the MRF T1 map was retrieved using the Freesurfer pipeline6. In the first step, surface maps of T1w MPRAGE were generated from “recon all”. Synthesized T1w images from MRF were co-registered to the T1w MPRAGE images using automatic registration (bbregister) and manual registration (tkregisterfv). The cortical surface maps of T1 values were then obtained using the registration information and mri_vol2surf. The sampling was performed at 2 mm depth from the pial surface.
MRF values in Brodmann areas: The synthesized MRF T1w images of patients and normal controls were segmented into gray matter (GM), white matter (WM) and cerebral spinal fluid (CSF) using FSL7, and normalized to MNI space using SyN in ANTs8. The warping information was directly applied to the T1 and T2 maps. The GM masks were applied on the Brodmann atlas (MRIcro)9 to calculate the average T1 and T2 values for a given BA.
MRF values in FCD lesion: For the FCD cases, a ROI was drawn for each lesion manually. The same ROIs were applied to normal subjects to compare the matrices with FCD patients at the same cortical locations. GM masks were applied on the ROIs to extract the T1 and T2 values of the GM component of the lesions/normal cortices.
RESULTS
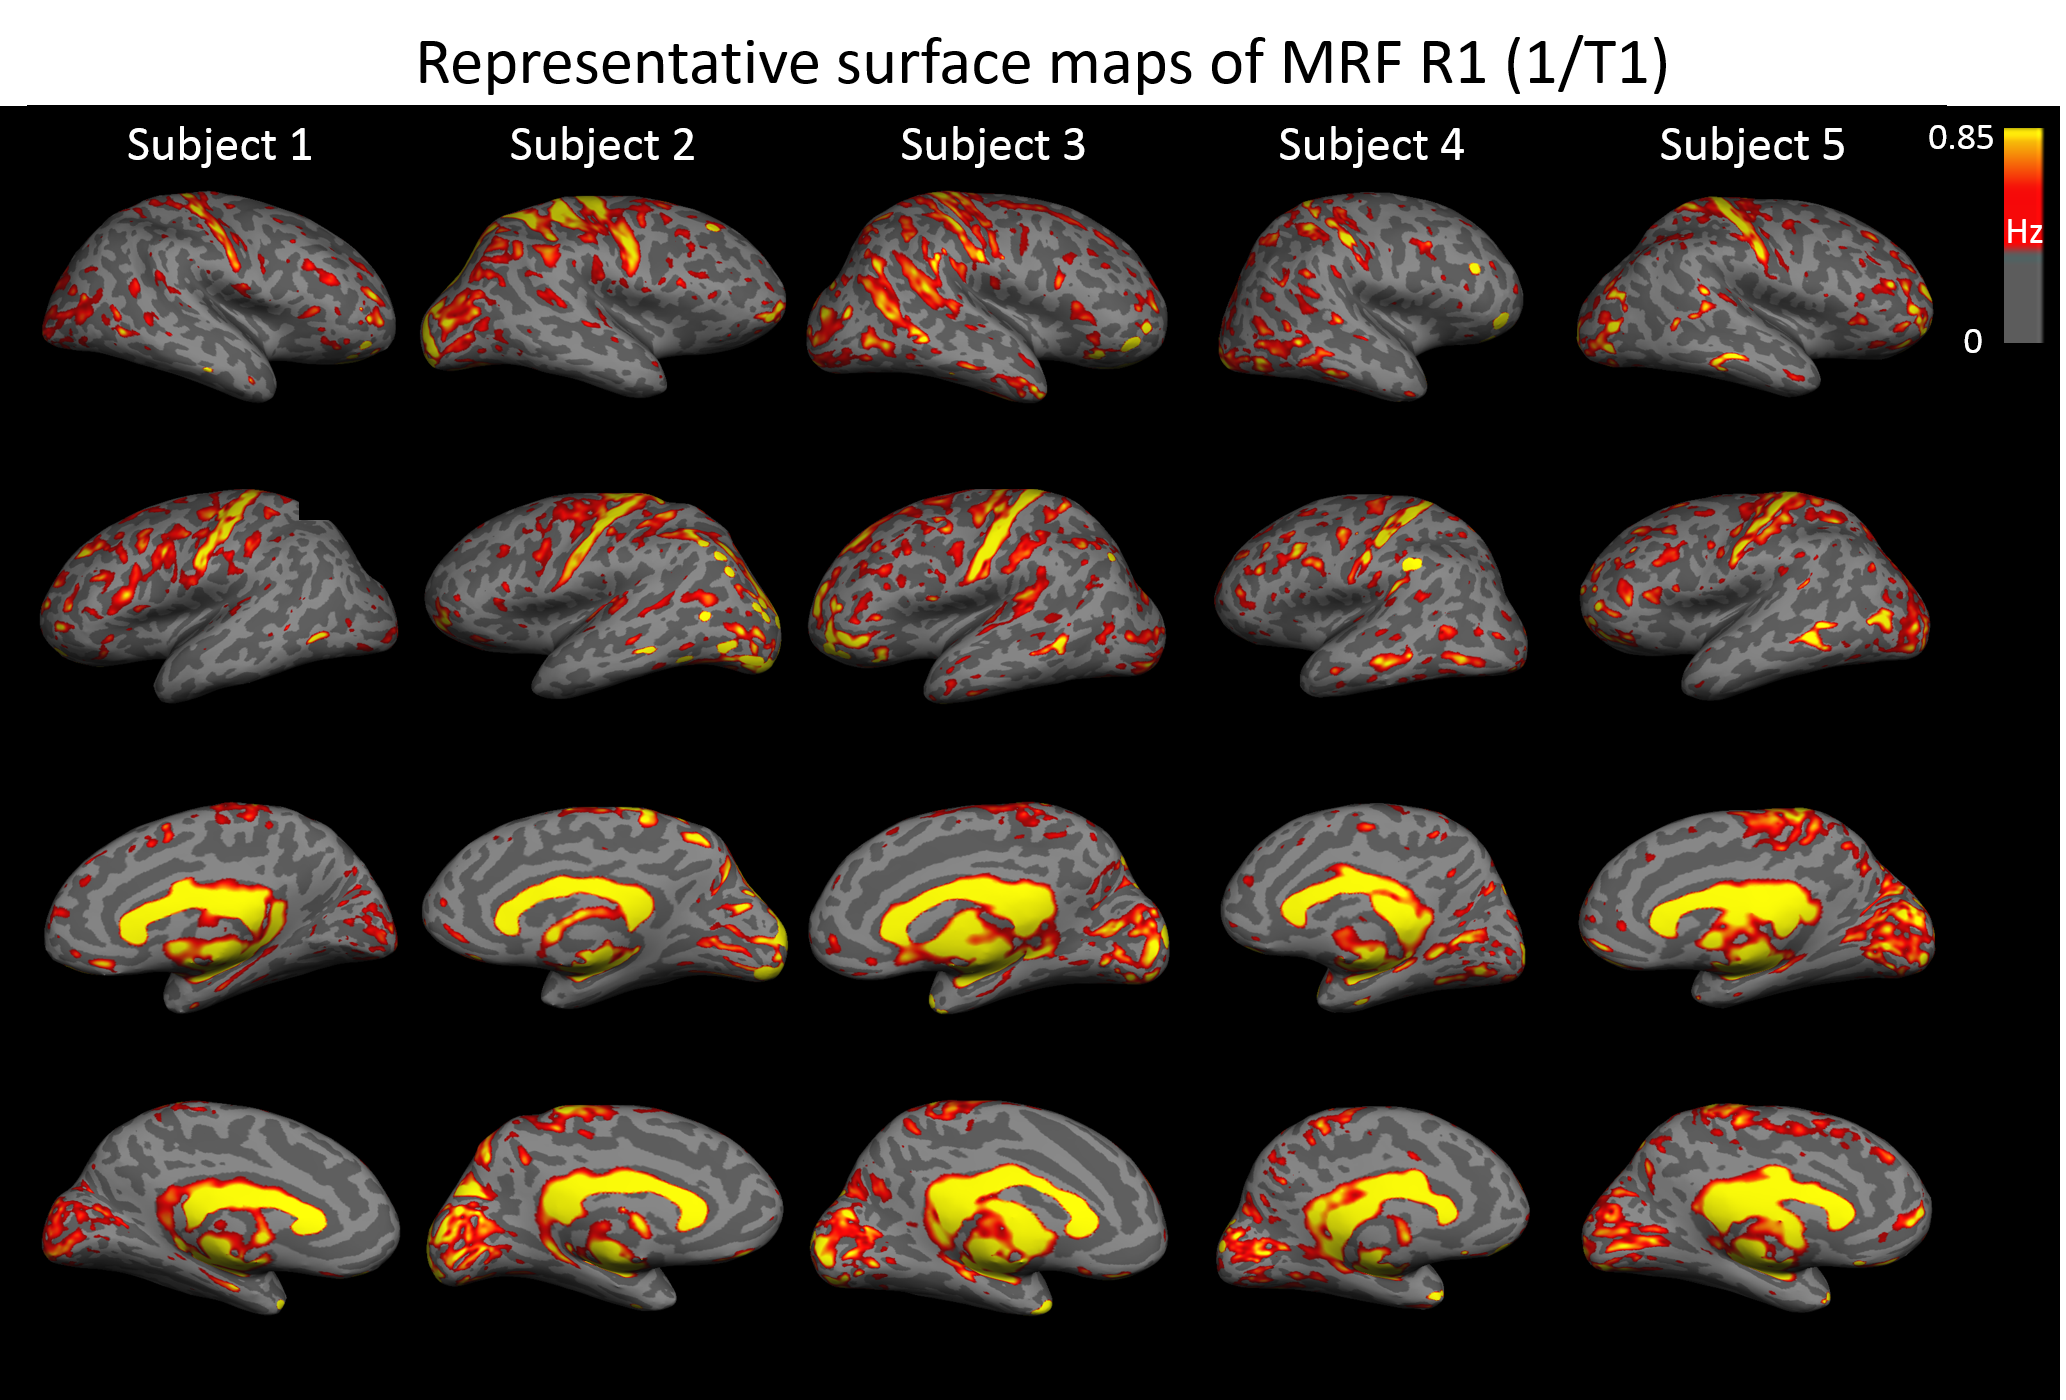
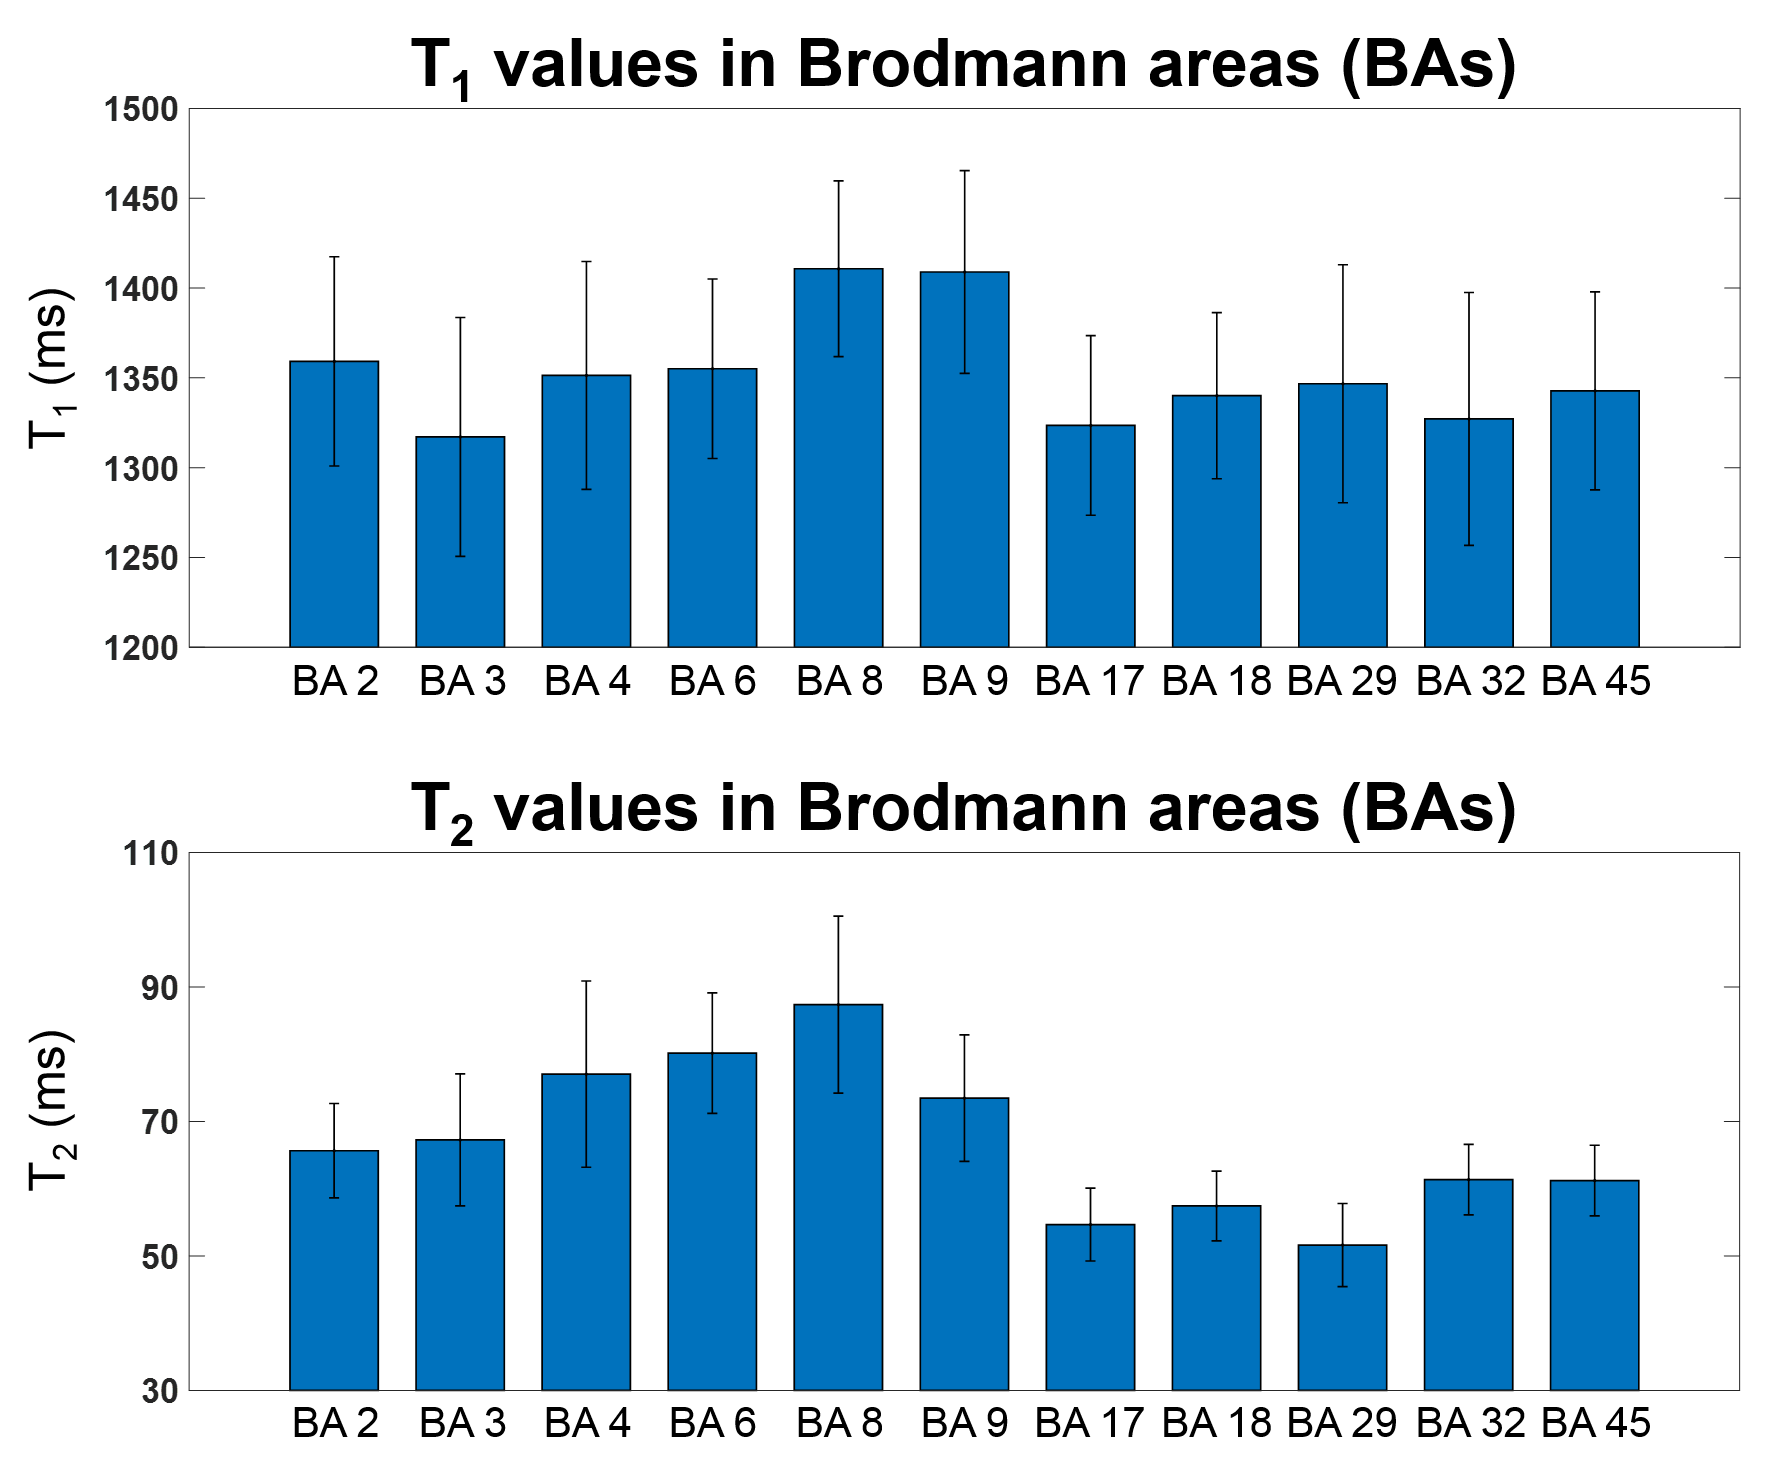
Figure 1 shows five representative lateral and mesial surface R1 (1/T1) maps from five individual control subjects. For better visualization, we plotted R1 maps instead of T1 maps as myelin-rich structure has higher R1 values. Our data clearly visualized a pattern of higher R1 value in the sensorimotor and visual cortex for all five subjects at an individual level.Figure 2 shows the mean and standard deviation of the T1 and T2 values from 11 BA. The quantitative value changes among different regions are in good agreement with previous literature10. Highlighted are the T1 and T2 values in BAs 3 (primary somatosensory cortex) and 17 (primary visual), which are lower than those in BAs 8 and 9 (frontal), corresponding to the different cytoarchitecture of these cortices. BA 29 (retrosplenial) has low T2 value, due to its rich myelin content.
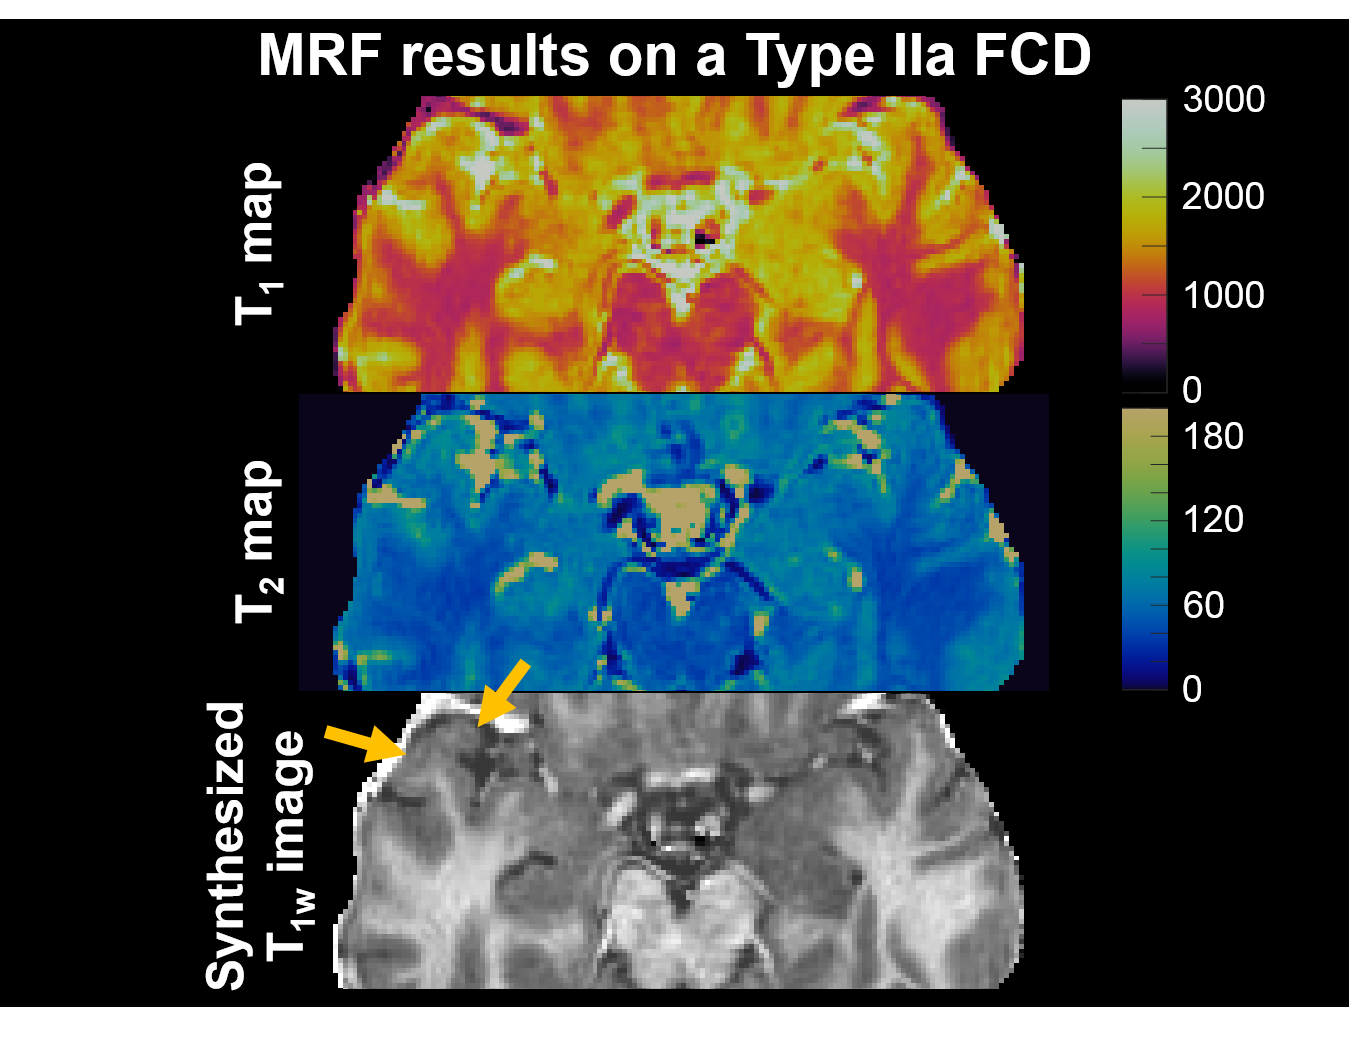
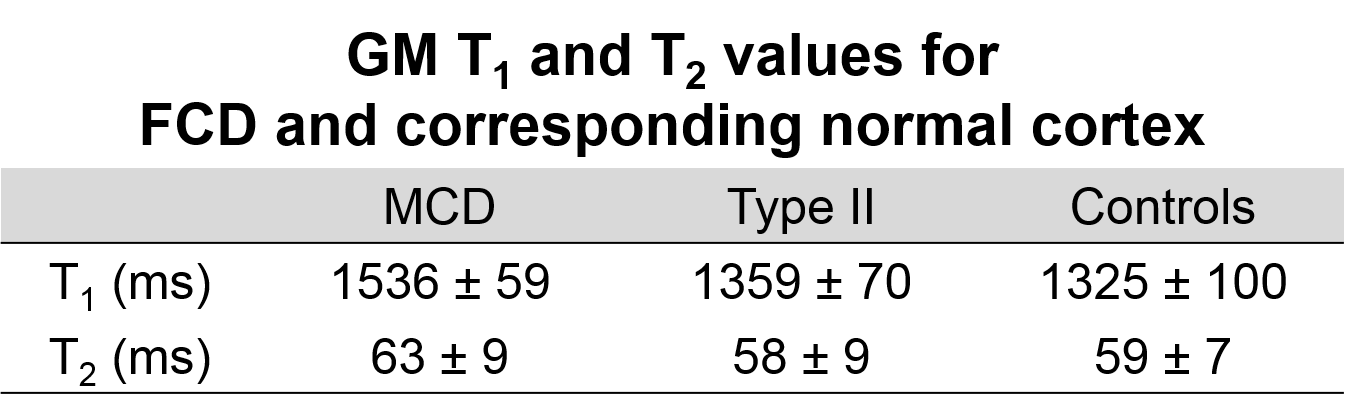
MRF results on a patient with FCD type IIa is shown in Figure 3, with arrows indicating the location of the lesion on the MRF T1w images. Visual inspection of the T1 and T2 maps shows: (1) the anterior aspect of the right superior temporal gyrus had higher T1 and T2 values compared to the contralateral side (mean GM T1: lesion=1597 ms and contralateral side=1567 ms, mean GM T2: lesion=78 ms and contralateral side=72 ms); (2) the T1 map in the lesional region had “speckled” appearance, which likely came from higher variation within both the GM and WM components of the lesion (std of GM T1: lesion=119 ms and contralateral side=111 ms, std of GM T2: lesion=8 ms and contralateral side=7 ms); (3) the MRF T1w image showed blurring of the GM-WM junction, a typical characteristic for FCD. This patient underwent stereotactic-EEG, which confirmed seizure onset from the lesion location. Resection rendered the patient seizure-free (follow up=2 months). Preliminary analyses from all 8 FCDs showed an increase in T1 of the GM component of the lesions compared to normal controls (Figure 4). When examining FCD subtypes, the T1 increase of the lesions was more marked for patients with MCD (T1 14% higher than normal subjects), and less so for patients with type II (T1 3% higher than normal subjects). T2 value of the GM component of the lesions increased slightly on a group level.
CONCLUSION
Our results demonstrate the sensitivity of using multi-parametric MRF results at 3T to differentiate cortical regions with different cyto- or myelo-architecture. We showed the feasibility to use the T1 and T2 values obtained from 3D MRF protocol for characterization of FCD lesions on individual/group levels.Acknowledgements
This study is supported by NIH R01 NS109439.References
[1] Bernasconi A, Bernasconi N, Bernhardt BC. et al. Advances in MRI for "cryptogenic" epilepsies. Nat Rev Neurol. 2011;7:99–108.
[2] Lutti A, Dick F, Sereno MI. et al. Using high‐resolution quantitative mapping of R1 as an index of cortical myelination. Neuroimage 2014;93:176–188.
[3] Waehnert MD, Dinse J, Schäfer A, et al. A subject‐specific framework for in vivo myeloarchitectonic analysis using high resolution quantitative MRI. Neuroimage 2016;125:94–107.
[4] Ma D, Gulani V, Seiberlich N. et al. Magnetic resonance fingerprinting. Nature. 2013; 14;495(7440):187-192.
[5] Ma D, Jones SE, Deshmane A. et al. Development of high resolution 3D MR fingerprinting for detection and characterization of epileptic lesions. J Magn Reson Imaging. 2019; 49(5):1333-1346.
[6] Dale AM, Fischi B, Sereno MI. Cortical surface-based analysis. Segmentation and surface reconstruction. Neuroimage. 1999; 9(2):179-194.
[7] Zhang Y, Brady M, Smith, S. Segmentation of brain MR images through a hidden Markov random field model and the expectation-maximization algorithm. IEEE Trans Med Imag, 20(1):45-57, 2001.
[8] Avants B and Gee JC. Geodesic estimation for large deformation anatomical shape averaging and interpolation. Neuroimage. 2004;23 Suppl 1:S139-50.
[9] Tzourio-Mazoyer N, Landeau B, Papathanassiou D. Automated anatomical labeling of activations in SPM using a macroscopic anatomical parcellation of the MNI MRI single-subject brain. Neuroimage. 2002;15(1):273-289.
[10] Marques JP, Khabipova D, Gruetter R. Studying cyto and myeloarchitecture of the human cortex at ultra-high field with quantitative imaging: R1, R2* and magnetic susceptibility. Neuroimage. 2017;147:152-163.
Figures