0933
CORTICAL THICKNESS COVARIANCE STRUCTURAL NETWORKS IN “FOCAL” EPILEPSY1Department of Neuroimaging and Interventional Radiology, National Institute of Mental Health and Neurosciences, Bengaluru, India, 2Department of Neurology, National Institute of Mental Health and Neurosciences, Bengaluru, India
Synopsis
“Focal” epilepsy is a network aberration. Network characteristics in focal epilepsy due to calcified Neurocysticercal granuloma have not been elucidated. Forty-two patients of focal epilepsy with MRI evidence of either calcified granuloma, malformation of cortical development, mesial temporal sclerosis, or no imaging abnormality were included. Group-level Cortical thickness covariance networks were generated and compared. Focal epilepsy patients (including those with calcific granuloma) had significantly reduced network global efficiency and higher nodal characteristic path length/ Clustering coefficient/ Nodal local efficiency (p<0.05). Networks in focal epilepsy (“ including those due to calcific granuloma”) have higher segregation and lesser integration.
INTRODUCTION
“Focal” epilepsy, the moniker for localization-related epilepsy (LRE), is indeed a network disorder. Neurocysticercal calcified granuloma due to Taenia solium is a common acquired cause for LRE in India. We adopted Graph Theoretical principles1 to investigate structural connectivity network patterns derived from cortical thickness covariance2 in patients with LRE. Further, we analysed the connectivity footprints of various radiopathological subsets of LRE, including those with neuroimaging evidence of calcified granulomas.METHODS
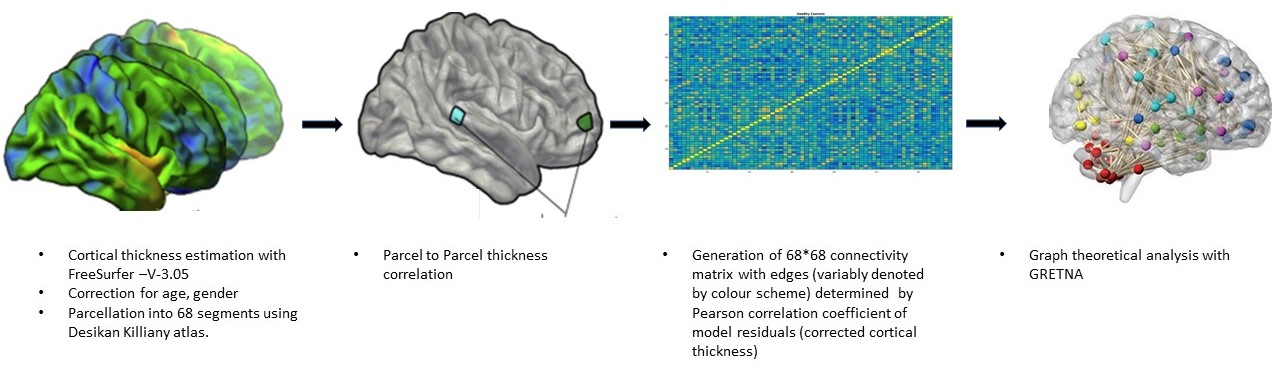
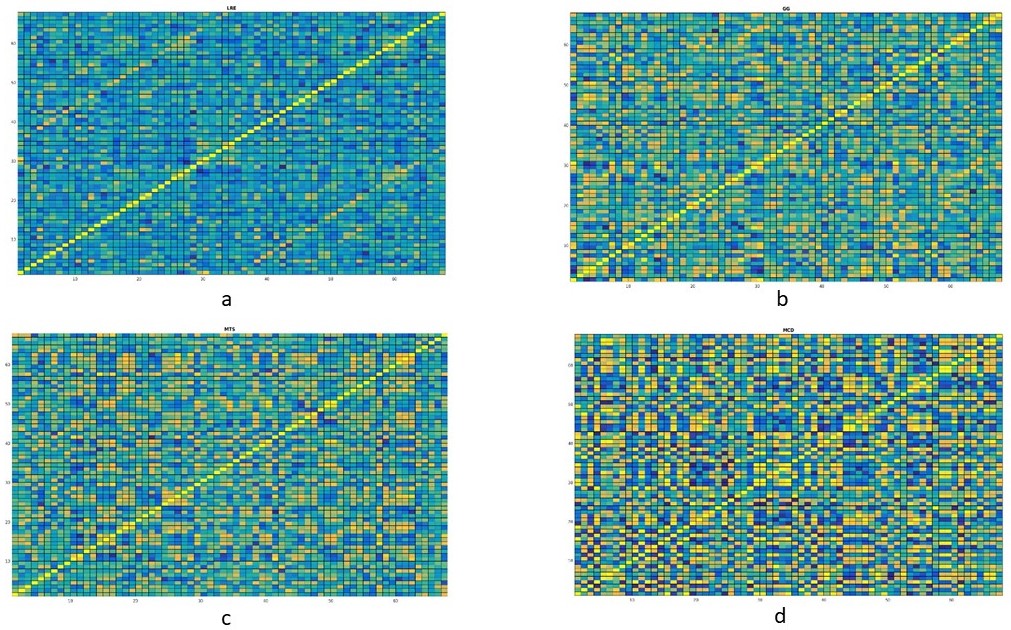
Forty-two patients (M: F = 24:18; age 25±9.5 years) with clinical profile consistent with LRE whose magnetic resonance imaging (MRI) showed concordant (electrophysiological and clinical) evidence of either calcified granuloma (CG), mesial temporal sclerosis (MTS), malformation of cortical development (MCD) or no focal imaging abnormality (MRNeg) were included. Volumetric 3-dimensional T1 MPRAGE [Magnetization Prepared Rapid Acquisition of Gradient Echo] data from subjects and 50 matched controls were acquired on a 3-Tesla system (SKYRA, Siemens, Erlangen, Germany). FreeSurfer V-3.05 3,4 was used for cortical surface reconstruction and perpendicular mean thickness estimation. Desikan‐Killiany (DK) atlas 5 was employed for parcellation of the cerebral cortex into 68 regions that served as “nodes” for graph theoretical analysis. Thickness data from each node were corrected for the effects of age, gender and total intracranial volume. Pearson correlation coefficients (rho) of model residuals for all possible pairs of regions were computed to create a single group-level adjacency matrix of size 68 × 68 for each group (i.e. cases, CG, MCD, MTS, MRNeg, controls). “Edges” were assigned based on inter-regional Pearson’s correlation of cortical thickness. Graph theoretical analysis of the matrices was done on GRETNA connectomics toolbox 6 (based on the Brain Connectivity Toolbox7)( Fig1and 2). Incremental thresholds were prescribed to result in specified network densities (i.e., the ratio of the number of currently existent network “edges” to all possible edges) with a range from 0.01 to 0.1. Measures of network segregation (“clustering coefficient”), Nodal local efficiency (global efficiency calculated on node neighbourhoods), network integration (“global efficiency” and “nodal characteristic path length: the average shortest path length in the network”), and “small worldness”( Network measure of support for both modularized and integrated information transfer) 8 were computed. Non-parametric Mann-Whitney test was used to analyse the group-level differences.RESULTS
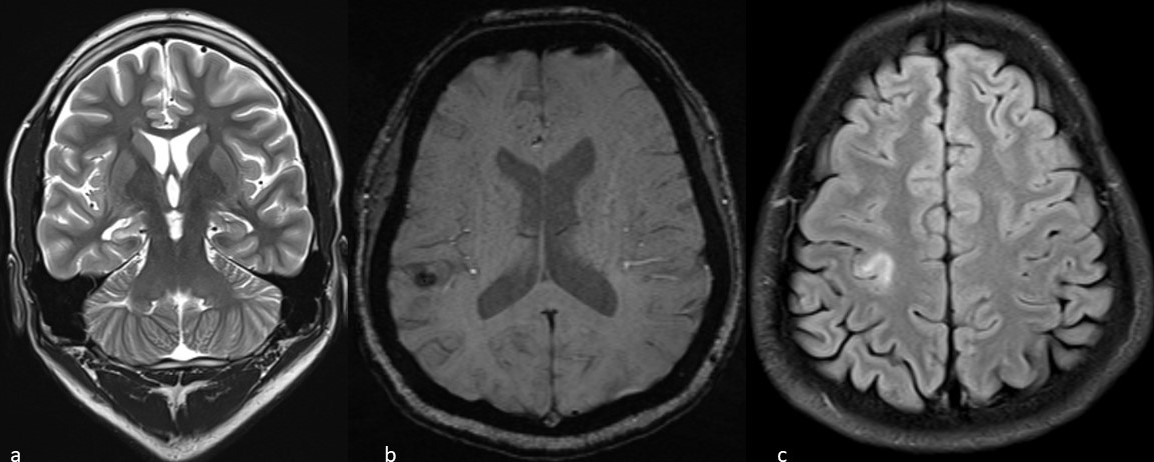
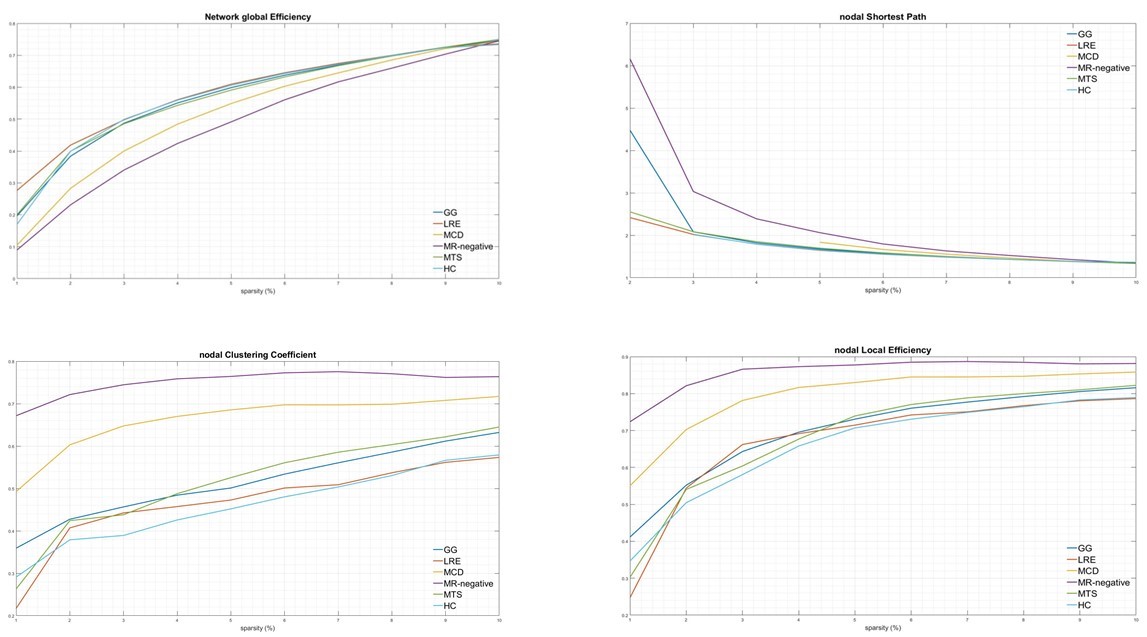
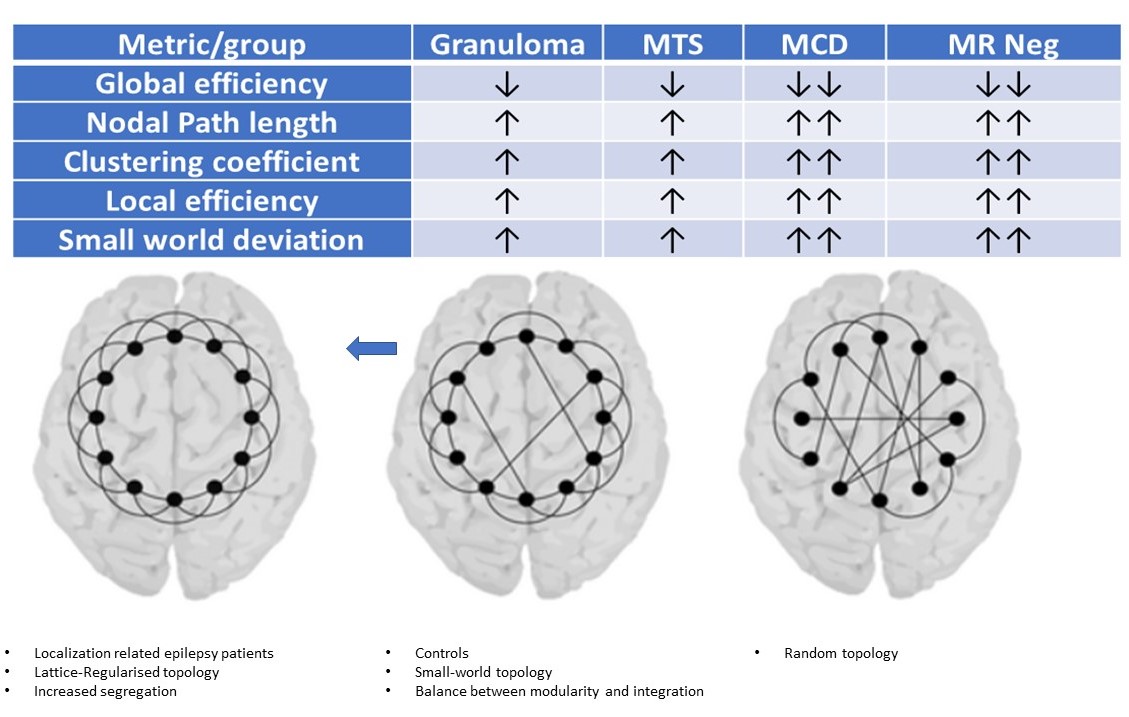
Imaging phenotypes comprised CG (n=9), MTS (n=15), MCD (n=5), and MRNeg (n=13) (Fig 3). The group-level analysis revealed significantly reduced network global efficiency in cases (including all subgroups) compared to controls at multiple thresholds (p<0.05). The deviation was most prominent in the MCD and MRNeg subgroup. Nodal characteristic path length was significantly higher (p<0.05) in cases compared to controls at multiple thresholds, with the greatest alterations in MCD and MRNeg subgroups. Clustering coefficient and nodal local efficiency were significantly higher (p<0.05) in the case population at multiple sparsities with the highest digression in MCD and MRNeg subgroups. No statistically significant differences were observed between MTS vs CG subgroups. Consistent deviations from “Small worldness” across multiple thresholds defining the small worldness range were seen in the cases compared to controls. The changes were most marked in the MRNeg and the MCD subgroups, and least pronounced in the MTS subgroup. Fig 4 depicts plots of network properties across various thresholds and a tabulated summary of findings is available in Fig 5DISCUSSION
Cortical thickness covariance-structural connectivity analysis showed a significant difference in the graph-theoretical measures in the cases group compared to the controls. Higher values of metrics of segregation, (clustering coefficient, local efficiency) and lower values of integration metrics (path length; the inverse of global efficiency) across many thresholds was the cardinal finding. The MCD subgroup showed the highest significant divergence. As covariance networks reflect harmonious inter-regional maturation 2, these changes may be explained by concerted effects of a developmental lesion on mutually linked cortical areas. Network attributes of calcified granulomas in LRE have hitherto been unexplored. Network rearrangements depicted by Graph theoretical measures in calcified granulomas followed the trend of other radiopathological entities of LRE, especially MTS. The network topological alterations have across-modality corroborates with ictal intracerebral EEG findings9,10, and scalp EEG data from absence seizures11. Multimodality observations hint that peri-ictal network hypersynchrony may modulate trophic intercortical exchanges, culminating to faulty remodelling of structural locoregional networks. Ultrastructural evidence also exists for an ensuing localised hyperconnectivity (an increased tendency for segregation) and global/remote hypoconnectivity(a decreased tendency for global integration) 12,13. Hyperconnectivity, a probable marker of increased neural resource use, is a ubiquitous response in many neurological disruptions14. Whether the “locoregional hyperconnectivity” underlies the most frequent observation of the increased network segregation is indeed a subject of consideration.CONCLUSION
Structural connectivity signature drifts in LRE towards higher segregation and lesser integration, reminiscent of a brain topology with a lattice/regularised configuration. Network alterations due to calcific granulomas being comparable to those due to mesial temporal sclerosis is a unique observation from an Indian epidemiological perspective. Network aberrations in the calcific granuloma subgroup reiterate the notion that LRE is indeed a network-level disorder, irrespective of aetiology or lesion characteristics. Remarkably, connectivity changes determined by cortical thickness covariance- derived-structural networks followed the same patterns of network abnormalities as depicted by other modalities.Acknowledgements
Colleagues and staff at Department of Neuroimaging of Interventional Radiology,National Institute of Mental Health and Neurosciences, Bengaluru for their support.
References
1. Gleichgerrcht E, Kocher M, Bonilha L. Connectomics and graph theory analyses: Novel insights into network abnormalities in epilepsy. Epilepsia. 2015 Nov;56(11):1660–8.
2. Alexander-Bloch A, Giedd JN, Bullmore E. Imaging structural co-variance between human brain regions. Nat Rev Neurosci. 2013 May;14(5):322–36.
3. Fischl B. FreeSurfer. Neuroimage. 2012 Aug 15;62(2):774–81.
4. Fischl B, Dale AM. Measuring the thickness of the human cerebral cortex from magnetic resonance images. PNAS. 2000 Sep 26;97(20):11050–5.
5. Desikan RS, Ségonne F, Fischl B, Quinn BT, Dickerson BC, Blacker D, et al. An automated labeling system for subdividing the human cerebral cortex on MRI scans into gyral based regions of interest. Neuroimage. 2006 Jul 1;31(3):968–80.
6. Wang J, Wang X, Xia M, Liao X, Evans A, He Y. GRETNA: a graph theoretical network analysis toolbox for imaging connectomics. Front Hum Neurosci [Internet]. 2015 [cited 2018 Nov 19];9. Available from: https://www.frontiersin.org/articles/10.3389/fnhum.2015.00386/full
7. Rubinov M, Sporns O. Complex network measures of brain connectivity: Uses and interpretations. NeuroImage. 2010 Sep;52(3):1059–69.
8. Bullmore E, Sporns O. Complex brain networks: graph theoretical analysis of structural and functional systems. Nature Reviews Neuroscience. 2009 Mar;10(3):186–98.
9. Ponten SC, Bartolomei F, Stam CJ. Small-world networks and epilepsy: Graph theoretical analysis of intracerebrally recorded mesial temporal lobe seizures. Clinical Neurophysiology. 2007 Apr 1;118(4):918–27.
10. Kramer MA, Kolaczyk ED, Kirsch HE. Emergent network topology at seizure onset in humans. Epilepsy Res. 2008 May;79(2–3):173–86.
11. Ponten SC, Douw L, Bartolomei F, Reijneveld JC, Stam CJ. Indications for network regularization during absence seizures: weighted and unweighted graph theoretical analyses. Exp Neurol. 2009 May;217(1):197–204.
12. Netoff TI, Clewley R, Arno S, Keck T, White JA. Epilepsy in small-world networks. J Neurosci. 2004 Sep 15;24(37):8075–83.
13. Dyhrfjeld-Johnsen J, Santhakumar V, Morgan RJ, Huerta R, Tsimring L, Soltesz I. Topological determinants of epileptogenesis in large-scale structural and functional models of the dentate gyrus derived from experimental data. J Neurophysiol. 2007 Feb;97(2):1566–87.
14. Hillary FG, Roman CA, Venkatesan U, Rajtmajer SM, Bajo R, Castellanos ND. Hyperconnectivity is a fundamental response to neurological disruption. Neuropsychology. 2015;29(1):59–75.
Figures