0932
Visualization enhancement and quantitative analysis of relaxation time in medial temporal lobe epilepsy based on 3D high-resolution MRF1Center for Brain Imaging Science and Technology, Department of Biomedical Engineering, Zhejiang University, Hangzhou, China, 2Athinoula A. Martinos Center for Biomedical Imaging, Massachusetts General Hospital, charlestown, MA, United States, 3Department of Radiology, Harvard Medical School, charlestown, MA, United States, 4Department of Neurology, the First Affiliated Hospital, School of Medicine, Zhejiang University, Hangzhou, China
Synopsis
We propose to use a 3D MRF technique with multi-axis spiral projection acquisition to achieve 3D high-resolution whole-brain quantitative imaging for patients with MTLE. Isotropic 1-mm resolution relaxivity maps were achieved within 5 minutes. By incorporating Freesurfer’s automatic subcortical segmentation, a whole-brain subcortical segmentation was obtained, enabling feasible and subjective quantitative analysis for each substructure. Additionally, volume information of the substructure was obtained during the process.
Introduction
Hippocampal sclerosis (HS) is a common pathology underling mesial temporal lobe epilepsy (MTLE). Our previous works have demonstrated that the magnetic resonance fingerprinting (MRF) technique1-3 could identify the significant variation of relaxation time between MTLE patients and healthy controls and improve the diagnosis of patients with MTLE4,5. However, a limitation of our previous work is its comparatively low resolution and SNR, since the data was acquired by using a 2D MRF sequence with resolution of 1.2×1.2×3 mm3. In addition, the regions of interest (ROIs) were manually segmented by neurologists, which makes the corresponding quantitative analysis constrained and limited to very few regions.In this work, we propose to use a 3D MRF technique with multi-axis spiral projection acquisition (3D-maSPI-MRF6) to achieve 3D high-resolution (1×1×1 mm3) whole-brain quantitative imaging for patients with MTLE. By incorporating Freesurfer’s automatic subcortical segmentation, a whole-brain subcortical segmentation was obtained, enabling feasible and subjective quantitative analysis for each substructure. Additionally, volume information of the substructure was obtained during the process.
Method
A total of 51 MTLE patients, who have been diagnosed with HS based on clinic presentation and EEG, participated in this study (22/29 male/female; 17/34 right-/ left-sided lesions; mean age 31.18 years; age range 16-47 years). And six healthy volunteers were also recruited for reference. All patients and volunteers were recruited from the epilepsy clinic of the First Affiliated Hospital, School of Medicine, Zhejiang university between March 21, 2018 and September 21, 2019. This study was approved by the institutional review board. Written informed consent was obtained from each participant or from a legal representative.For each 3D-maSPI-MRF scan, a total of 30 acquisition groups were acquired with 500 time points per acquisition group. Other scan parameters: TI=20ms, TE=2.5ms, TR=16ms, waiting time between adjacent acquisition groups Twait=2s, flip angles vary from 5° to 82°. The isotropic resolution of 1 mm and FOV of 240 mm were achieved within a total acquisition time of 5 minutes. By using a sliding-windowed 3D INUFFT operator, the acquired data were transformed to a series of image frames and then template matched to a pre-calculated MRF dictionary to generate the T1, T2 and proton density maps.
As shown in Figure 1, with obtained quantitative maps, the substructure segmentation was generated by the following steps: i. proton density map was used for generating an image mask with proper signal intensity threshold; ii. the T1 map was used for generating a T1-weighted image by Bloch simulation; iii. the masked T1-weighted image was imported into Freesurfer to derive the substructure segmentation map. With the segmentation map, visualization of target substructure and the statistic analysis of each subcortical mass was performed.
Results
Figure 2 shows the T1 (a) and T2 (b) maps of a left-sided MTLE-HS patient in transverse and coronal view, respectively. The red boxes are zoomed views of left and right hippocampus segmented by the Freesurfer toolbox. It could be seen that both the T1 and T2 values of left hippocampus were higher than the right counterparts (average T1/T2 values: 1571.7/82.5 ms versus 1480.7/69.2 ms). The distribution of T1 and T2 values of the left and right hippocampus were shown in Figure 2(c) in red and blue lines respectively. This observation is in accordance with our previous study. However, as shown in Figure 3, in more superior and posterior slices, the difference was hardly observed (average T1/T2 values of left and right hippocampus: 1458.4/74.7 ms versus 1472.6/77.28 ms). The distribution of T1 and T2 values in these regions also show the similarity on two sides of hippocampus. It demonstrates that the HS lesion could be focused only on limited parts of the hippocampus, which would hardly be located correctly if the resolution is not sufficient.Table 1 shows the average T1/T2 values and volume proportion of right/left-sided HS patients and healthy controls in different substructures and tissues. It could be found that compared to healthy controls, the T2 values are increased (65.6 ms versus 62.0 ms) while the volume proportion are decreased (0.36% versus 0.38%) in left hippocampus for left-sided HS. Similarly, the T2 values are increased (71.6 ms versus 66.9 ms) while the volume proportion are decreased (0.36% versus 0.41%) in left hippocampus for left-sided HS. This phenomenon could also be observed when compared to their contralateral counterparts.
Discussion and Conclusion
By using the 3D-maSPI-MRF sequence, a fast whole-brain high-resolution quantitative parametric mapping could be achieved for MTLE-HS patients with 1-mm isotropic resolution and acquisition time of 5 minutes. Incorporating Freesurfer’s automatic subcortical segmentation, the visualization of quantitative imaging in target regions such as hippocampus could be further improved and it also enable efficient quantitative analysis of ROIs without time-consuming manual segmentation. In accordance with our previous studies, the results of this study indicate longer T2 values in the ipsilateral hippocampus of the HS. But in addition, due its higher resolution, more specific HS regions could be further located. More detailed analysis on the T1/T2 changes in other substructure would be completed in our future work.Acknowledgements
No acknowledgement found.References
1.Ma D, Gulani V, Seiberlich N, Liu K, Sunshine JL, Duerk JL, Griswold MA. Magnetic resonance fingerprinting. Nature 2013;495(7440):187-192.
2. Jiang Y, Ma D, Seiberlich N, Gulani V, Griswold MA. MR fingerprinting using fast imaging with steady state precession (FISP) with spiral readout. Magn Reson Med 2015;74(6):1621-1631.
3. Cao X, Liao C, Wang Z, Chen Y, Ye H, He H, Zhong J. Robust sliding-window reconstruction for Accelerating the acquisition of MR fingerprinting. Magn Reson Med 2017;78(4):1579-1588.
4. Liao C, Wang K, Cao X, Li Y, Wu D, Ye H, Ding Q, He H, Zhong J. Detection of Lesions in Mesial Temporal Lobe Epilepsy by Using MR Fingerprinting. Radiology 2018;288(3):804-812.
5. Wang K, Cao X, Wu D, Liao C, Zhang J, Ji C, Zhong J, He H, Chen Y. Magnetic resonance fingerprinting of temporal lobe white matter in mesial temporal lobe epilepsy. Ann Clin Transl Neurol 2019;6(9):1639-1646.
6. Cao X, Ye H, Liao C, Li Q, He H, Zhong J. Fast 3D brain MR fingerprinting based on multi-axis spiral projection trajectory. Magn Reson Med 2019;82(1):289-301.
Figures
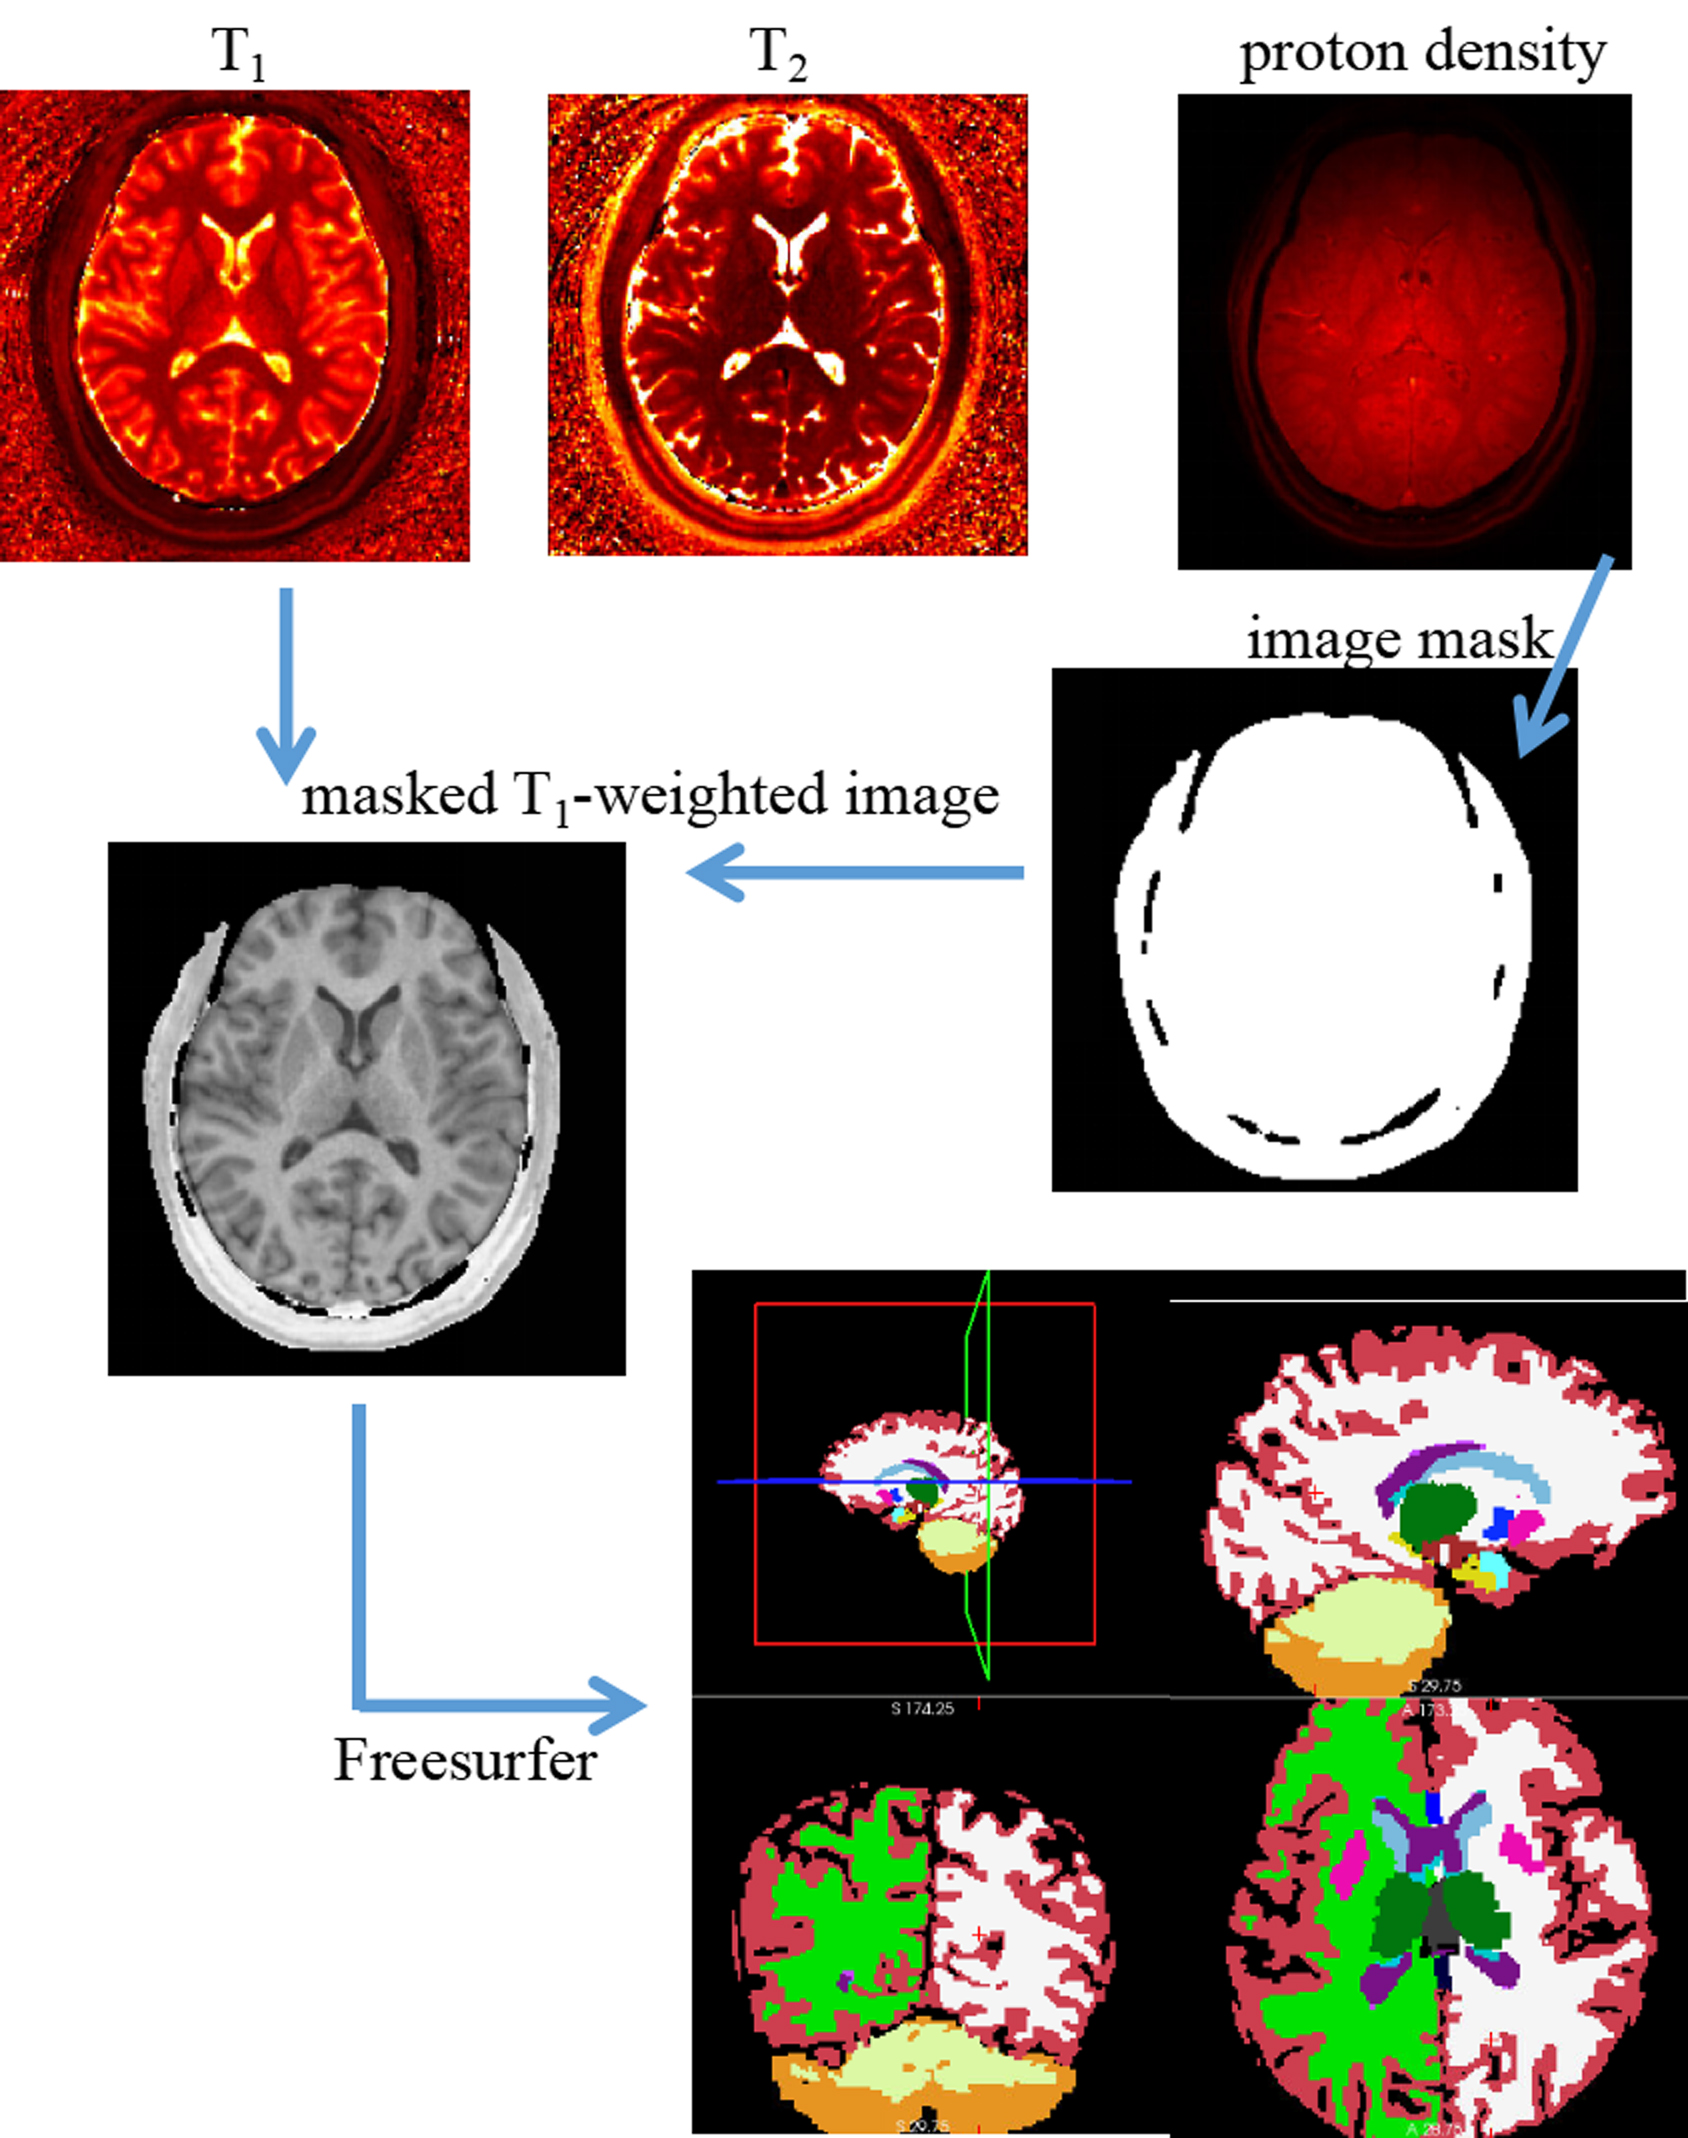
Figure 1.
The flow chart of Freesurefer’s automatic subcortical segmentation based on quantitative maps acquired by MRF.
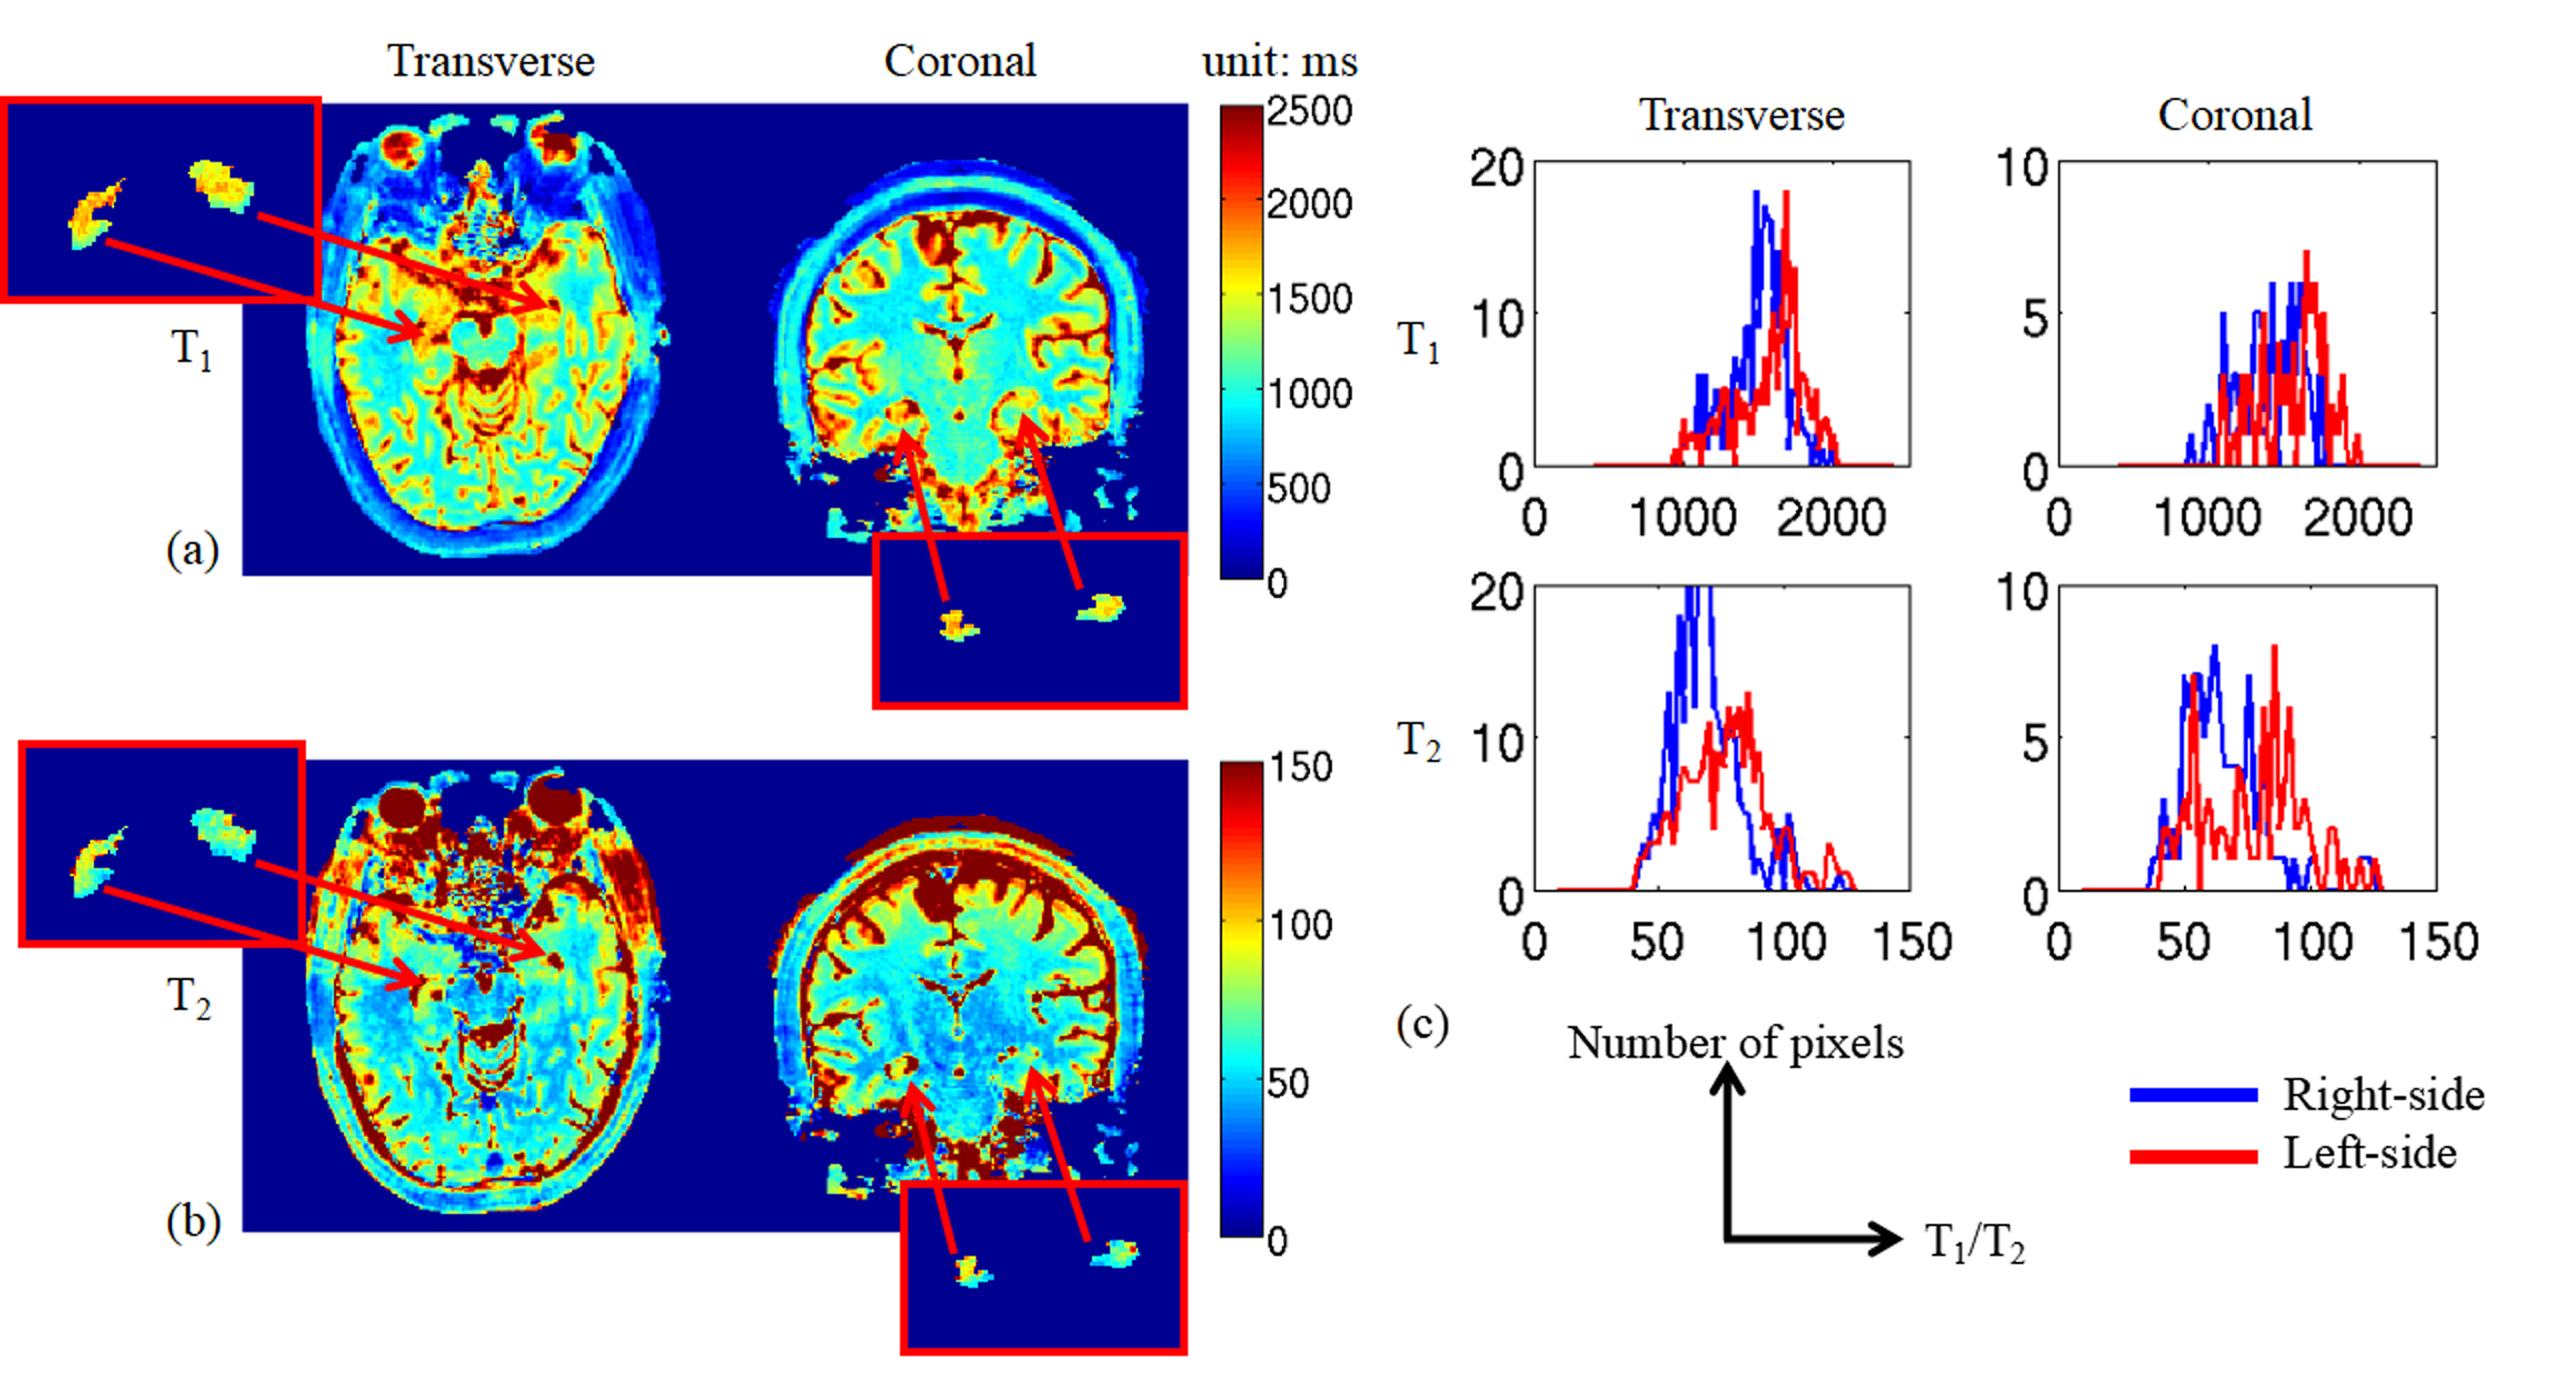
Figure 2.
T1 (a) and T2 (b) maps by using MRF. Zoomed views (red boxes) and distribution plots (c) of two-sided hippocampus are also listed.
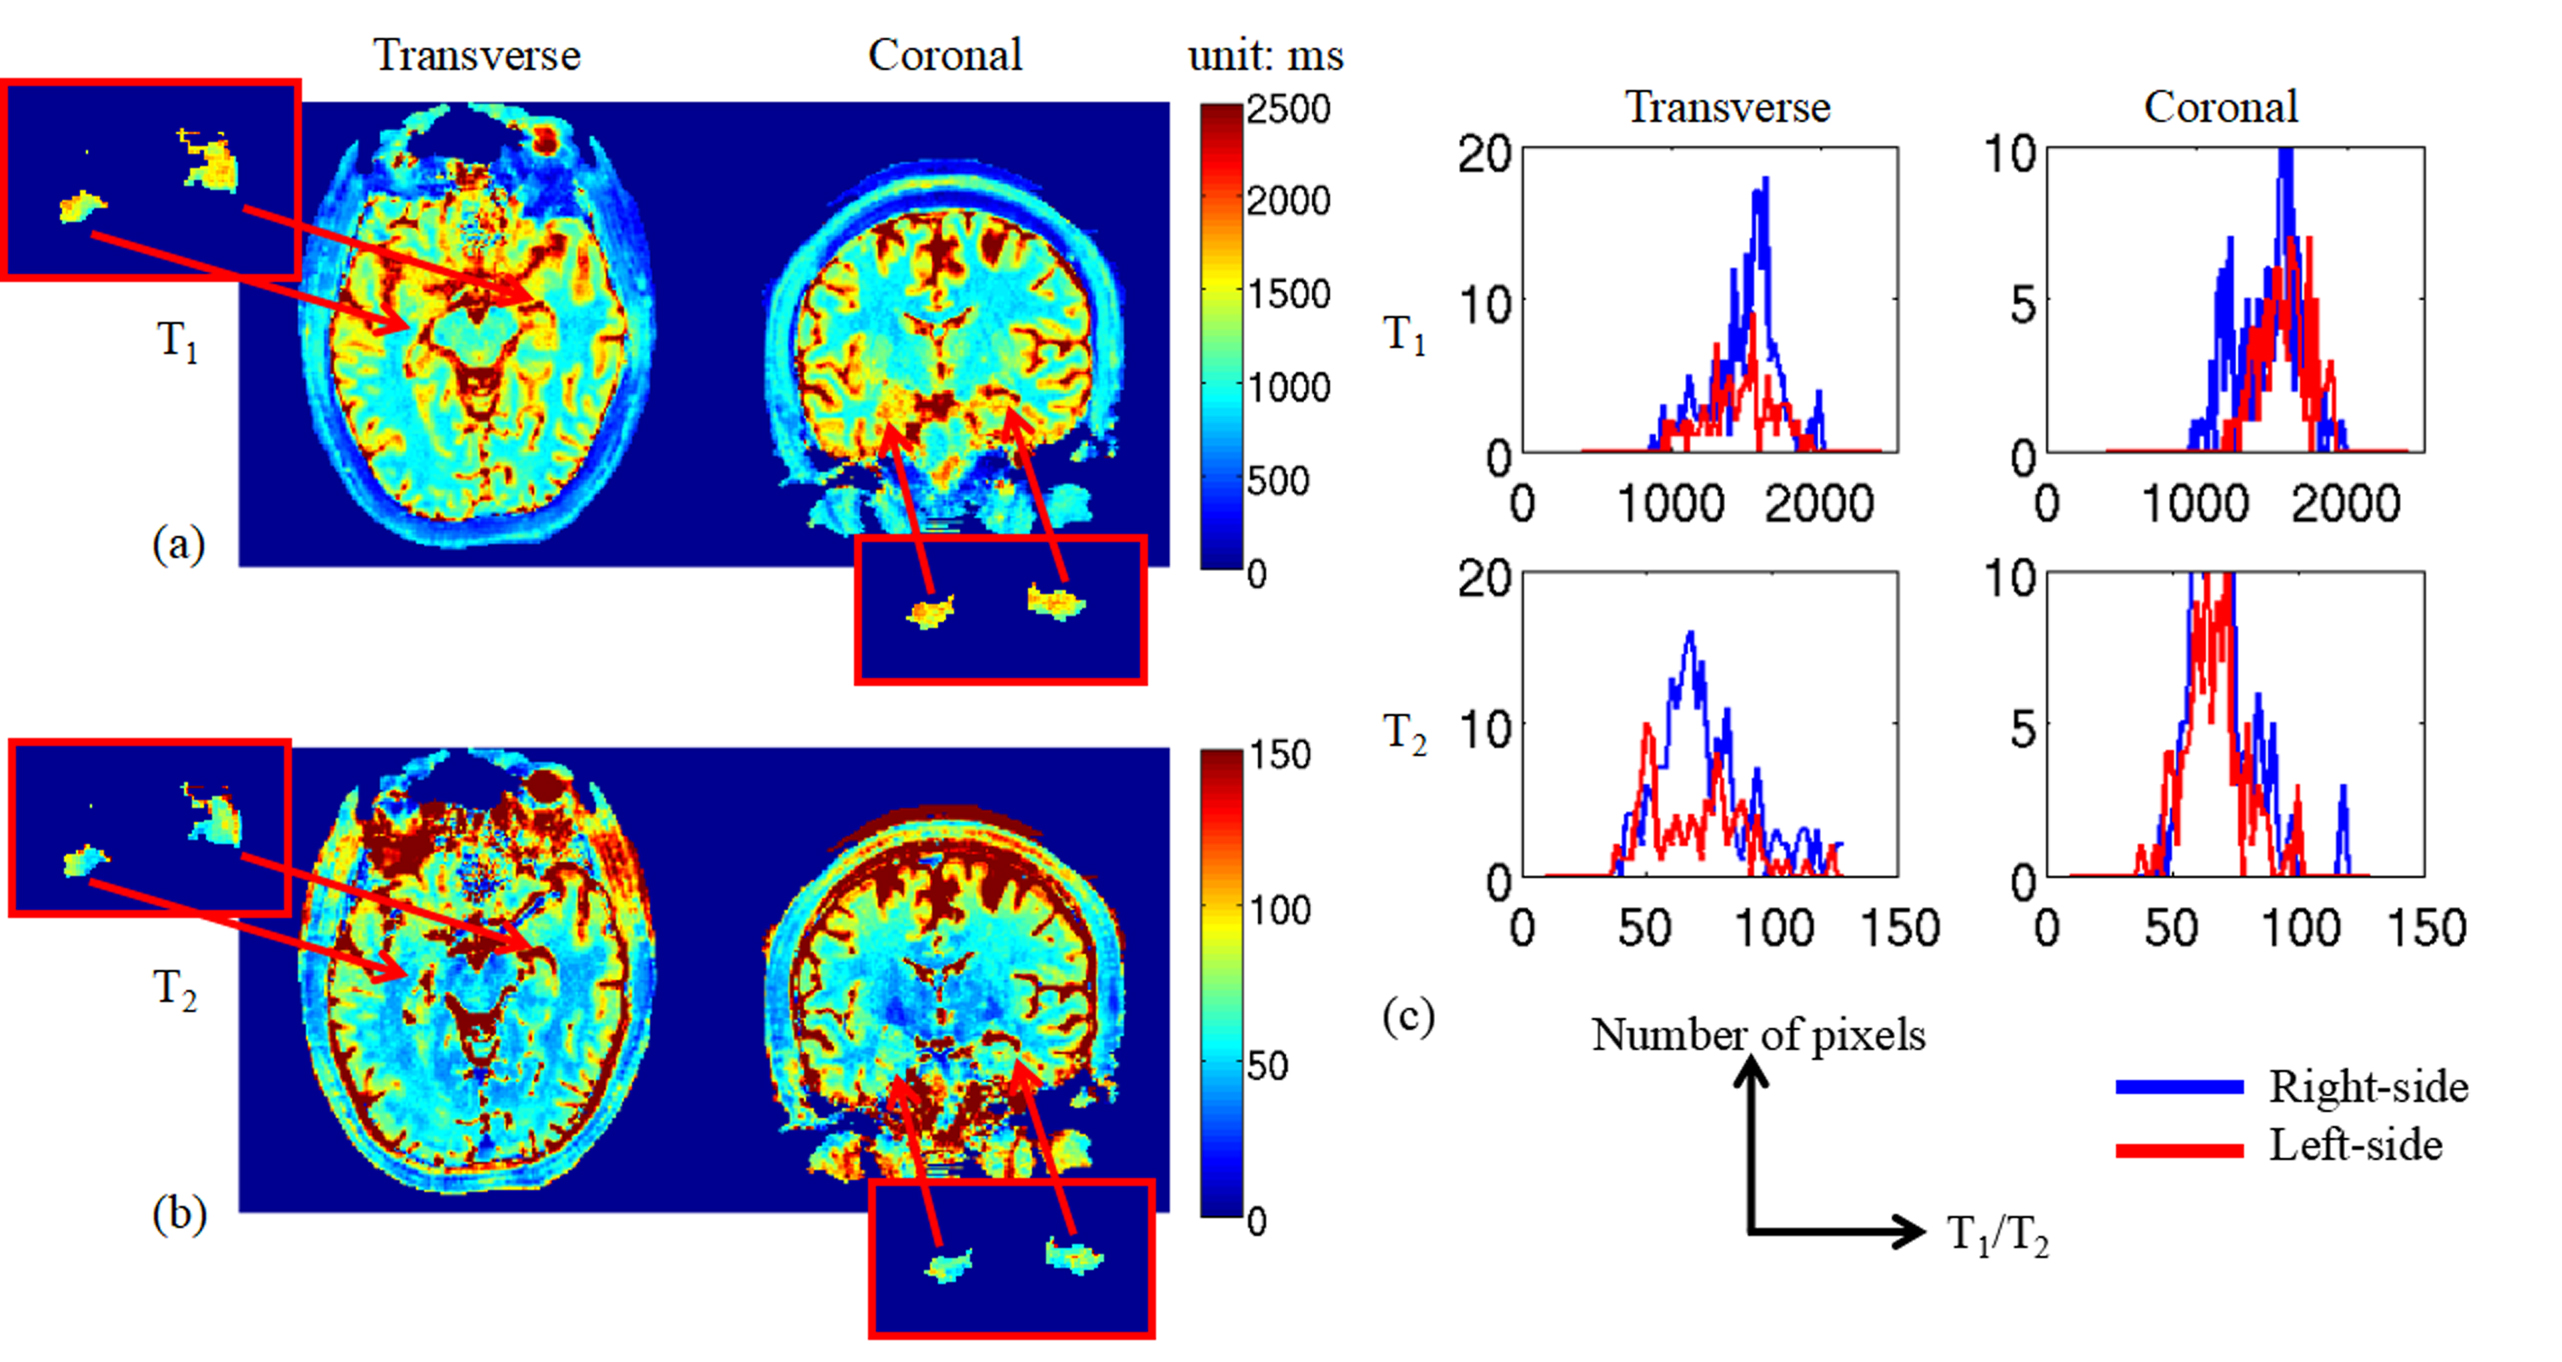
Figure 3.
T1 (a) and T2 maps but of more superior and posterior slices compared to Figure 2. Zoomed views (red boxes) and distribution plots (c) of two-sided hippocampus are also listed.
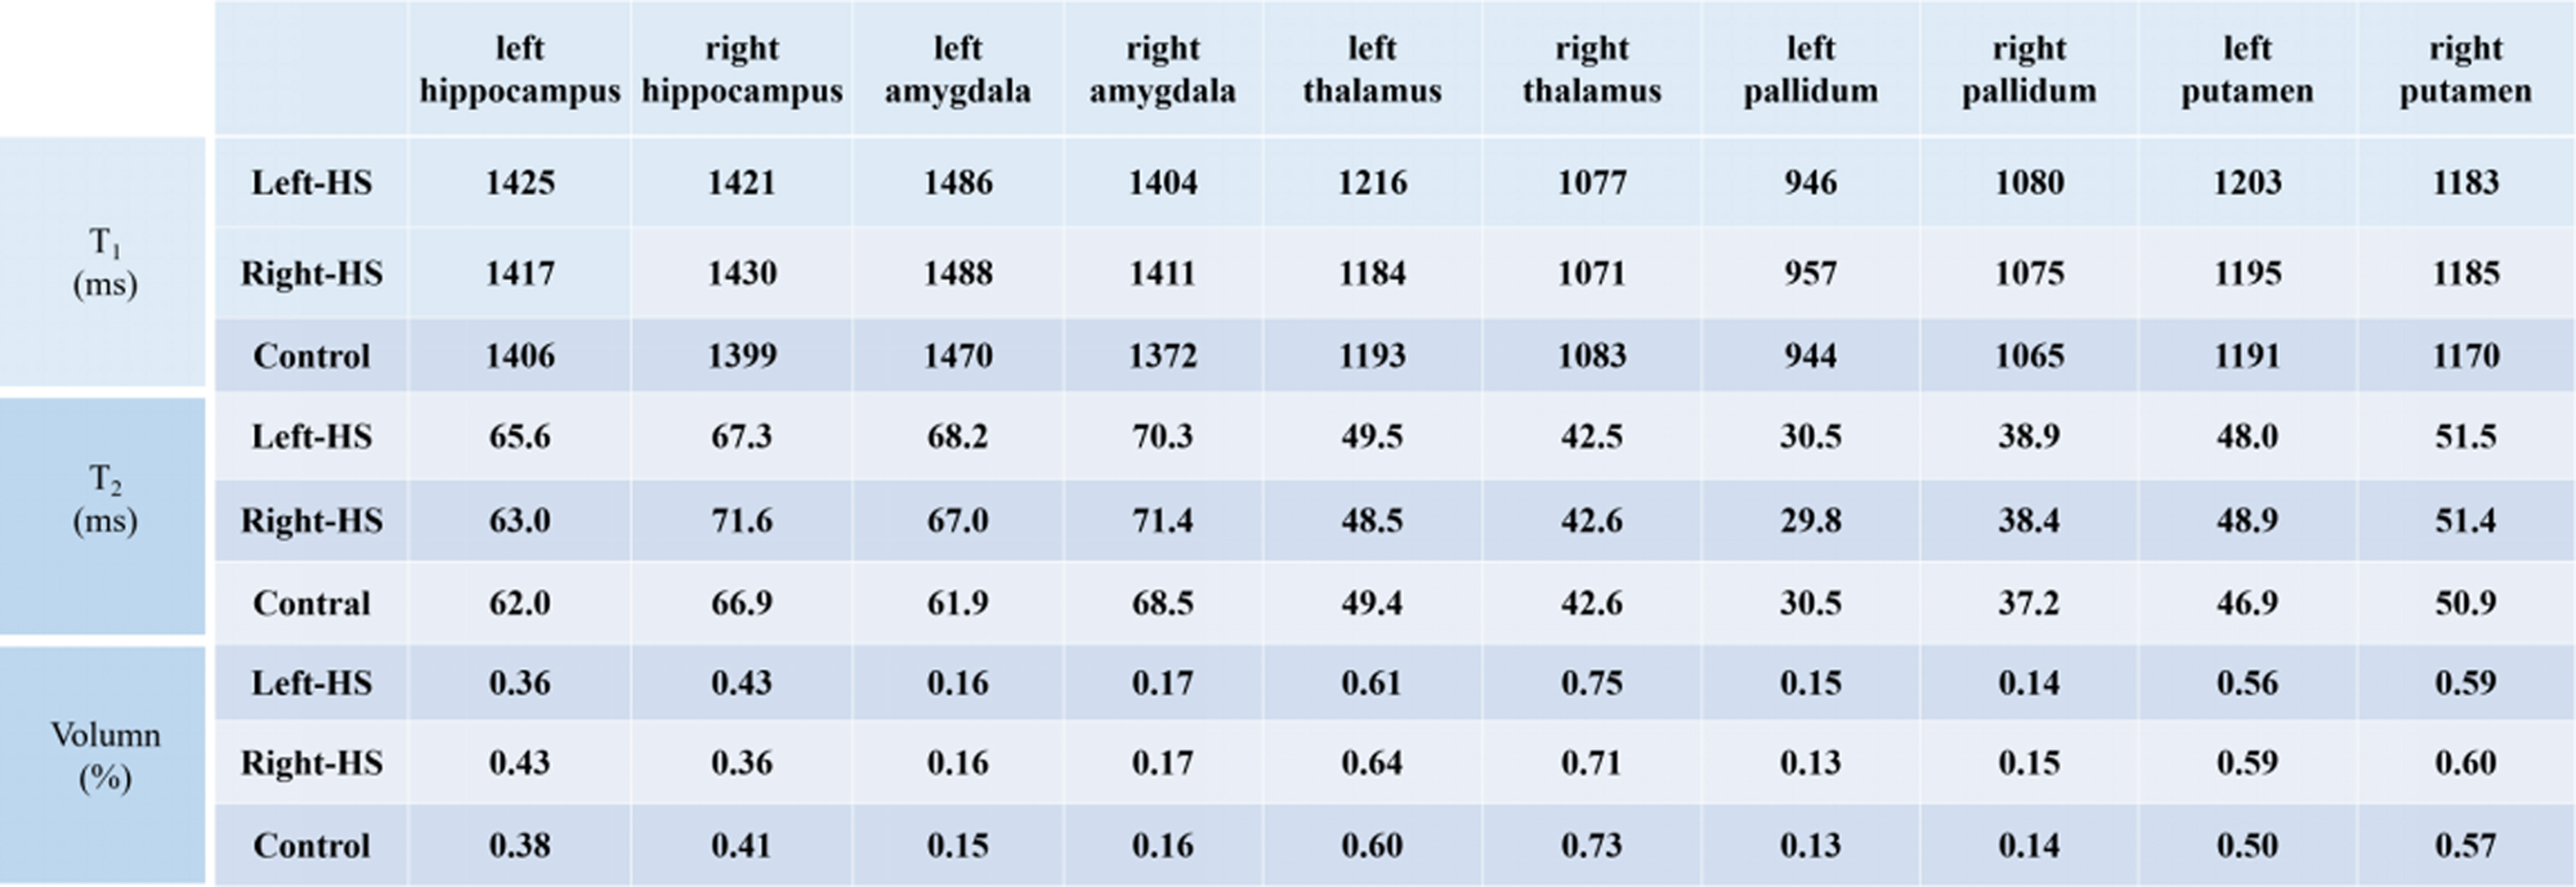
Table 1.
Average T1/T2 values and volume proportion (as ratio to all cerebral cortex) of right/left-sided HS patients and healthy controls in different substructures and tissues.