0929
Simultaneous 18F-FDG-PET and 1H-MRSI Metabolic Imaging in Epilepsy Patients: A Feasibility Study
Hui Huang1, Miao Zhang2, Rong Guo3,4, Yudu Li3,4, Yibo Zhao3,4, Jialin Hu1, Hongping Meng2, Xinyun Huang2, Xiaozhu Lin2, Wei Liu5, Biao Li2, Bomin Sun5, Yao Li1, Zhi-Pei Liang3,4, and Jie Luo1
1Institute of Medical Imaging Technology, School of Biomedical Engineering, Shanghai Jiao Tong University, Shanghai, China, 2Department of Nuclear Medicine, Ruijin Hospital, Shanghai Jiao Tong University School of Medicine, Shanghai, China, 3Department of Electrical and Computer Engineering, University of Illinois at Urbana Champaign, Urbana, IL, United States, 4Beckman Institute for Advanced Sciences and Technology, University of Illinois at Urbana Champaign, Urbana, IL, United States, 5Department of Functional Neurosurgery, Ruijin Hospital, Shanghai Jiao Tong University School of Medicine, Shanghai, China
1Institute of Medical Imaging Technology, School of Biomedical Engineering, Shanghai Jiao Tong University, Shanghai, China, 2Department of Nuclear Medicine, Ruijin Hospital, Shanghai Jiao Tong University School of Medicine, Shanghai, China, 3Department of Electrical and Computer Engineering, University of Illinois at Urbana Champaign, Urbana, IL, United States, 4Beckman Institute for Advanced Sciences and Technology, University of Illinois at Urbana Champaign, Urbana, IL, United States, 5Department of Functional Neurosurgery, Ruijin Hospital, Shanghai Jiao Tong University School of Medicine, Shanghai, China
Synopsis
PET and MRSI could provide metabolic information of the epileptogenic zone, which could add value to presurgical planning of epilepsy patients. This study investigated the feasibility of simultaneous high-resolution MRSI and 18F-FDG-PET for whole brain imaging in epilepsy patients, and studied the correlation between metabolic changes found in MRSI and hypometabolism found in FDG-PET. Our experimental results showed a decrease in NAA and an increase in Cho, concomitant with low FDG uptake.
Introduction
Accurate localization of epileptogenic zone is critical for optimal presurgical planning of epilepsy patients1,2. Both MRS/MRSI and FDG-PET have long been recognized as potentially powerful imaging tools to detect and visualize the metabolic abnormalities3,4, providing different but complementary metabolic information. For example, decreased NAA and increased Cho (measured by MRSI) and low FDG uptakes (measured by PET) are among the most common findings of brain metabolic changes associated with epilepsy5,6. However, most of the existing MRSI and PET studies on epilepsy were performed separately, which limited utilization of the information from both modalities simultaneously. Moreover, the traditional MRSI techniques are also limited by their low resolution, small coverage (single-voxel or single slice) and long acquisition time. In this study, we investigated the feasibility of simultaneous PET/MR whole brain 3D high-resolution metabolic imaging of epilepsy using a newly developed MRSI technique called SPICE (SPectroscopic Imaging by exploiting spatiospectral CorrElation)7,8 on a PET/MR scanner. With the simultaneously acquired high-resolution MR metabolic maps (2.0 × 3.0 × 3.0 mm3) and PET images (voxel size 2.0 × 2.0 × 2.0 mm3), we observed metabolic changes from MRSI in the epileptogenic zone, such as NAA decrease, which were consistent with hypometabolism region defined by FDG-PET.Methods
Data acquisition:In this IRB approved study, five extratemporal lobe epilepsy patients and thirty age matched healthy volunteers were recruited, and the PET and MRSI scans were performed on a PET/MR scanner (Biograph mMR; Siemens Healthcare, Erlangen, Germany) at Ruijin Hospital, Shanghai, China. All five patients had SEEG diagnosis and their patient demographics are listed in Table 1. The epileptogenic zones of patients #1 and #2 were further confirmed by post-operative histopathology findings as a follow up of the imaging study. The PET images were obtained at 15 minutes post a bolus injection of 18F-FDG-PET (mean dose of 3.7 MBq/kg, voxel size = 2.0 × 2.0 × 2.0 mm3, matrix size = 344 × 344, 127 slices). The MR experimental protocols included high-resolution MRSI scans using SPICE (2.0 × 3.0 × 3.0 mm3, FOV = 240 × 240 × 72 mm3, TR/TE = 160/1.6 ms, 7 minutes) and T1-weighted anatomical images using MPRAGE (1.0 × 1.0 × 1.0 mm3, TR/TE = 1900/2.44 ms, matrix size = 256 × 256, 192 slices).
Data processing and data analysis:
PET image preprocessing and statistical analysis were performed using SPM12 (Wellcome Department of Cognitive Neurology, University College London, London, UK) in Matlab (MathWorks, Natick, MA). The FDG uptakes (SUVRs) were obtained using intensity normalization by grand mean scaling of PET images, and were spatially normalized into the Montreal Neurological Institute (MNI) space. The brain tissue hypometabolism, indicated by low FDG uptake, was obtained by comparing patients’ SUVR with the SUVR of the healthy control group at pixel level by a two-sample t-test (8 mm kernel smoothed, family-wise error (FWE) corrected P < 0.05)9. Reconstruction of the MRSI spatiospectral function was performed using a union-of-subspaces model, incorporating pre-learned spectral basis functions as described in previous publications7,8,10. Then, the spectral quantification was done using an improved LCModel-based algorithm that incorporated both spatial and spectral priors11, which generated metabolite maps of NAA, Cho, Cr, and NAA/(Cho + Cr) ratio. Paired t‐test was used to compare metabolic changes in lesions with their contralateral brain regions across all patients.
Results and Discussion
In all subjects, the estimated brain regions of hypometabolism indicated by low FDG uptake in PET data are in agreement with their SEEG diagnosis. Figure 1 shows a region in the right postcentral gyrus of patient #2, which manifests as a relatively well-defined area of hypometabolism. The high-resolution NAA, Cho, Cr and NAA/(Cho+Cr) ratio maps of the same patient are shown in Figure 2, where the reduction of NAA and NAA/(Cho+Cr) can be found in the same areas of hypometabolism. In a quantitative comparison of the hypometabolic region against the contralateral side, the decrease in NAA and increases in Cho are clearly shown in the spatially resolved MR spectra (Figure 3A) as well as in the voxel-wise statistical analysis (Figure 3B). These findings are consistent with intracortical neuronal damage and gliosis found in the post-operative histopathology exam. Furthermore, the hypometabolic regions show consistent NAA/Cr reduction (P < 0.05) as well as SUVR reduction (P < 0.01) across all five patients in comparison with their contralateral region (Figure 4). Cho/Cr tends to increase in the hypometabolic regions though not significant, which may due to the limited number of patients included. These brain metabolic alterations found in the epileptogenic zone in 1H-MRSI and 18F-FDG-PET images are in general agreement with the findings from previous studies5,6.Conclusions
We have successfully performed a feasibility study on using simultaneous high-resolution 1H-MRSI and 18F-FDG-PET to study the brain metabolic alterations of five extratemporal lobe epilepsy patients. In the SEEG diagnosed epileptogenic zone, the PET data indicate tissue hypometabolism while 1H-MRSI data show a decrease in NAA, and an increase in Cho. These findings may lay a foundation for further investigation of the epileptogenic zone using joint PET/MRSI metabolite imaging.Acknowledgements
This study is supported by Ministry of Science and Technology of China (No. 2017YFC0109002).References
- Duncan JS, Winston GP, Koepp MJ, et al. Brain imaging in the assessment for epilepsy surgery. Lancet Neurol. 2016;15(4):420-433.
- Spencer DD, Gerrard JL, Zaveri HP. The roles of surgery and technology in understanding focal epilepsy and its comorbidities. Lancet Neurol. 2018;17(4):373-382.
- Pan JW, Kuzniecky RI. Utility of magnetic resonance spectroscopic imaging for human epilepsy. Quant Imaging Med Surg. 2015;5(2):313-31322.
- Zijlmans M, Zweiphenning W, van Klink N. Changing concepts in presurgical assessment for epilepsy surgery. Nat Rev Neurol. 2019;15(10):594-606.
- Obenaus A. Neuroimaging biomarkers for epilepsy: Advances and relevance to glial cells. Neurochem Int. 2013;63(7):712-718.
- Pittau F, Grouiller F, Spinelli L, et al. The role of functional neuroimaging in pre-surgical epilepsy evaluation. Front Neurol. 2014;5.
- Lam F, Liang ZP. A subspace approach to high-resolution spectroscopic imaging. Magn Reson Med. 2014;71(4):1349-1357.
- Lam F, Ma C, Clifford B, et al. High-resolution 1H-MRSI of the brain using SPICE: Data acquisition and image reconstruction. Magn Reson Med. 2016;76(4):1059-1070.
- Cahill V, Sinclair B, Malpas CB, et al. Metabolic patterns and seizure outcomes following anterior temporal lobectomy. Ann Neurol. 2019;85(2):241-250.
- Ma C, Lam F, Johnson CL, et al. Removal of Nuisance Signals from Limited and Sparse 1H MRSI Data Using a Union-of-Subspaces Model. Magn Reson Med. 2016;75(2):488-497.
- Li Y, Lam F, Clifford B, et al. A subspace approach to spectral quantification for MR spectroscopic imaging. IEEE Trans Biomed Eng. 2017;64(10):2486-2489.
Figures
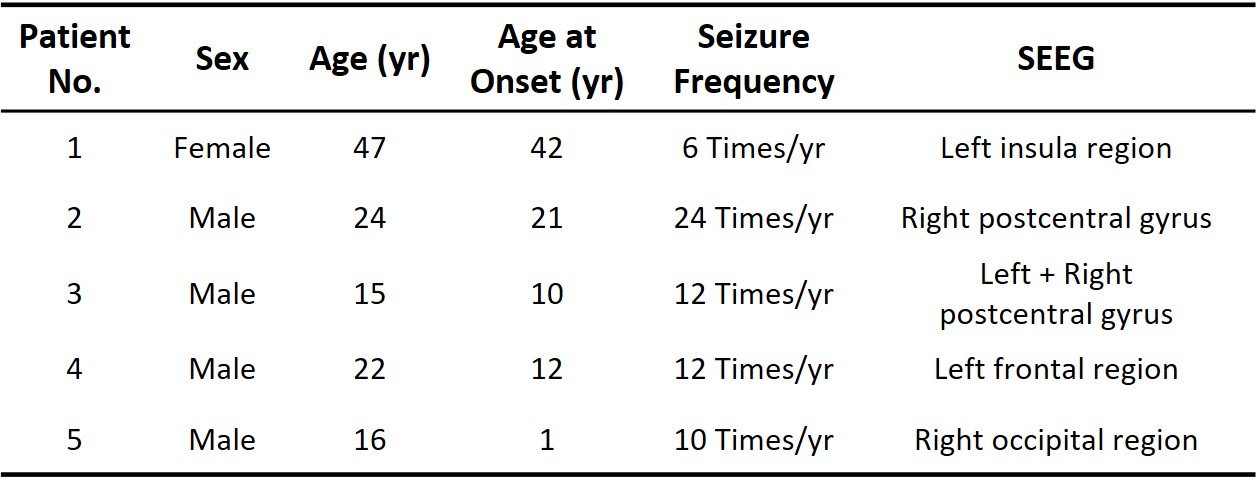
Table 1: Patient
Demographics.
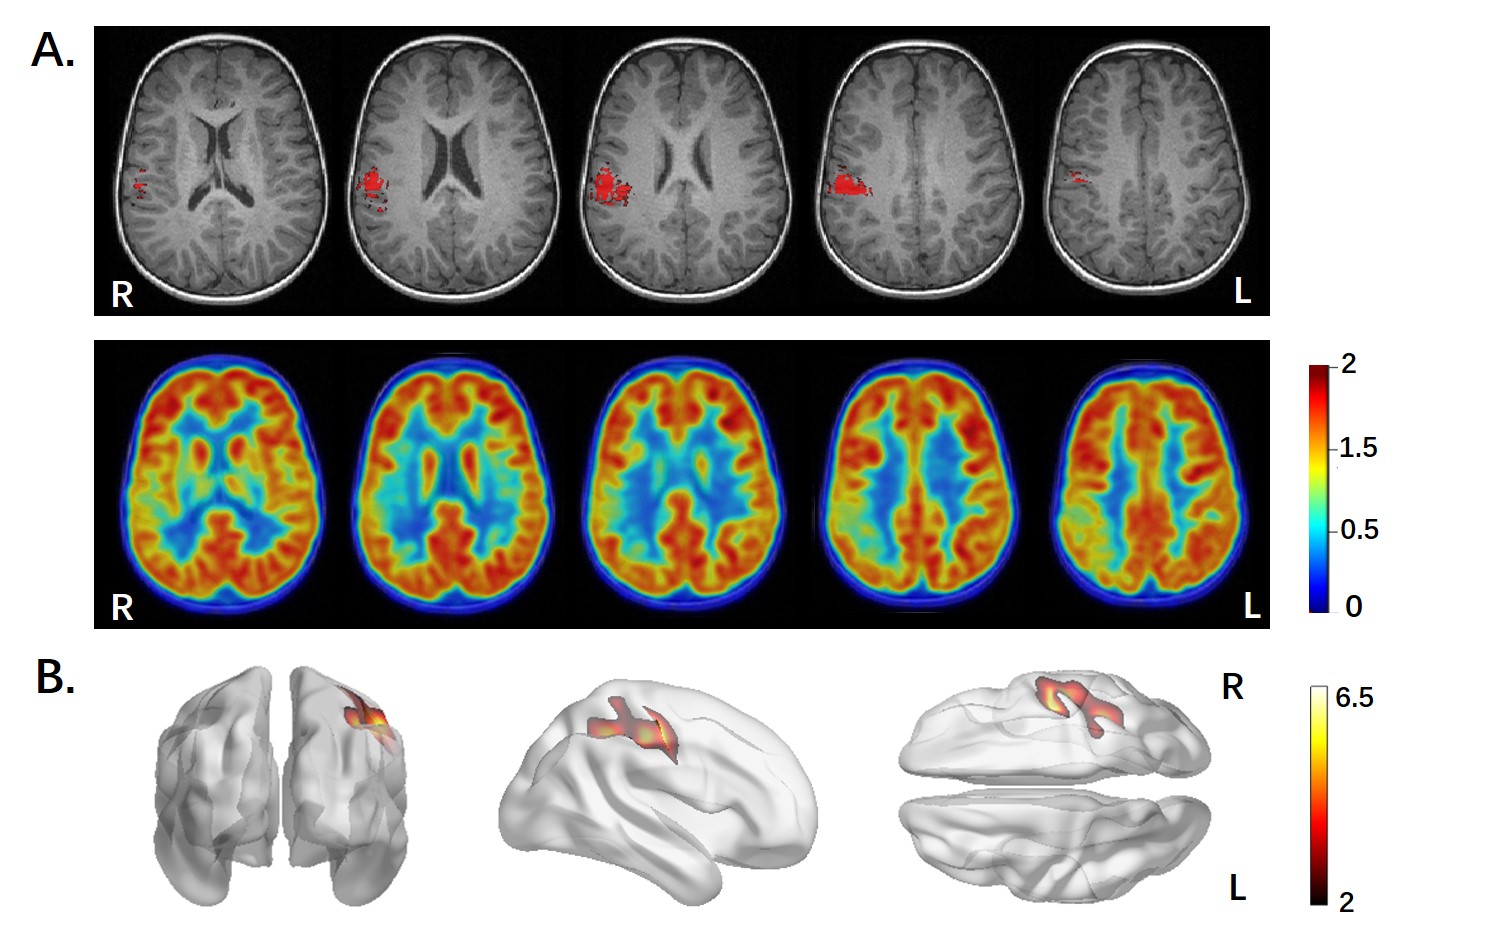
Figure 1: Hypometabolism in the postcentral gyrus indicated
by 18F-FDG-PET in patient #2. A) The first row is
structural T1w-MPRAGE, with a hypometabolic region highlighted in red; the
second row is the PET image (SUVR). B) Hypometabolic region determined by
two-sample t-test (corrected P < 0.05, cluster > 200 voxels), which is
projected on a 3D normalized imaging template. L = left; R = right.
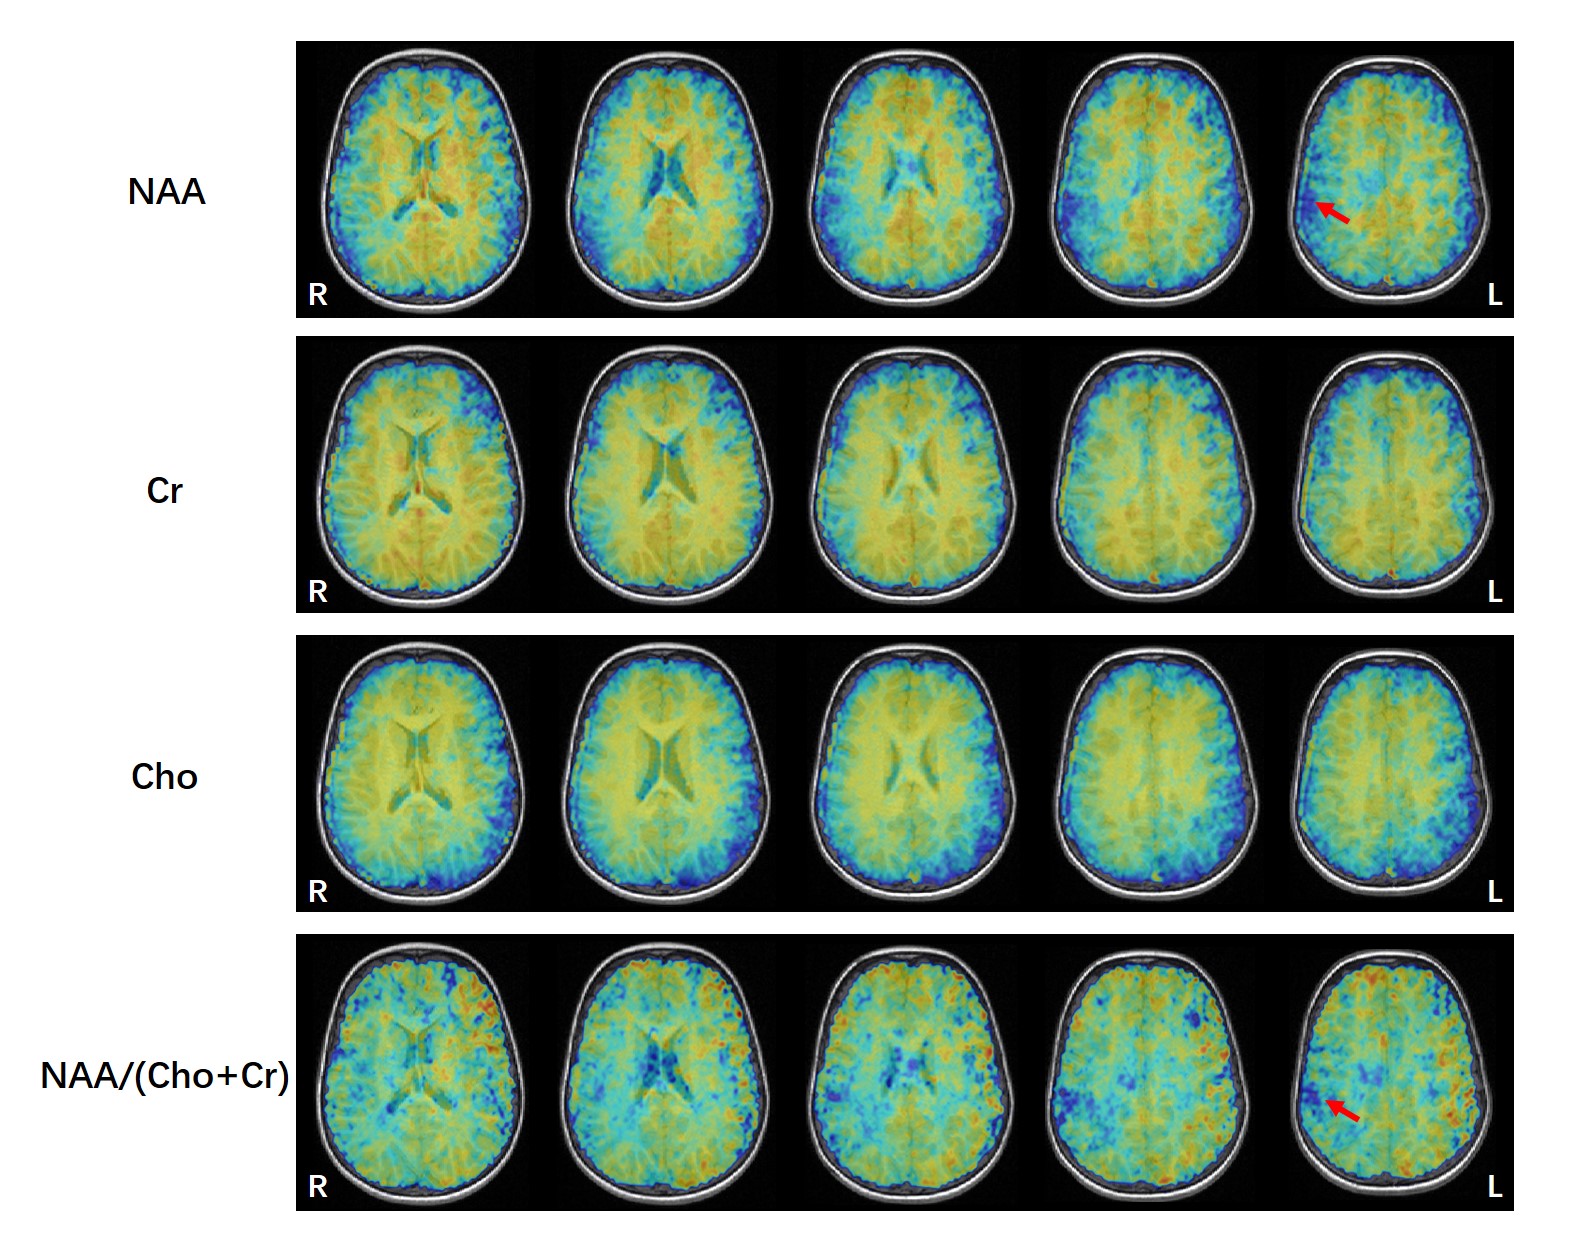
Figure 2: The high-resolution metabolic maps of the extratemporal lobe epilepsy
patient, including NAA, Cr, Cho, and NAA/(Cho+Cr) ratio maps. Red arrows point to the regions of NAA decrease, which is at
a similar location as the hypometabolic region found by 18F-FDG-PET.
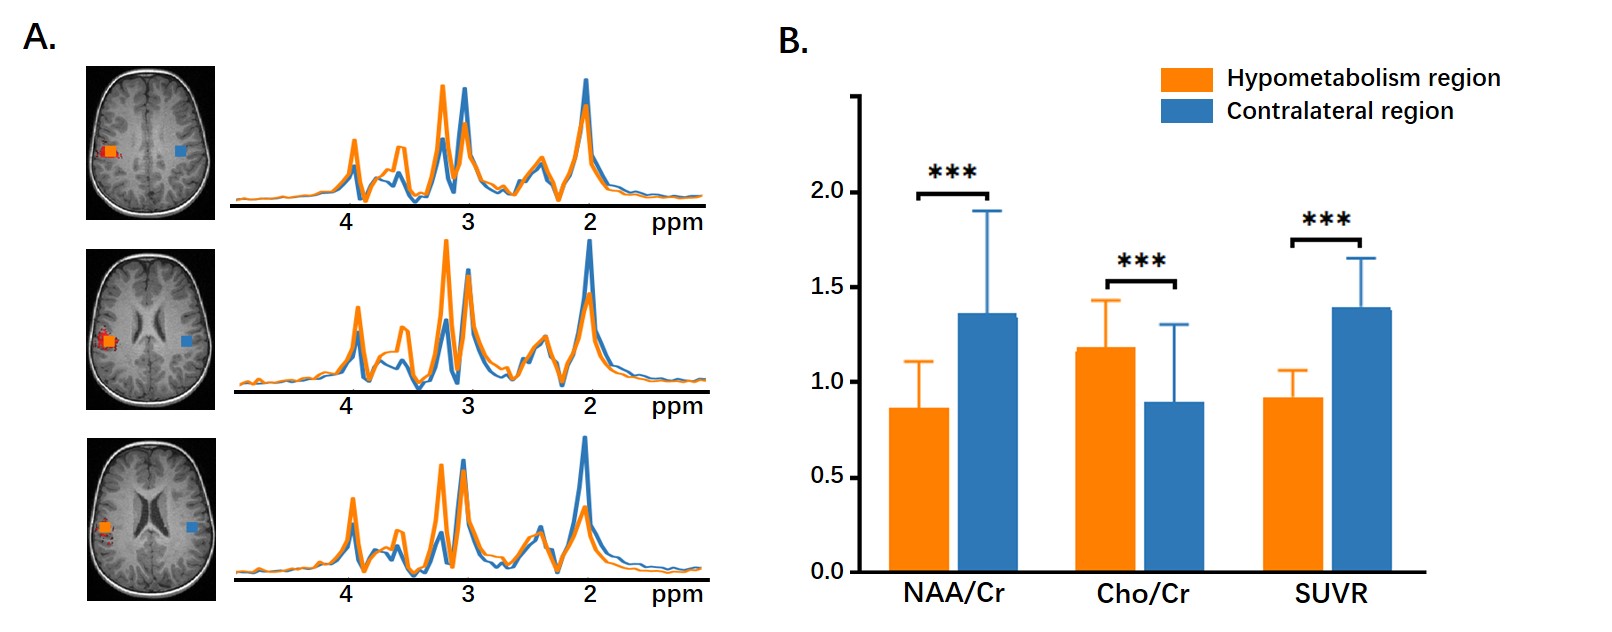
Figure 3: A)
The voxels from the hypometabolic zone (orange) exhibit a reduction in NAA, as
well as increases of Cho, in comparison with their contralateral voxels. B) Statistical
comparison of NAA/Cr, Cho/Cr, and SUVR in the hypometabolism
region vs. contralateral region. *** P <0.001.
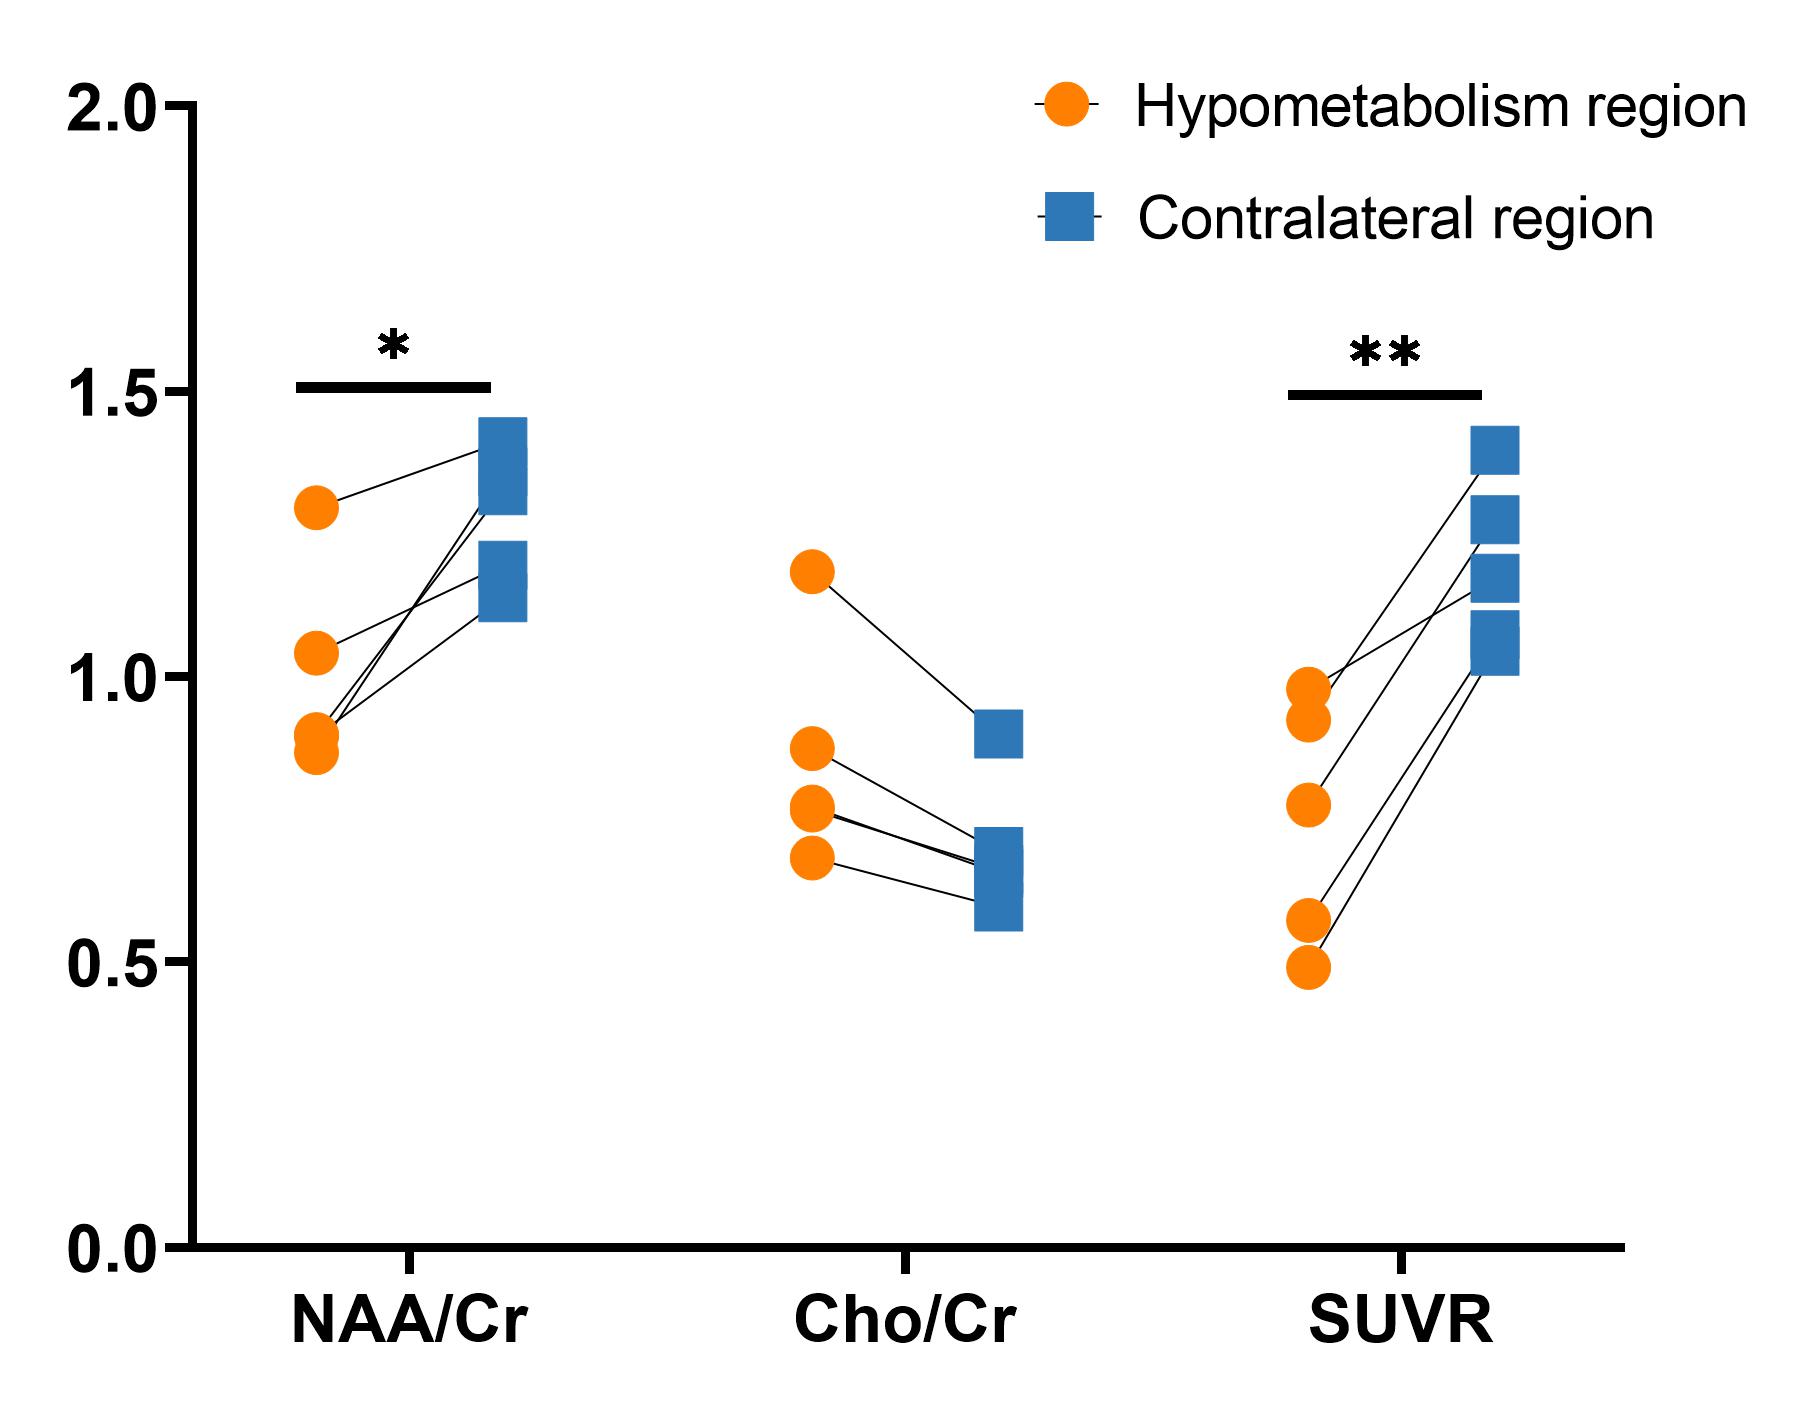
Figure 4: The statistical comparison of NAA/Cr, Cho/Cr, and SUVR in the hypometabolism
region vs. contralateral region of five patients. * P < 0.05, ** P < 0.01.