0928
Extratemporal cortical morphological changes and hypometabolism revealed in radiological MRI-negative temporal lobe epilepsy1University of Southern California, Los Angeles, CA, United States, 2Neurology and UCSF Weill Institute for Neurosciences, San Francisco, CA, United States, 3University of Alabama at Birmingham Epilepsy Center, Birmingham, AL, United States
Synopsis
Radiological MRI-negative temporal lobe epilepsy (TLE) is a common, but challenging subtype for surgical treatment. Compared to MRI-positive cases, these patients often require invasive EEG for localization that may also involve extratemporal regions. Furthermore, these cases entail a lower likelihood of seizure-free surgical outcome. To better understand this important group, we studied cortical surface features of MRI and FDG-PET to relate occult extratemporal damage to epilepsy localization and surgical outcome prediction. Bilateral cortical morphological changes were found. FDG-PET hypometabolism was lateralized in the hemisphere ipsilateral to seizure focus. Extratemporal and bilateral hypometabolism tended to be associated with poor surgical outcome.
Introduction
Temporal lobe epilepsy (TLE) can be a drug-resistant form of focal epilepsy that is characterized by seizures originating most often in mesial temporal structures, but also at times in neocortical regions, even those that might lie outside of the temporal lobe. Though some MRI studies reveal structural abnormalities outside of the temporal lobe in these patients, at least 30% of these patients have diagnostically negative scans.1,2 The absence of conclusively identified epileptogenic lesions in structural imaging forces clinicians to rely on other methods to more precisely localize the patient's seizures, most often resorting to invasive EEG techniques. Furthermore, recent imaging studies show that extratemporal damage may be involved in these cases, a finding that indicates epileptogenic networks, including the limbic system, are likely a factor affecting epilepsy localization methods and surgical outcome.3 Thus, investigating undetected extratemporal damage is necessary to better understand the nature of MRI-negative TLE, and ultimately, to improve treatment strategies.1,4 In this patient population, FDG-PET is often used to detect focal metabolic disturbances related to epilepsy that may be present without evidence of structural derangement on MRI.2 The complex nature of MRI-negative TLE may worsen surgical outcomes of these patients relative to those with identifiable lesions. MRI-negative patients are observed to be 40% less likely to be seizure-free after surgery compared to patients exhibiting lesions (e.g., mesiotemporal sclerosis).4 No study has attempted to relate extratemporal cortical damage in MRI-negative TLE patients to the prediction of surgical outcome and improvement of seizure lateralization. In this study using quantitative analysis of both PET and MRI features we aimed to improve localization and prediction of surgical outcome in MRI-negative TLE.Methods
SubjectsWe studied 76 patients (age=39.2±12.6) with radiological MRI-negative TLE, 38 with left lateralized TLE (LTLE; 18 females) and 38 with right lateralized TLE (RTLE; 23 females). The patients were selected from the surgical databases of two universities: University of California, San Francisco (UCSF; n=40), and University of Alabama, Birmingham (UAB; n=36). All 76 patients had undergone surgery and had both pre-surgical 3T T1-MPRAGE MRI and FDG-PET scans. 53 patients had a 1-year follow-up to assess surgical outcome (Engel class). Additionally, 57 age-matched controls with 3T T1-MPRAGE MRI scans were selected from the International Consortium for Brain Mapping database. No controls with FDG-PET were recruited in the current study.
Image processing
Cortical surface construction from MRI was completed using the CIVET version 1.1.12 pipeline as previously described in Kim et al.5 To sample PET features on the surface, we registered PET images to the same individual’s MRI images. Cortical thickness, relative intensity of grey matter (GM), sulcal depth and normalized PET intensity were determined as described in prior research.6
Statistical analyses
Statistical analyses were performed using MATLAB R2019a and the SurfStat MATLAB toolbox. Three separate analyses were performed. First, to investigate potential increased metabolic disturbance in the side of seizure focus, a comparison of FDG-PET values between contralateral and ipsilateral hemispheres within the same patient was accomplished using a paired-sample t-test. Second, general linear models were used to investigate differences in cortical MRI features (cortical thickness, GM relative intensity, sulcal depth) between each group of LTLE/RTLE patients and controls while correcting for the confounding effects of age and sex. Finally, general linear models were used to investigate differences between patients with a “good” surgical outcome (Engel class I, seizure-free) and those with a “poor” outcome (Engel classes II-IV) for both cortical MRI and FDG-PET features. We performed random field theory-based correction for multiple comparisons.
Results
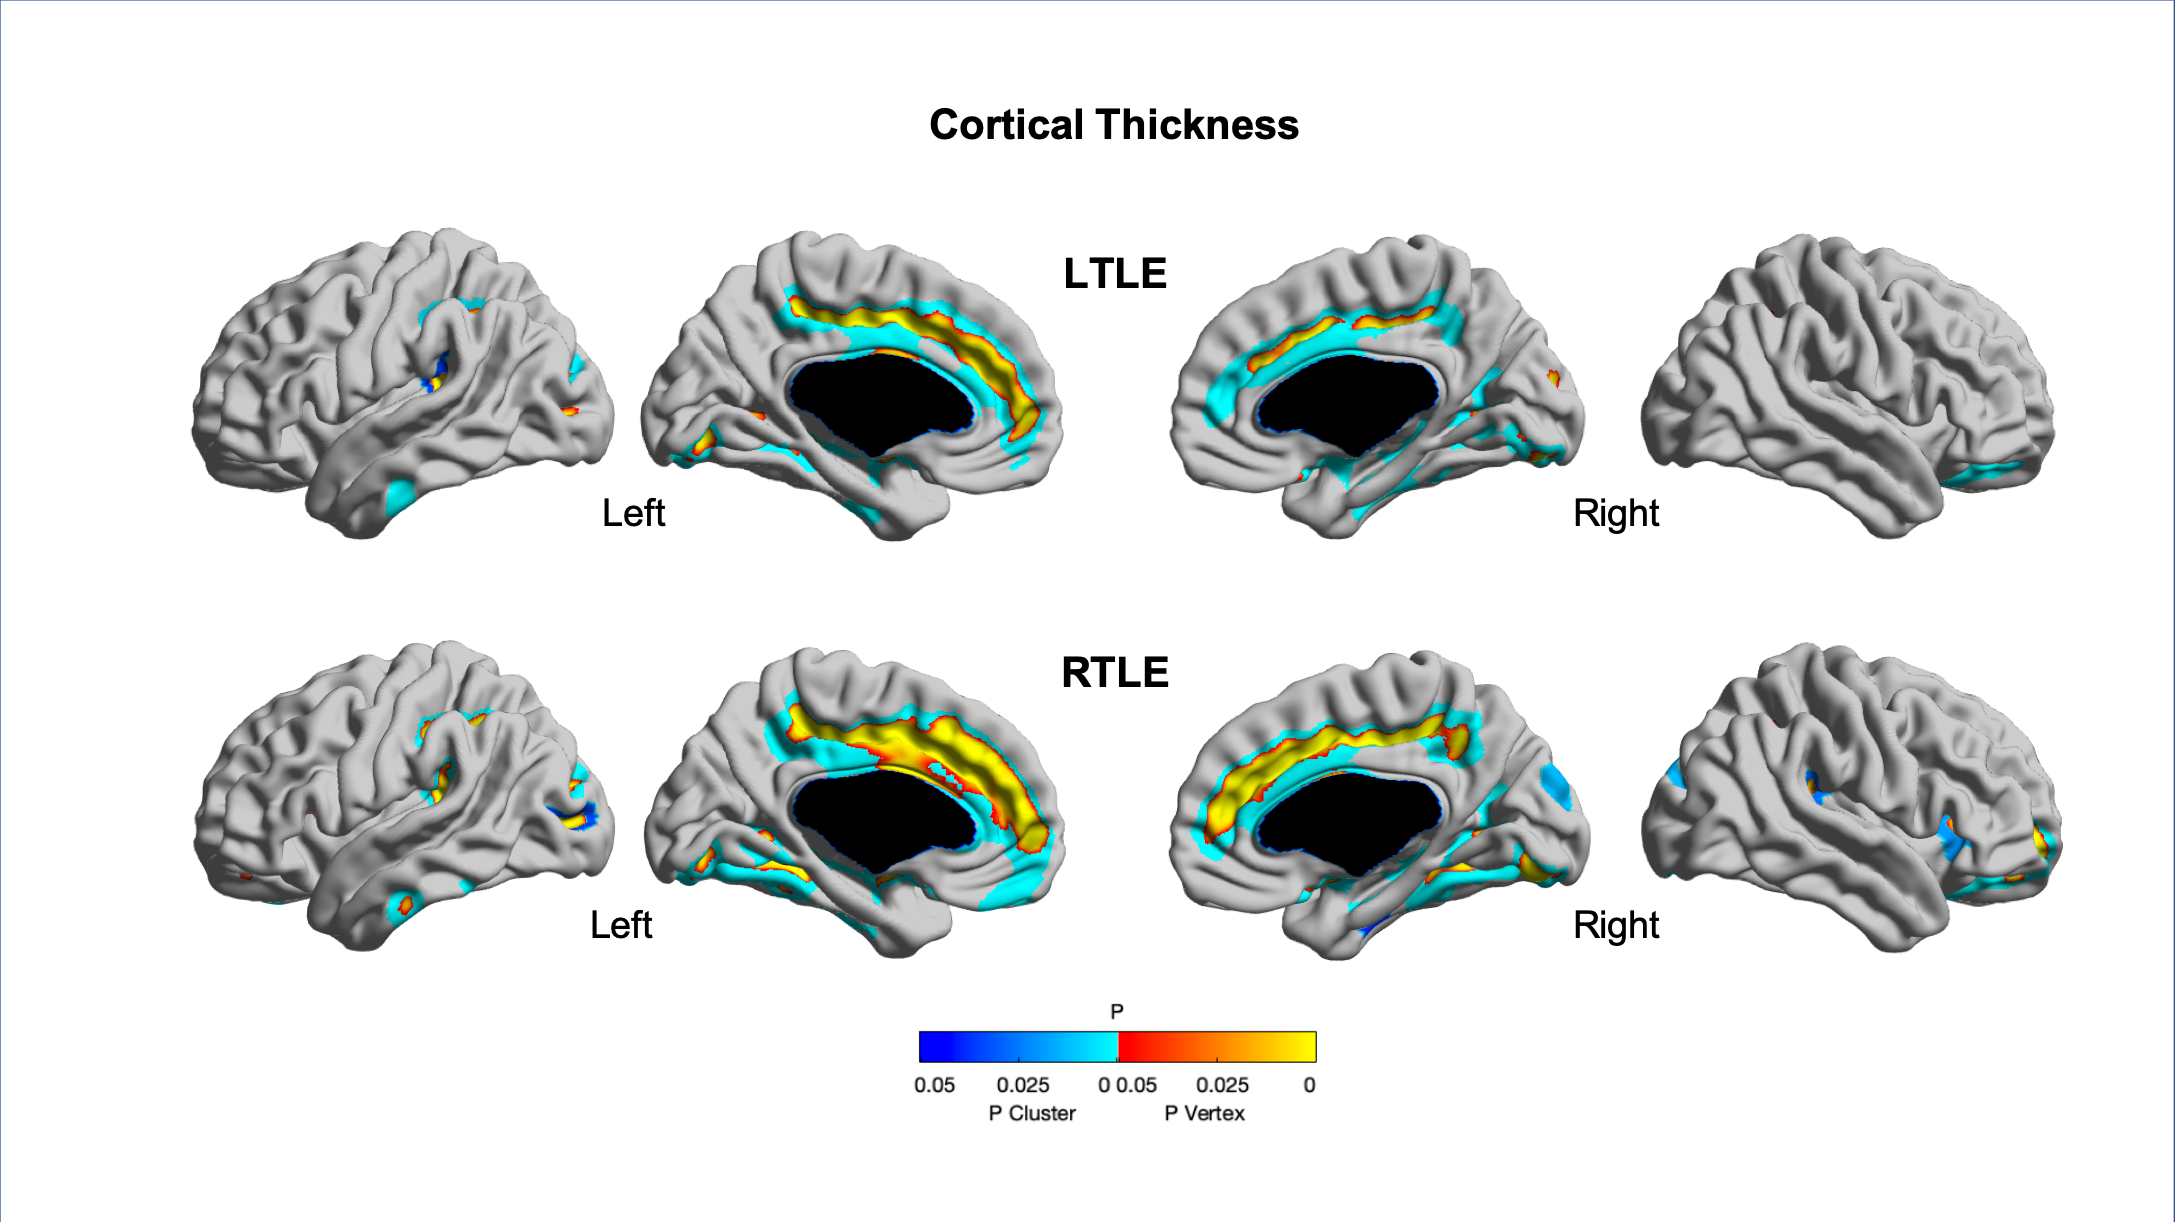
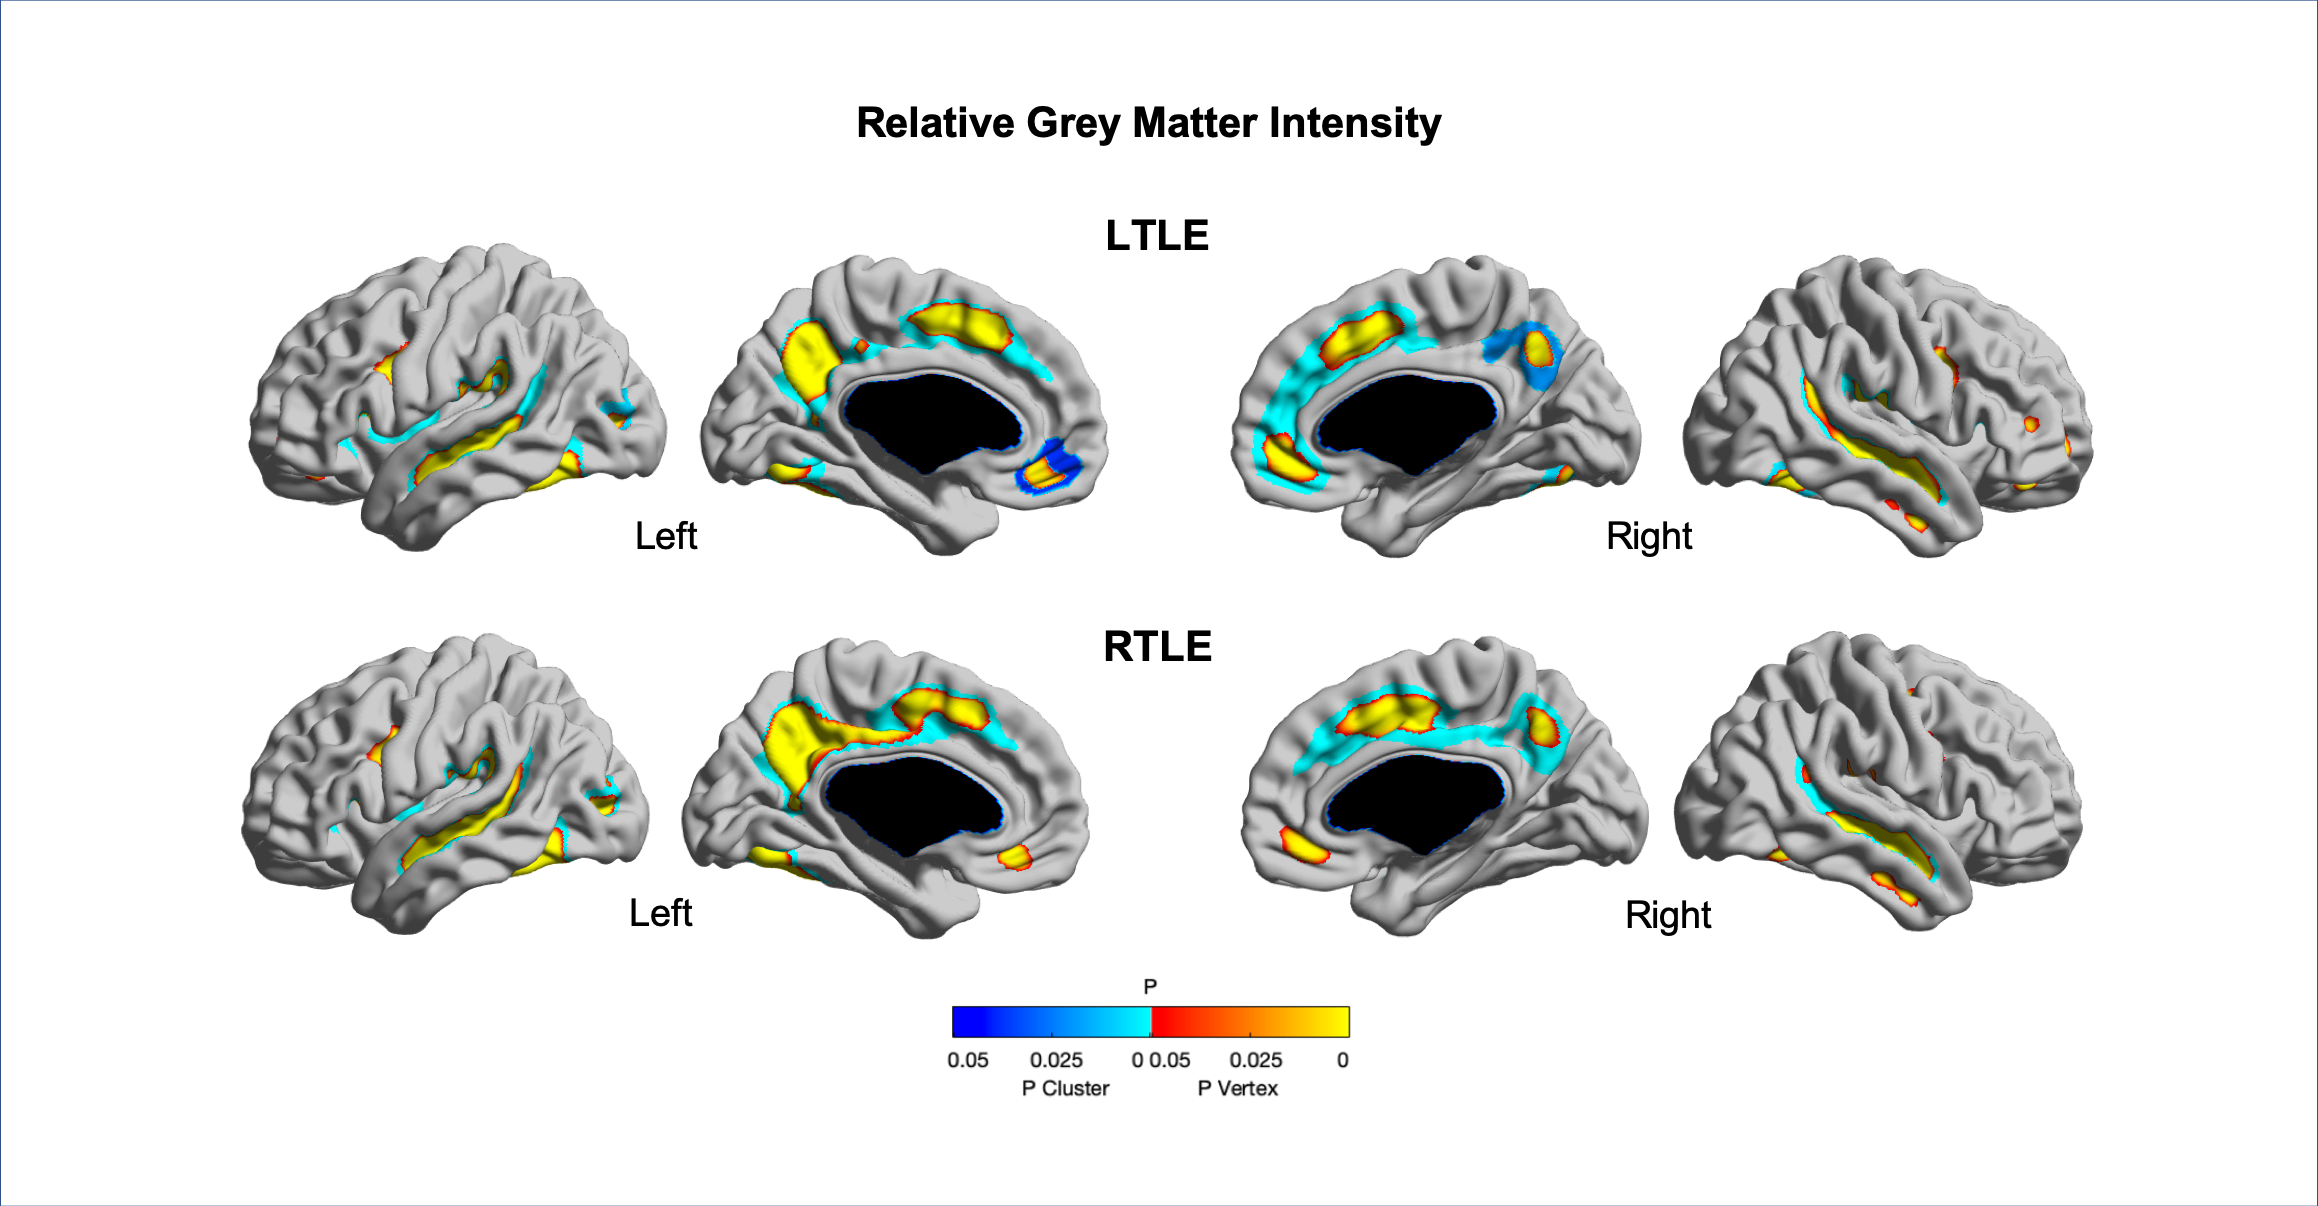
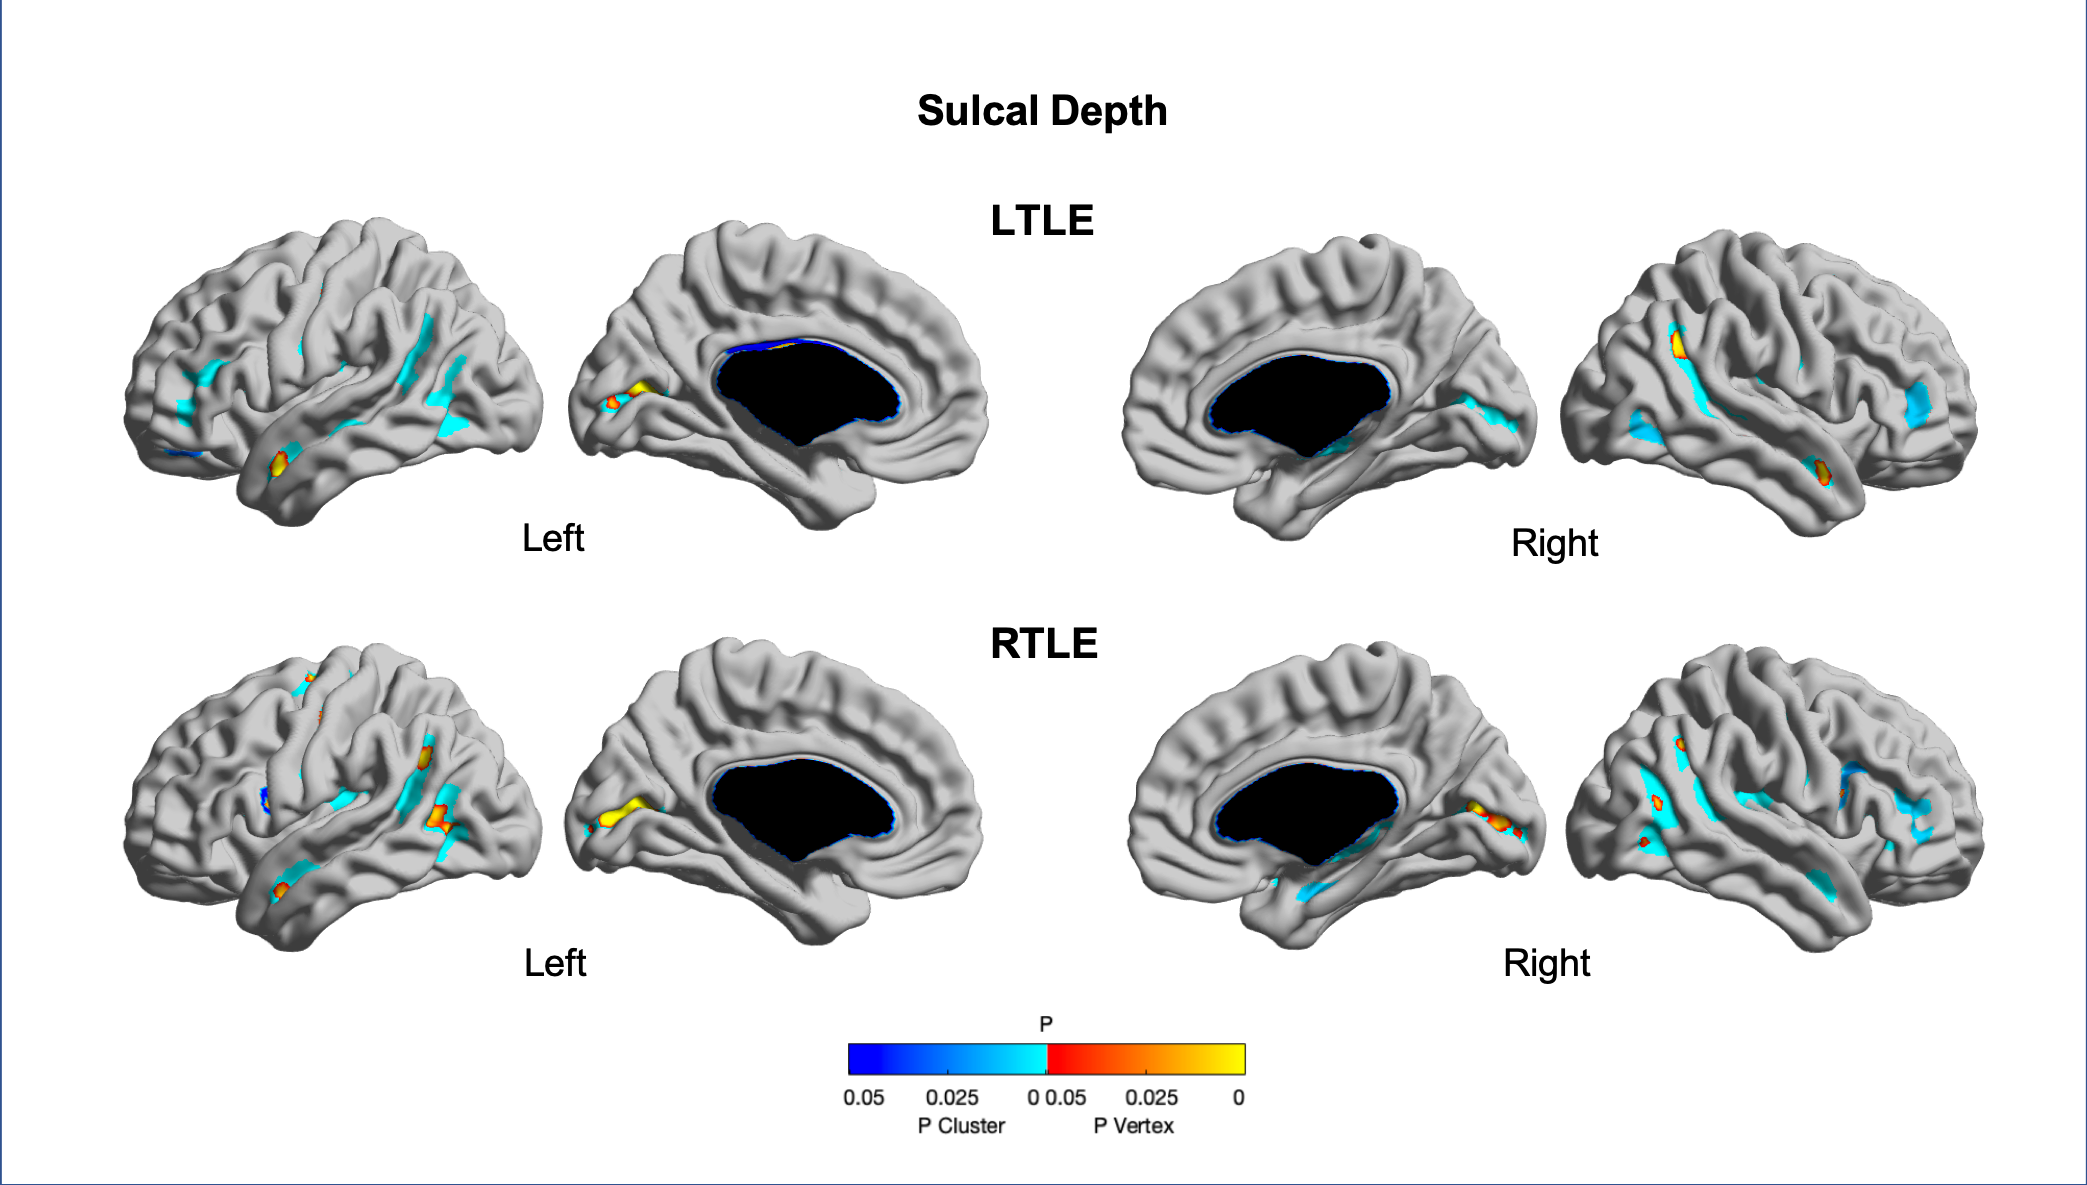
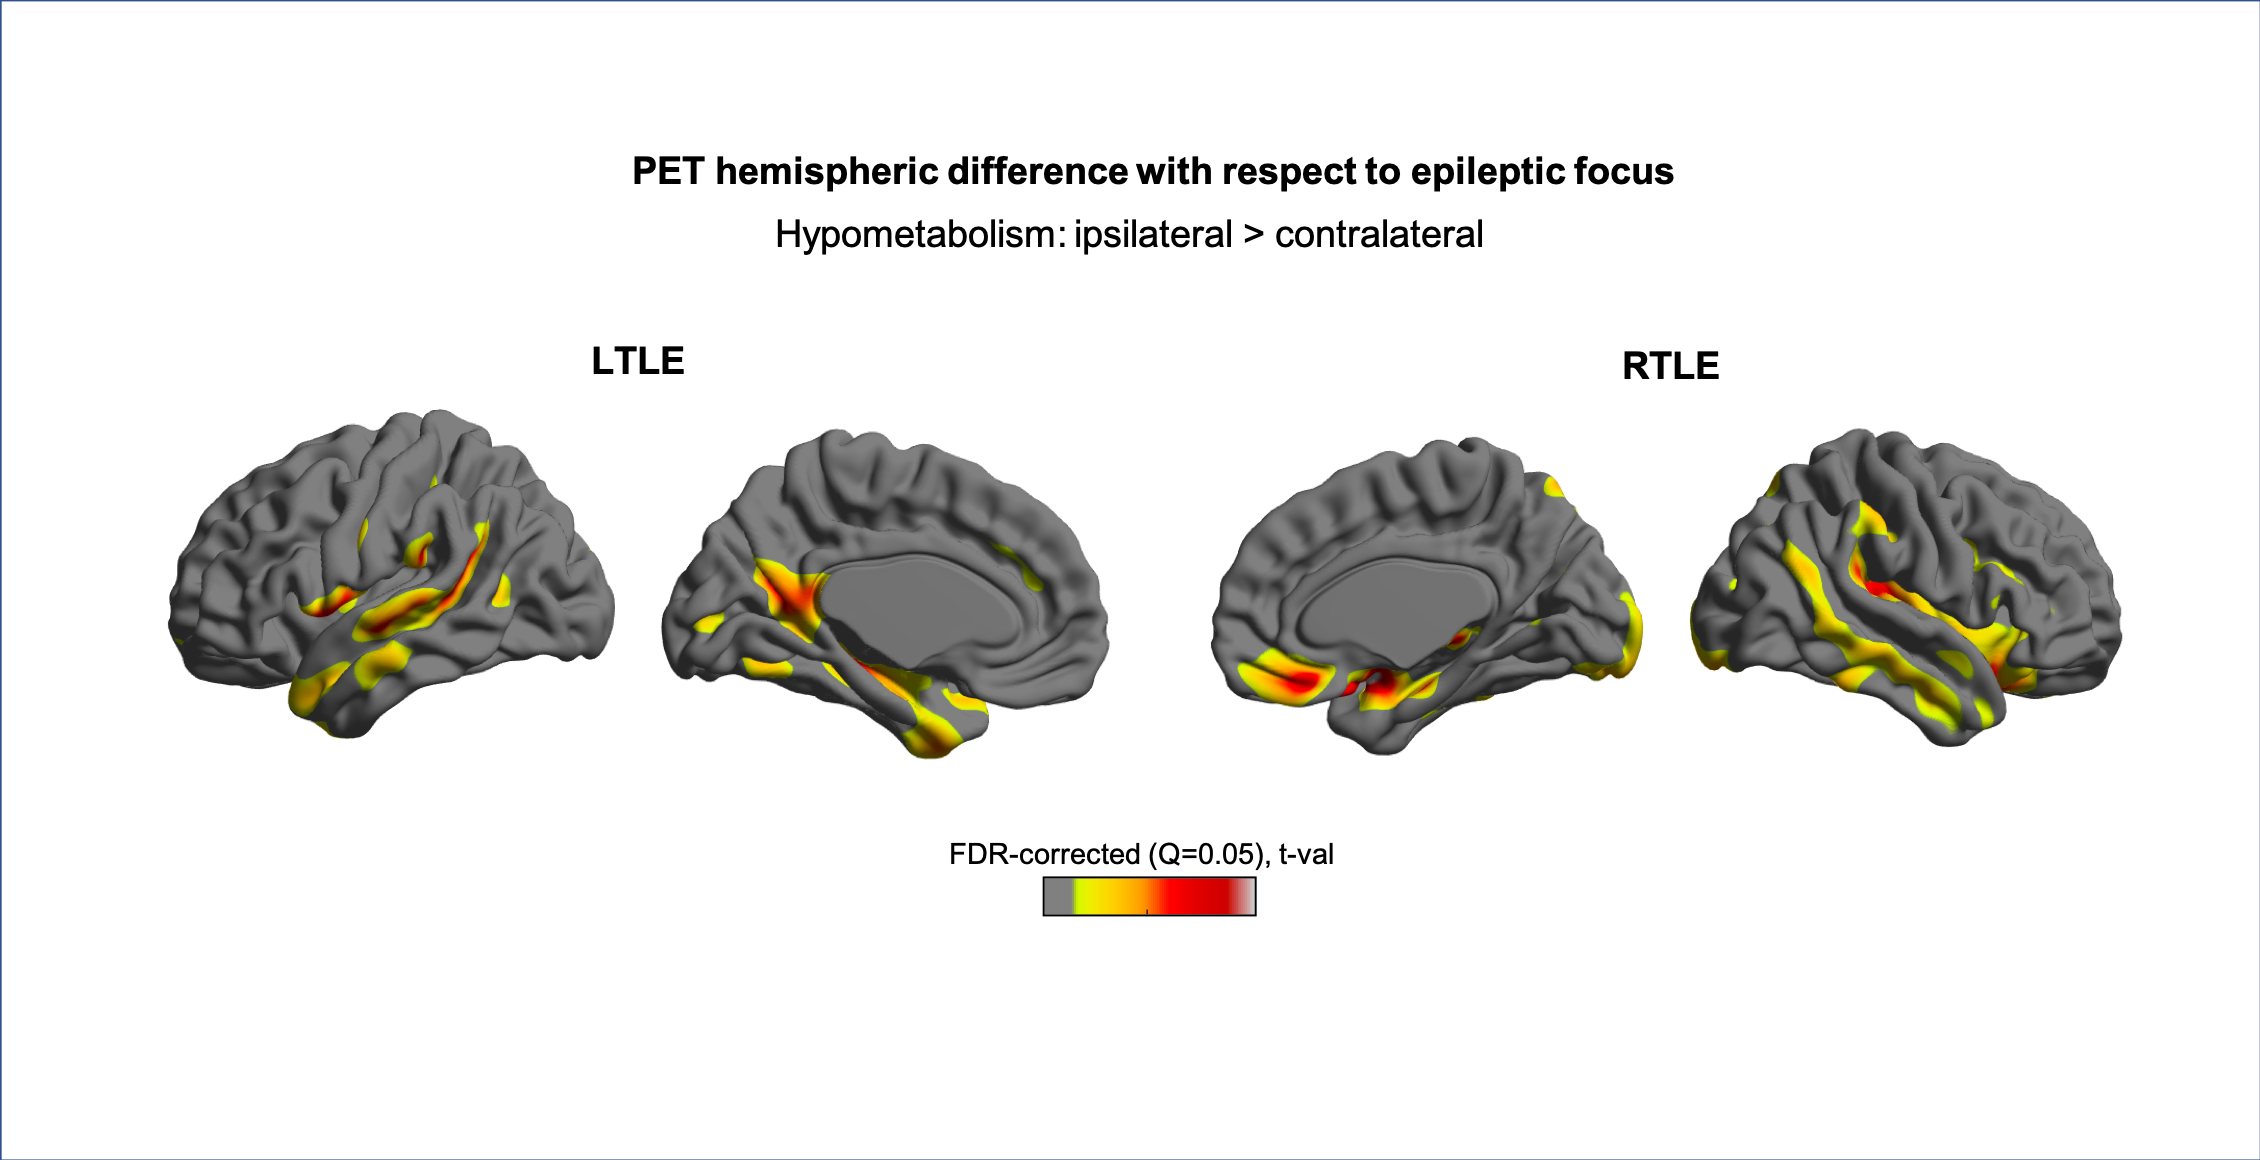
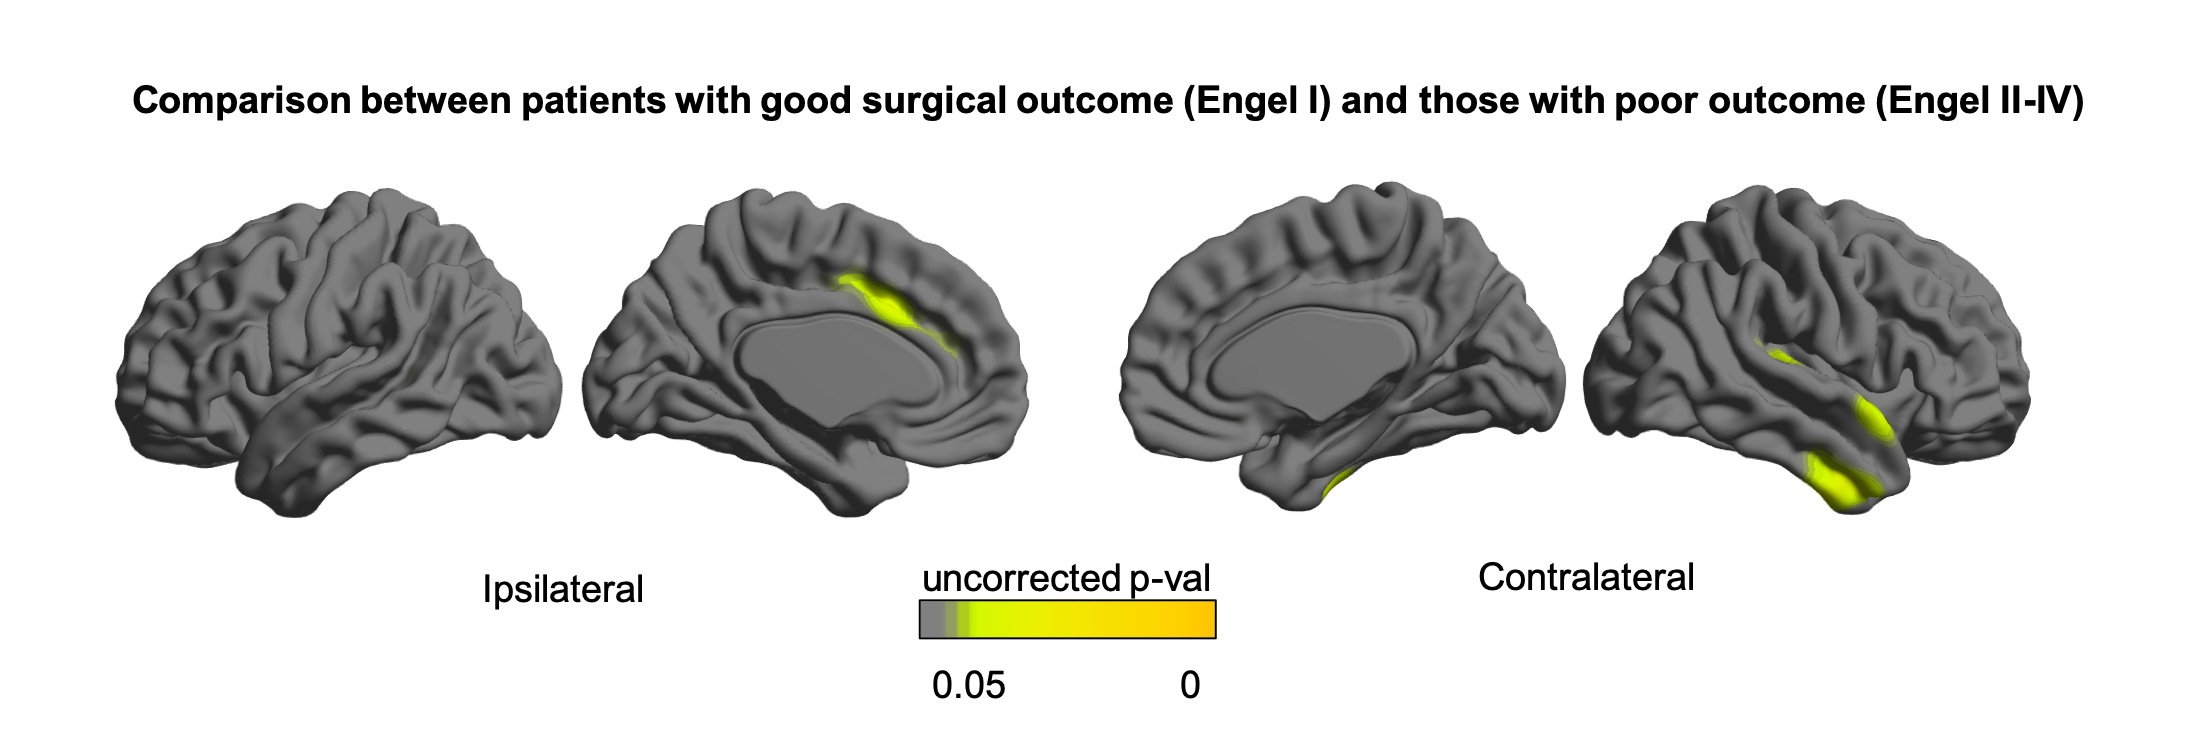
Quantitative MRI feature analysis showed that both LTLE and RTLE groups differed from controls for all three features. Surface mapping indicates that the areas with significantly thinner cortex, darker GM, and deeper sulci in LTLE and RTLE compared to controls (Figures 1,2,3; corrected p<0.05) were seen bilaterally and not limited to the temporal region, largely including areas involved in the limbic system, such as the cingulate, insular, and prefrontal cortices. In contrast, asymmetry analysis revealed hypometabolism lateralized to the hemisphere ipsilateral to seizure focus when compared with the contralateral hemisphere (Figure 4). No MRI feature was found significant in the asymmetry analysis (p>0.1). While some extratemporal hypometabolism was found, the strongest effect was located in the mesiotemporal lobe. Compared to patients with “good” surgical outcome, patients with “poor” outcome presented a trend (uncorrected p<0.05) towards hypometabolism involving ipsilateral cingulate cortex and contralateral medial temporal regions (Figure 5).Discussion and Conclusion
Quantitative MRI feature analysis demonstrates that these patients are not truly “MRI-negative.” Rather, bilateral, mostly symmetric mesial temporal and neocortical abnormalities are present. Visual inspection of MRI alone may not distinguish these symmetric and subtle differences. Yet the bilateral nature of these subtle structural abnormalities explains why MRI features are not an adequate diagnostic tool in these patients. Conversely, as is known about FDG-PET utility in TLE, relative ipsilateral hypometabolism is a sensitive and accurate method for epilepsy lateralization. And to add, our analysis showed that patients with hypometabolism outside of the resected mesiotemporal region and those with bilateral mesiotemporal hypometabolism may potentially have a worse surgical outcome. A larger sample-size study may further clarify this inconclusive finding.Acknowledgements
This study is supported by the National Institutes of Health grants (P41EB015922) and the BrightFocus Foundation grant (A2019052S).References
1. Bernhardt, B.C., H. Kim, and N. Bernasconi, Patterns of subregional mesiotemporal disease progression in temporal lobe epilepsy. Neurology, 2013. 81(21): p. 1840-7.
2. Muhlhofer, W., et al., MRI-negative temporal lobe epilepsy-What do we know? Epilepsia, 2017. 58(5): p. 727-742.
3. Bernhardt, B.C., et al., Magnetic resonance imaging pattern learning in temporal lobe epilepsy: classification and prognostics. Ann Neurol, 2015. 77(3): p. 436-46.
4. Tellez-Zenteno, J.F., et al., Surgical outcomes in lesional and non-lesional epilepsy: a systematic review and meta-analysis. Epilepsy Res, 2010. 89(2-3): p. 310-8.
5. Kim, J.S., et al., Automated 3-D extraction and evaluation of the inner and outer cortical surfaces using a Laplacian map and partial volume effect classification. Neuroimage, 2005. 27(1): p. 210-21.
6. Tan, Y.L., et al., Quantitative surface analysis of combined MRI and PET enhances detection of focal cortical dysplasias. Neuroimage, 2018. 166: p. 10-18.
Figures