0927
Association of Brain Functional Connectivity with Dizziness is Modulated by Executive Functions in Mild Traumatic Brain Injury1Department of Biomedical Imaging and Radiological Sciences, National Yang Ming University, Taipei, Taiwan, 2Department of Medical Imaging, Taipei Medical University Hospital, Taipei, Taiwan, 3Department of Radiology, School of Medicine, College of Medicine, Taipei Medical University, Taipei, Taiwan, 4Translational Imaging Research Center, Taipei Medical University Hospital, Taipei, Taiwan
Synopsis
Dizziness is one of the frequent post-concussion symptoms, however neuroimaging evidence that supports symptom occurrence was less explored. This study started with the investigation of modulation effects from executive functions on functional connectivity (FC) between brain regions related to dizziness and balance followed by the correlation analysis to identify the imaging biomarker for elucidating the dizziness symptoms after mTBI.
Background and Purpose
Dizziness is one of the most common symptoms after mild traumatic brain injury (mTBI). However, routine structural MR or CT images fail to elucidate the occurrence of dizziness. The possible mechanism of persisting dizziness caused by mTBI is associated with the impairment of vestibular pathways (composed of the vestibular nuclei, cerebellum, and thalamo-cortical circuits), somatosensory, visual, and the basal ganglia circuits.[1] Several population studies further reported the associations of vestibular dysfunctions, such as dizziness and vertigo, with impaired cognitive functions.[2,3] In this study, we aim to investigate whether the brain functional connectivity (FC) can be the imaging biomarker for dizziness after mTBI, and to evaluate the modulation effect from executive functions on the association between FC and dizziness symptoms.Materials and Methods
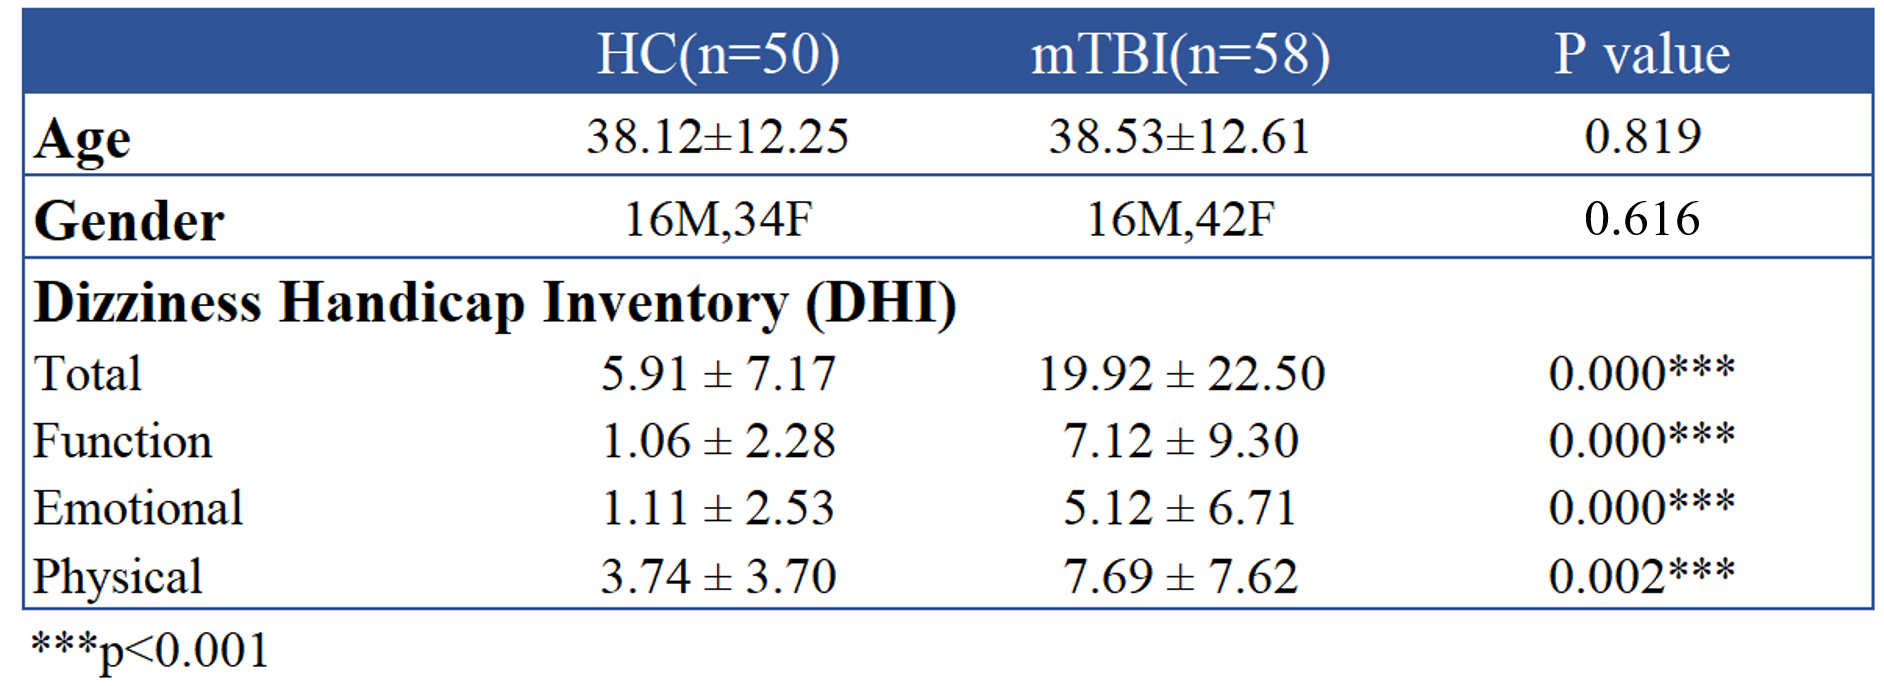
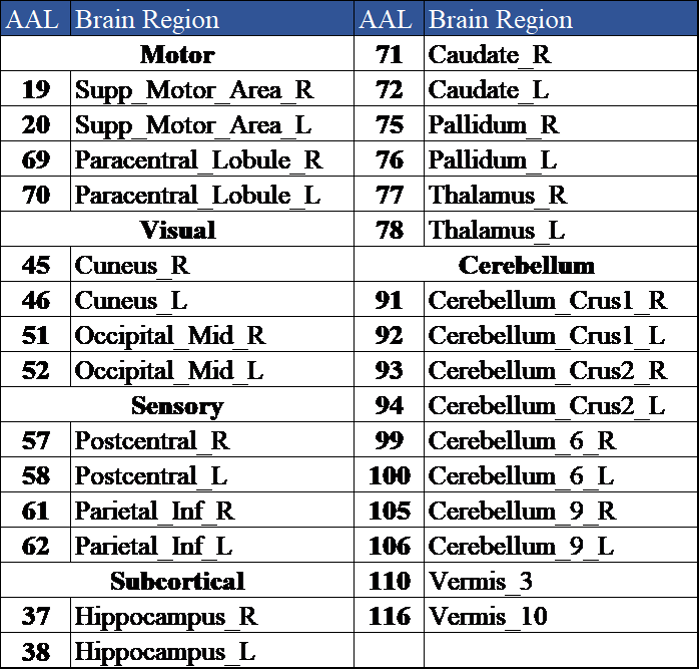
We recruited 58 patients with mTBI and 50 age- and gender-matched healthy controls (HC). Inclusion criteria for mTBI patients were witnessed closed-head trauma, no focal neurologic deficit, initial Glasgow Coma Scale higher than 13. Dizziness Handicap Inventory (DHI) was used to evaluate the dizziness symptom (Table 1).[4] MRI data, including a 3D T1-MPRAGE (TR/TE: 2300/3.26 ms; voxel size: 1.0x1.0x1.0 mm3), and BOLD fMRI (TR/TE: 2000/20 ms; voxel size: 2.2x2.2x3.5 mm3) during resting state (190 volumes), 1-back, and 2-back tasks (each for 105 volumes) were acquired on a 3T MR scanner (Siemens MAGNETOM Prisma). Patients received MR scans within 4 weeks after mTBI. The fMRI data were preprocessed with the standard procedures by using Data-Processing Assistant for Resting-State fMRI (DPARSF) toolbox.[5] The preprocessing procedures include: a) correction for slice time, b) realignment, c) co-registration of 3D-T1W images to BOLD fMRI, d) regression out confounding effects of motion parameters and signals from white matter and cerebrospinal fluid, e) spatial normalization, and f) spatial smoothing with 8 mm full-width half-maximum Gaussian kernel. The cortical and subcortical regions were parcellated into 116 regions based on the Automatic Anatomical Labeling atlas (AAL116).[6] We selected 30 brain regions related to dizziness and balance for the subsequent FC analysis (Table 2).[7] The FC was estimated by calculating the Pearson’s correlation coefficient between each pair of regional BOLD signals (with bandpass-filtered between 0.01 and 0.10 Hz) followed by the Fisher’s r-to-z transform. Two-sample t-test was used to determine the differences of FC between mTBI and HC groups (p < 0.05). Correlation coefficients were computed to reveal the relations between FC and DHI (p < 0.05) during different conditions.Results and Discussion
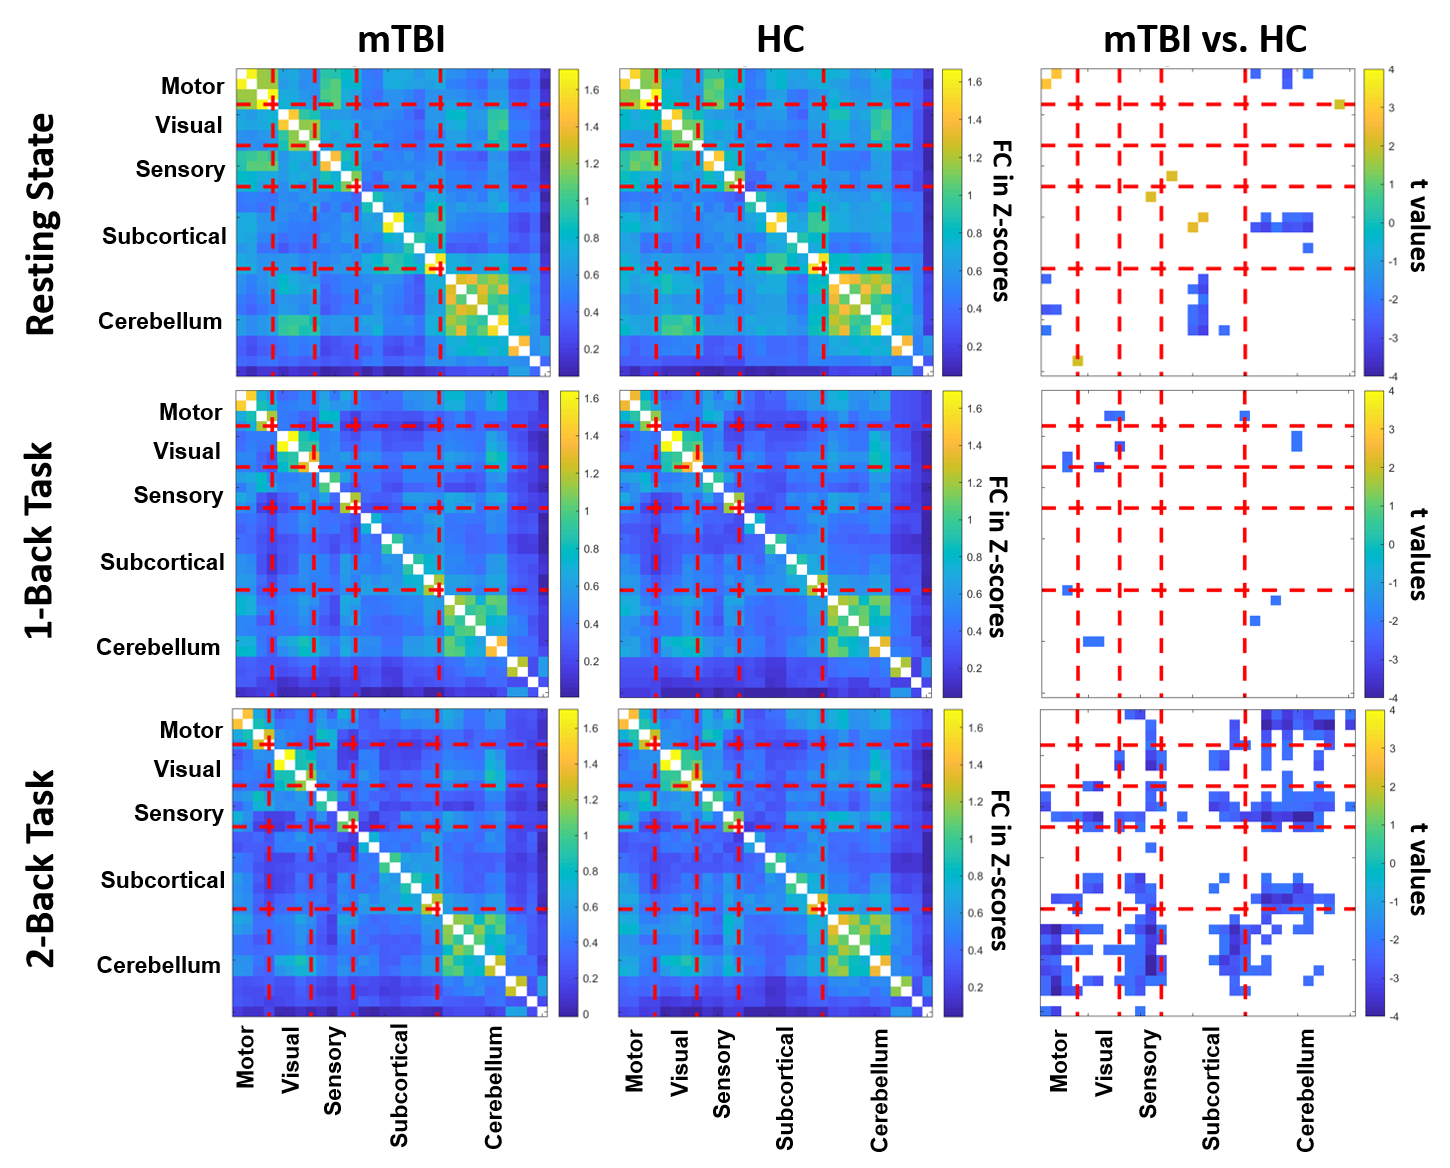
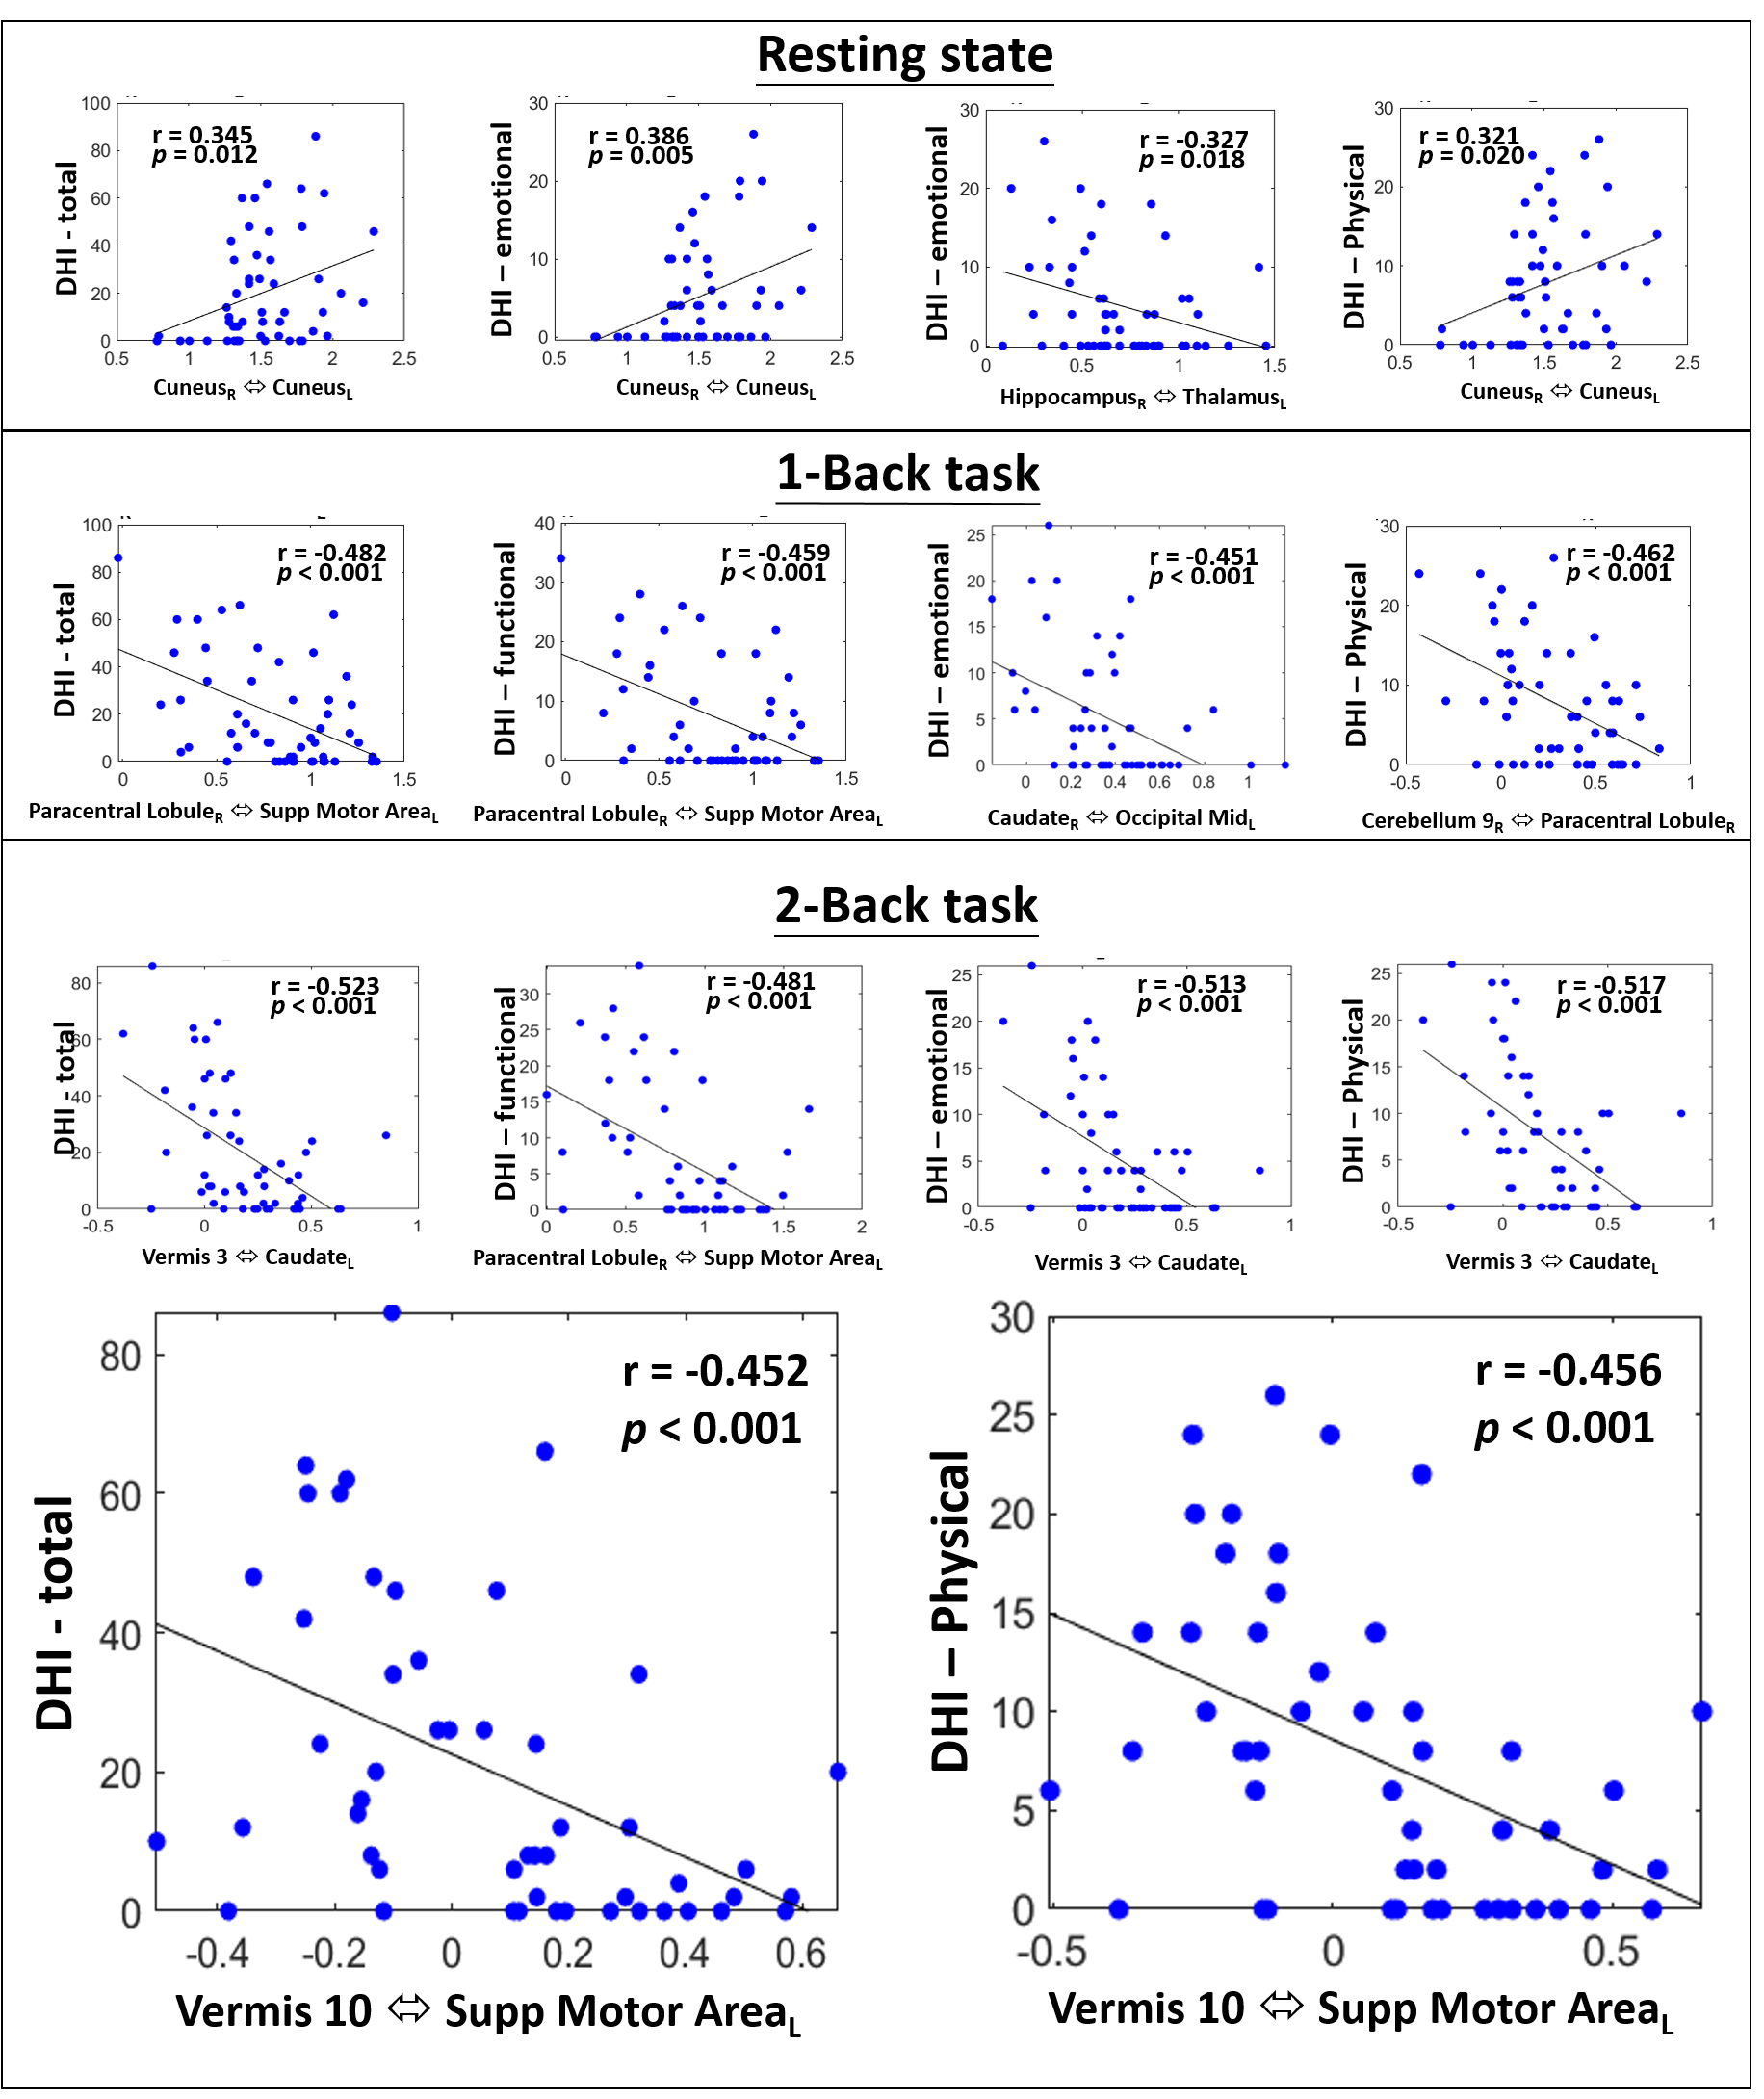
Figure 1 shows the significant differences of FC matrices (based on the 30 selected brain regions) between mTBI and HC groups during the resting-state, 1-back, and 2-back tasks. During the resting state, several significant reductions of FC in mTBI (negative t values labelled in blue in Figure 1) were found between motor and cerebellum and between subcortical regions and cerebellum. When the participants were asked to perform 1-back and 2-back tasks, the significant differences of FC between two groups shifted into different patterns compared to the resting state. Even though N-back tasks primarily involve the activation of bilateral frontal and parietal regions, the modulation effect on the FCs between our selected regions associated with dizziness and balance were observed. This modulation effect derived from the demands of executive functions (specifically, sustained attention and working memory) can somehow enhance the differences of FC related to the balance control between mTBI and HC groups. To further investigate the modulation effect on the association between FC and dizziness symptoms, we further assessed the correlation coefficients between FC and DHI scores in mTBI patients. As shown in Figure 2, only week correlations (r<0.40) can be identified between cuneus-related FCs and DHI during the resting state. During the N-back tasks, several stronger correlations (r>0.45) were found mostly associated with cerebellar regions and supplementary motor areas. It was also noted that all the significant correlations during the N-back tasks were negative correlations, indicating that a weaker FC was associated with a higher degree of dizziness symptom. We highlight two scatter plots under the 2-back task in the bottom row of Figure 2. These are the correlations related to the FC between vermis 10 and supplementary motor areas, which also presented significant difference in FC (mTBI<HC, p=0.002) between two groups. These results suggested that the modulation effect from executive functions on FCs can further unravel the underlying associations with dizziness symptoms.Conclusions
This study reported the modulation effects from executive functions on FCs between the brain regions related to dizziness and balance. Furthermore, the modulated FCs revealed stronger correlations with dizziness symptoms compared to the resting state. We concluded that the FC between the vermis 10 and supplementary motor area measured during a high-workload 2-back task may be a potential biomarker for dizziness after mTBI.Acknowledgements
This work was supported by the Ministry of Science and Technology, Taiwan (MOST 106-2314-B-010-058-MY2, MOST 106-2221-E-010-016-MY3, MOST 108-2321-B-010-012-MY2).References
1. Fife TD, Kalra D. Persistent vertigo and dizziness after mild traumatic brain injury. Annals of the New York Academy of Sciences. 2015 Apr;1343(1):97-105.
2. Bigelow RT, Semenov YR, du Lac S, Hoffman HJ, Agrawal Y. Vestibular vertigo and comorbid cognitive and psychiatric impairment: the 2008 National Health Interview Survey. J Neurol Neurosurg Psychiatry. 2016 Apr 1;87(4):367-72.
3. Semenov YR, Bigelow RT, Xue QL, Lac SD, Agrawal Y. Association between vestibular and cognitive function in US adults: data from the National Health and Nutrition Examination Survey. Journals of Gerontology Series A: Biomedical Sciences and Medical Sciences. 2015 Jul 28;71(2):243-50.
4. Jacobson GP, Newman CW. The development of the dizziness handicap inventory. Archives of Otolaryngology–Head & Neck Surgery. 1990 Apr 1;116(4):424-7.
5. Yan C, Zang Y. DPARSF: a MATLAB toolbox for" pipeline" data analysis of resting-state fMRI. Frontiers in systems neuroscience. 2010 May 14;4:13.
6. Tzourio-Mazoyer N, Landeau B, Papathanassiou D, Crivello F, Etard O, Delcroix N, Mazoyer B, Joliot M. Automated anatomical labeling of activations in SPM using a macroscopic anatomical parcellation of the MNI MRI single-subject brain. Neuroimage. 2002 Jan 1;15(1):273-89.
7. Surgent OJ, Dadalko OI, Pickett KA, Travers BG. Balance and the brain: A review of structural brain correlates of postural balance and balance training in humans. Gait & posture. 2019 May 6.
Figures