0924
Correspondence of diffusion tensor and propagator metrics with quantitative histologic outcomes in chronic traumatic encephalopathy1National Institutes of Health, Bethesda, MD, United States, 2BME, University of Arizona, Tucson, AZ, United States, 3Boston University, Boston, MA, United States
Synopsis
Diffusion tensor and propagator metrics are compared directly in post-mortem cortex specimens from humans with chronic traumatic encephalopathy. Significant correlation was found between fractional anisotropy and non-Gaussianity with pTau staining in the sulcal depths. Additionally, GFAP staining of astrocytosis in the white matter was significantly correlated with Trace, FA, return-to-origin probability and propagator anisotropy. Cluster-based methods were also applied to explore the multivariate diffusion signature associated with CTE pathology. These findings suggest that diffusion metrics may be sensitive to CTE-related pathology.
Introduction
A main advantage of diffusion MRI (dMRI) is the ability to reveal microscale tissue abnormalities that are invisible to other MRI modalities, sensitively detecting differences in net water displacements across tissue environments with different cellular features. This approach could be especially promising for identifying markers of pathology in mild and severe TBI1 for which conventional MRI markers are absent, but striking alterations at the cell and protein levels are observed in autopsy. One such application would be in the diagnosis of chronic traumatic encephalopathy (CTE), a neurodegenerative disease associated with one or more head injuries2. Currently, a confirmed diagnosis of CTE is made post-mortem using immunohistochemistry to identify neuronal and astroglial phosphorylated tau (pTau) preferentially distributed in depths of cortical sulci2,3. Diffusion tensor imaging (DTI) fractional anisotropy (FA) has been previously explored for correspondence with this histopathology, showing a modest correlation with axonal disorganization in white matter adjacent to pTau laden sulci in CTE tissues, but no direct relationship between existing DTI metrics and pTau4. The objective of the current study is to extend this analysis to include metrics from the mean apparent propagator (MAP) framework and sulcal pTau and concomitant pathology (e.g., white matter gliosis). In addition, we apply two statistical approaches to improve the identification of radiologic-pathologic correspondence in this challenging tissue environment and experimental paradigm: mixed effects analysis to accommodate cross sample variability and unsupervised segmentation of unique tissue regions using a k-means based clustering algorithm.Methods
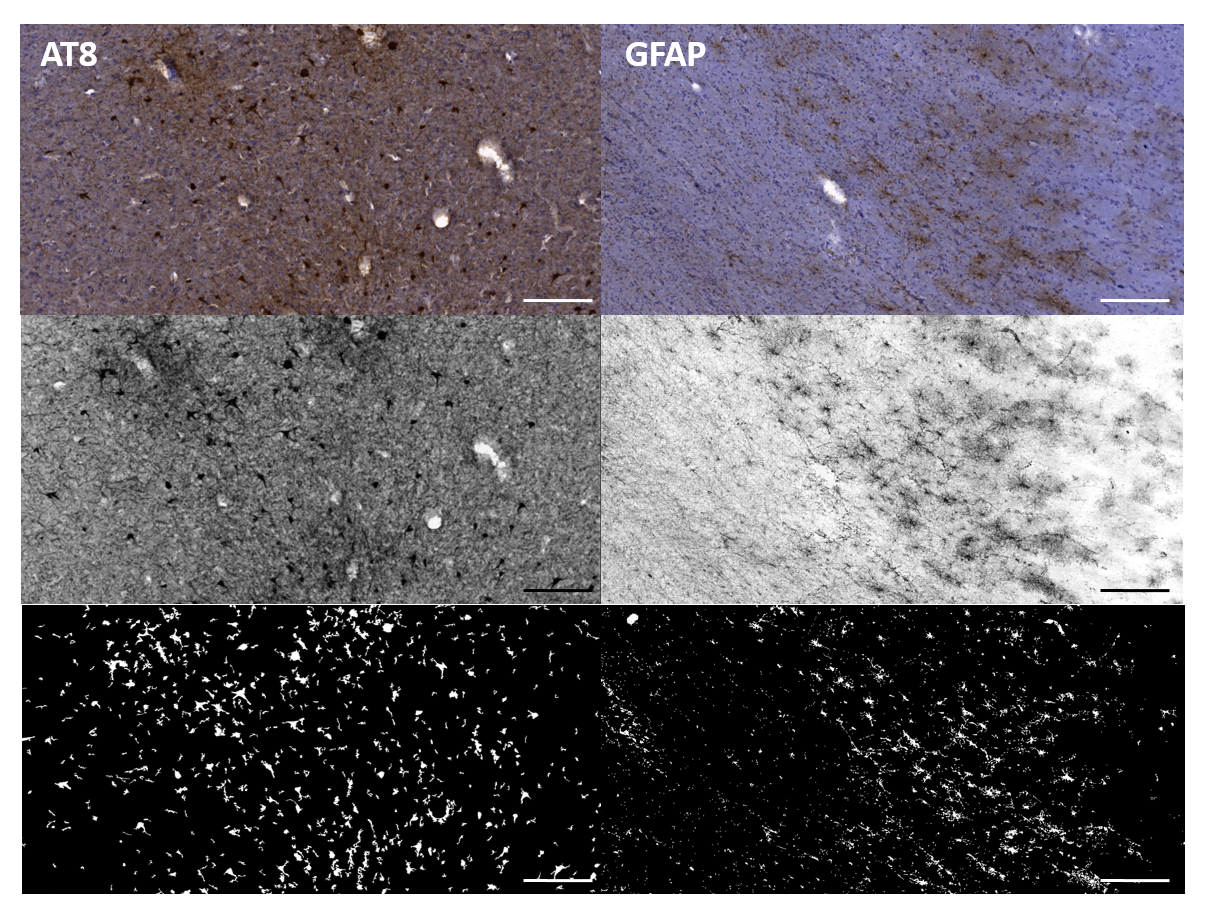
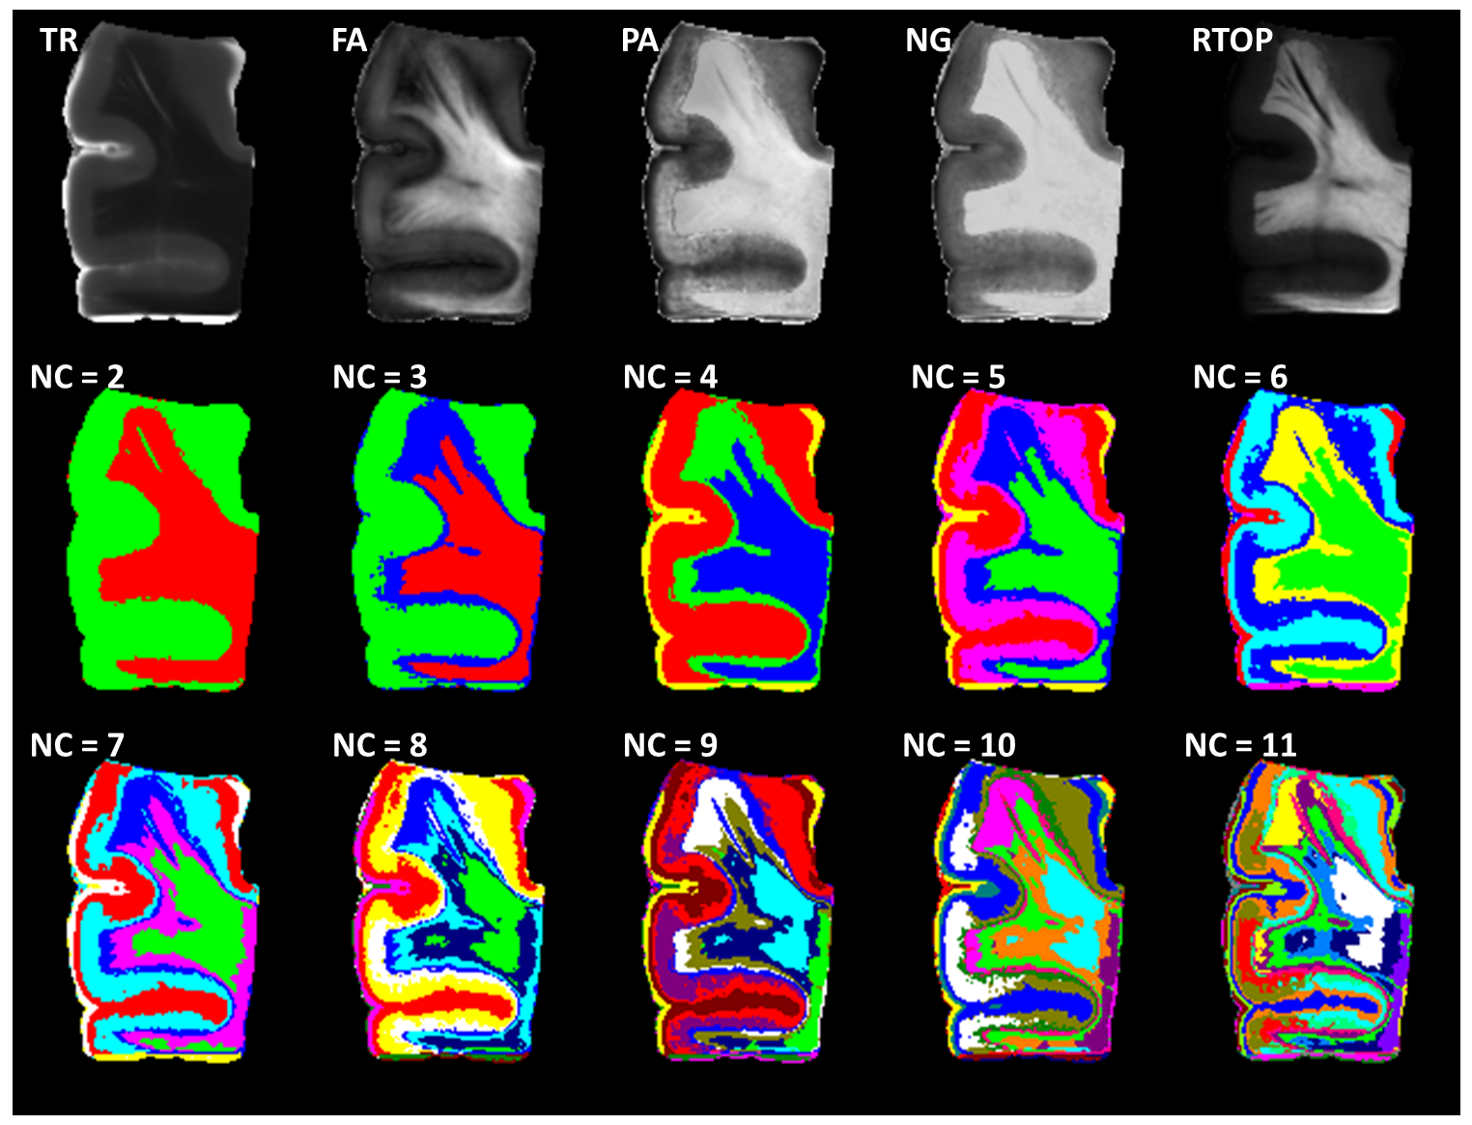
Ten formalin fixed cortical tissue samples from the superior frontal cortex (Brodmann Area 8/9) with a confirmed diagnosis of Stage III/IV CTE were obtained from the Boston University CTE Center brain bank. Diffusion data with spatial resolution of 250x250x500 µm were acquired on an 11.7T MRI scanner (Agilent, Palo Alto, CA) using a standard 2D spin echo sequence as previously described4,5. High angular resolution diffusion data (TR/TE = 1400/30 ms) were collected across 202 noncollinear diffusion sensitized directions with a maximum b-value of 8,000 s/mm2 along with ten non-diffusion weighted (b = 0 s/mm2) volumes. DTI and MAP-MRI image processing and model fitting was performed using TORTOISE software and scalar metric maps for the Trace (TR), FA, non-Gaussianity (NG), return to the origin probability (RTOP) and propagator anisotropy (PA) were analyzed using ROIs placed manually using ITKsnap by an investigator blinded to tissue histopathology. Following acquisition of dMRI data, tissue specimen were sectioned serially into 50 µm thick sections. Sections were stained with AT8 for pTau immunoreactivity or GFAP for astrogliosis, followed by counterstaining with hematoxylin. High resolution images of stained tissue sections were acquired on an Axio Scan Z1 digital slide scanner (Zeiss, Thornwood, NY) and downsampled to 10x magnification for semi-automated quantitative histology. Regions of interest were identified in sulcal depths of gray matter and cortical white matter for quantification of pTau and GFAP staining respectively by an investigator blinded to diffusion metrics. Percent area of thresholded AT8 and GFAP staining in each ROI were used to quantify abundance of pTau and astrocytes (Figure 1). Statistical relationships between dMRI and quantitative histology ROI values were evaluated using linear mixed effects modeling in the R statistical software package with cortex and white matter analyzed separately and specimen number used as a random variable. Inference tests were made using analysis of variance. In order to examine imaging abnormalities defined by the combined behavior of multiple metrics, we used a k-means based clustering algorithm which groups voxels based on their metric similarity (FA, NG, PA, RTOP and TR) and spatial proximity of the voxels. When appropriate, we enforce spatial contiguity by iteratively re-assigning smaller disconnected regions until contiguity is satisfied.Results
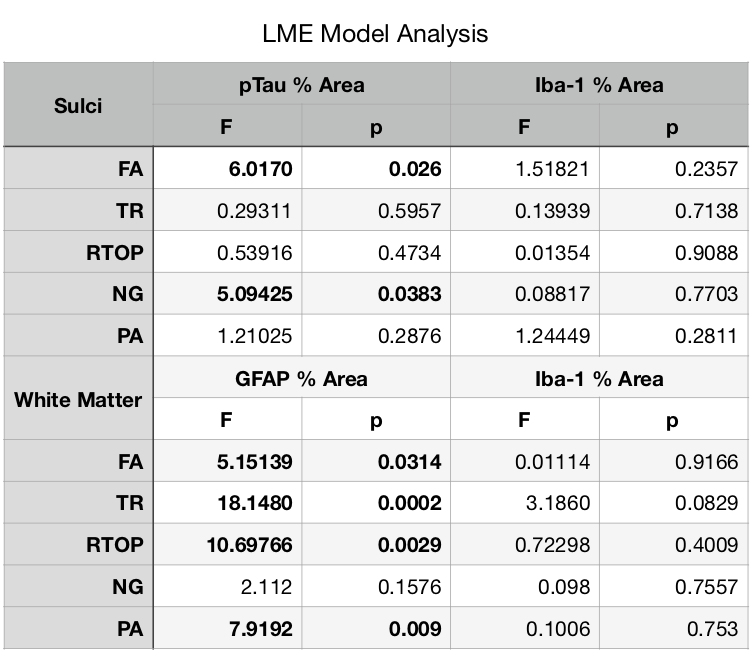
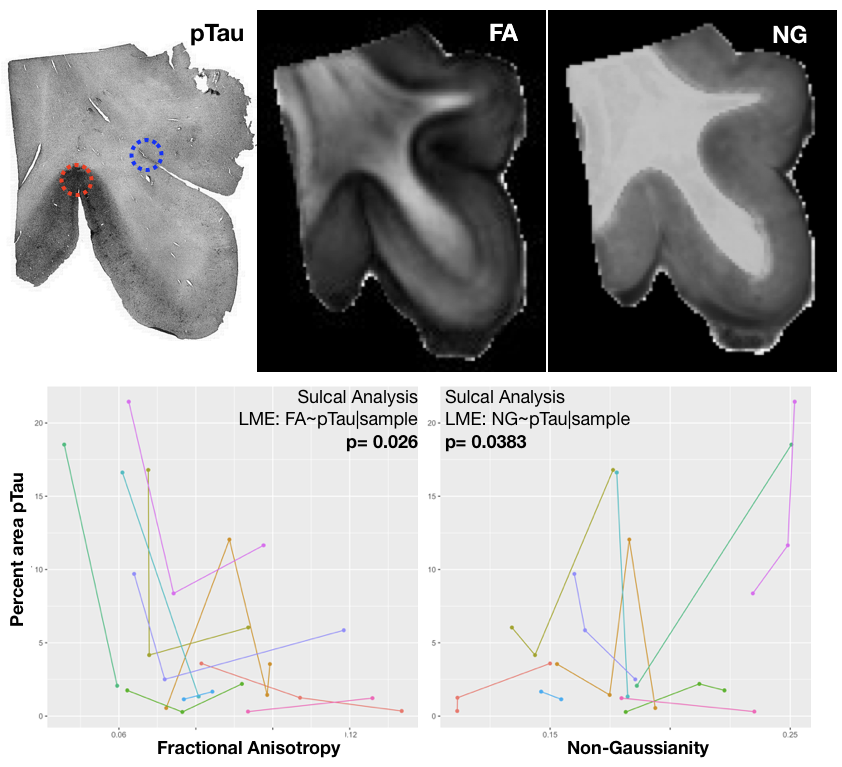
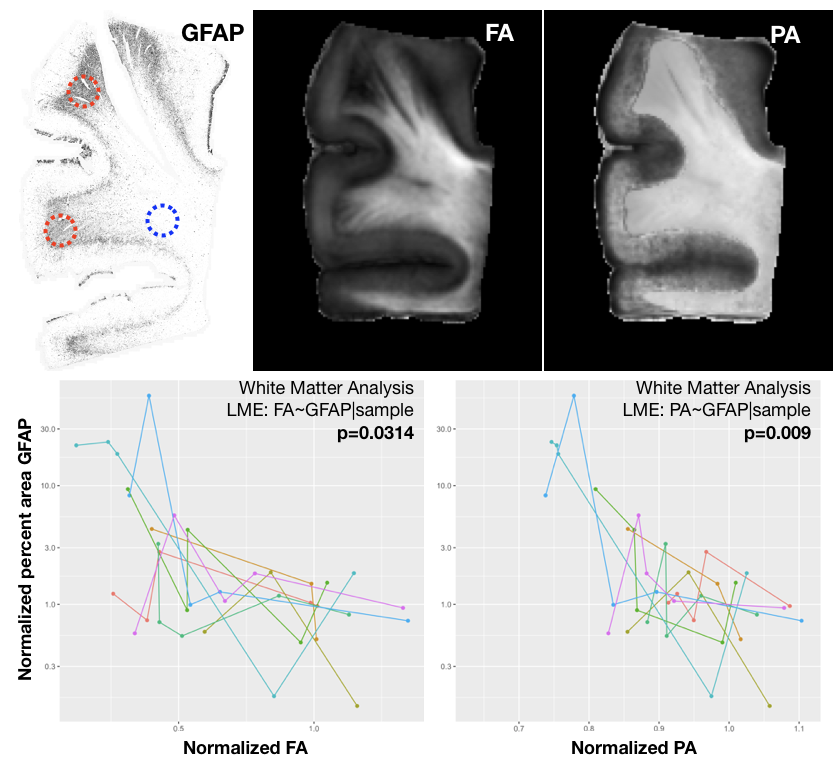
The results of LME analysis of quantitative histology and diffusion MRI values are shown in Figure 2 and indicate significant relationships for both sulcal regions and white matter, but with stronger significance for the white matter. In the sulci, there were no significant findings for Iba-1, but for pTau, both FA and NG demonstrated significant correlation. In the white matter, there were no significant findings for Iba-1, but for GFAP staining four of five metrics demonstrated significance. The relationships between histology and diffusion metrics were further evaluated by plotting value pairs according to sample in the sulci (Figure 3) where lower FA and higher NG corresponded to high pTau staining and in the white matter (Figure 4) where there was a negative correlation for both FA and PA although the visual pattern for these metrics was quite distinct with prominent decreases in FA and only modest decreases in PA despite higher significance for this metric. K-means clustering using DTI and MAP MRI metrics was able to identify ROIs in both gray and white matter (Figure 5), providing an automated method to select MR based ROIs to compare with quantitative histology maps.Discussion
The main findings of our analyses were significantly reduced FA and increased NG in regions of pTau staining and reduced FA and PA in regions of white matter astrogliosis although it is clear that single marker relationships are limited and the combination of different metric behaviors (e.g. using cluster-based segmentation) may be better able to discern pathology in a meaningful way.Acknowledgements
We are grateful to the donors and their families who were able to make this study possible. We would also like to thank the Boston University CTE Center in particular Thor Stein and Victor Alvarez for sample procurement and for providing diagnosis information regarding tissue specimen. Specimen imaging was performed at the Small-Animal Imaging Facility of the Mallinckrodt Institute of Radiology and the Center for Cellular Imaging at Washington University School of Medicine. Support for the data collection portion of this study was provided by NIH UO1 NS086659-02 (Overall P.I: A. McKee, Subproject 3 P.I: Brody).References
1. Shenton, M. E. et al. A review of magnetic resonance imaging and diffusion tensor imaging findings in mild traumatic brain injury. Brain Imaging Behav 6, 137-192, doi:10.1007/s11682-012-9156-5 (2012).
2. Bieniek, K. F. et al. Chronic traumatic encephalopathy pathology in a neurodegenerative disorders brain bank. Acta Neuropathol 130, 877-889, doi:10.1007/s00401-015-1502-4 (2015).
3. McKee, A. C. et al. The first NINDS/NIBIB consensus meeting to define neuropathological criteria for the diagnosis of chronic traumatic encephalopathy. Acta Neuropathol 131, 75-86, doi:10.1007/s00401-015-1515-z (2016).
4. Holleran, L. et al. Axonal disruption in white matter underlying cortical sulcus tau pathology in chronic traumatic encephalopathy. Acta Neuropathol 133, 367-380, doi:10.1007/s00401-017-1686-x (2017).
5. Gangolli, M. et al. Quantitative validation of a nonlinear histology-MRI coregistration method using generalized Q-sampling imaging in complex human cortical white matter. Neuroimage 153, 152-167, doi:10.1016/j.neuroimage.2017.03.059 (2017).
Figures