0923
Repercussions of a single concussion in the mouse brain: insights from functional and structural Magnetic Resonance Imaging.
Xuan Vinh To1 and Fatima A. Nasrallah1,2
1The Queensland Brain Institute, The University of Queensland, Australia, Queensland, Australia, 2The Centre for Advanced Imaging, The University of Queensland, Australia, St Lucia, Australia
1The Queensland Brain Institute, The University of Queensland, Australia, Queensland, Australia, 2The Centre for Advanced Imaging, The University of Queensland, Australia, St Lucia, Australia
Synopsis
Resting-state functional connectivity in mouse model of concussion detected a process of functional adaptation at day 2 post-injury in compensation for white matter injuries: increased connectivity among the Default Mode and Hippocampal Networks and decreased or negative connectivity to the Midbrain. These adaptations maintained cognition and spatial learning but negatively affected the motor and balance functions. The functional adaptations were short-term: at day 7, increased cellularity were detected by Diffusion MRI in grey matter regions involved with day 2 functional adaptations.
Introduction
Concussion is the mildest and extremely common form of Traumatic Brain Injury (TBI)[1] that has garnered public attention recently for its potential long-term consequences.[2], [3] At the moment, evaluations and diagnosis of concussion rely on clinical diagnosis with clinical imaging to rule out other more severe etiologies.[4] Thus, there is an urgent need to develop or improve methods to objectively diagnose concussion presence, severity, and recovery. Our work attempted to assess mice receiving a single concussive injury using a variety of neurological assessments and MRI up to a week post-injury.Methods
We developed an animal model similar to the CHIMERA[5] to replicate the acceleration/deceleration/rotation injury seen in human concussion. C57/Bl6 male mice, 3±0.2 months of age were randomized into the sham group or those which received a single impact and were assessed for Loss-of-Righting-Reflex (LRR) time, modified Neuro Severity Score (NSS)[6], 30-mins single trial Active Placement Avoidance (APA)[7] test, and in vivo 9.4T MRI scans were performed at either day 2 (n=9) or day 7 (n=10) post-injury and day 2 (n=9) post-sham procedure. Animals were maintained under anaesthesia during the scans with 0.25% Isoflurane in 60:40 Air:O2 mix and intraperitoneal medetomidine 0.05 mg/kg bolus + 0.1 mg/kg/h infusion.[8] The DTI/NODDI sequence was acquired with 0.2*0.2*0.3 mm spatial resolution using SE-EPI, TR/TE = 25ms, 3 b-value shells at 600, 1500, and 2000s/mm2. Diffusion MRI data were distortion corrected with FSL’s TOPUP,[9] DTI fitted with b = 600s/mm2 data using FSL’s DTIFIT and NODDI fitted with the NODDI toolbox,[10] and non-linearly registered with FNIRT. rsfMRI data were acquired using GE-EPI, TE/TR = 14/1000ms, flip angle = 70o, 0.3*0.3*0.6 mm resolution, and 600 volumes. rsfMRI data were distortion corrected with FSL’s TOPUP,[9] non-linearly registered using FSL’s FNIRT,[11] band-pass filtered at 0.01-0.3Hz and decomposed into 100 Independent Components (ICs) using Independent Vector Analysis (IVA-GL)[12], [13], and component-component z-score converted correlation scores were compared.Results
Animals following a concussion showed loss of righting reflex,[14] mildly impaired motor/balance skills at day 2 post-injury, which were recovering at day 7 (Figure 2ab). APA performance at both timepoints was slightly better than shams (Figure 1c). At day 2 post-injury, concussed animals presented with axonal injury, evidenced by decreased Fractional Anisotropy (FA), increased Mean Diffusivity (MD), decreased Intracellular Volume Fraction (IcVF), and argyrophilic axonal degeneration in various white matter tracts (Figure 2). IVA-GL networks on day 2 post-injury showed that in TBI animals, connectivity to the midbrain switched from near zero to negatively correlated connections (IC 67, Figure 3c and 3f). This negative connection is reversed and connections returned to near zero at day 7 post-injury (IC 67, Figure 3i). Two-sample test results showed at day 2 post-injury, concussed animals had increased functional connectivity from the Caudate Putamen (CPu) to the Cingulate (CG), Retrosplenial (RSN), and Primary Somatosensory (S1) Areas, and decreased connectivity from the CPu and S1 to the Midbrain (Figure 5b). These changes were not presented at day 7 post-injury, increased functional connectivity was observed in the cortical-subcortical connections (Figure 5d). Lower CG-RSN to hippocampal (HP) connectivity was associated with worse APA task performance (Figure 5e); likewise, weaker Midbrain-CPu/S1 and S1-CG/RSN connectivity were also associated with worse motor/balance outcomes (Figure 5f). In vivo DTI, NODDI, and structural morphometry showed no remarkable changes at day 2 post-injury, except increased local tissue volume (Figure 5a). At day 7 post-injury, concussed animals had widespread increased FA and decreased ODI with mostly unchanged local tissue volume and minor IcVF increases (Figure 5b)Discussion
Hyperconnectivity between the CPu and CG-RSN, and S1 area at day 2 post-injury potentially revealed a compensatory mechanism in response to injured white matter tracts. To further augment the increased connections, the CPu and the S1 area switch their connections to the Midbrain from near zero to a negative correlation. This increase in connectivity might have allowed concussed animals to maintain cognitive and spatial learning capabilities while negative connections impaired the decreased motor/balance capacity. At day 7 post-injury, these connections returned to normal and motor/balance capacity in concussed animals were recovering. At day 7, different functional adaptations existed primarily between cortical and subcortical areas. Further evidence for connectivity adaptations include connectivity strengths between CG-RSN and HP were correlated with memory performance. Strengths of MB-CPu, MB-S1limbs, CG-RSN to supplemental S1 connections were also correlated with motor/balance performance.Increased FA in the grey matter, a clinically relevant biomarker in long-term consequences of human concussions,[15] were previously associated with increased astrogliosis in TBI models;[16] in our model, we did not observe astrogliosis or microgliosis (data not shown), suggesting a novel causal factor. Similar grey matter regions involved in resting-state hyperconnectivity and diffusion changes suggested a link and interactions between grey matter functional and structural changes post-injury in a time-sequential manner.
Conclusions
To the best of this author’s knowledge, this is the first study to show the structural and functional changes in vivo in an animal model of concussion following a single impact. We provide a mechanism whereby the functional changes seem to be driven by associated tissue injury on DTI and supported the behavioural changes associated with concussion. The findings have significant translational prospects for the detection of the effect of concussion in humans.Acknowledgements
This research was supported by Motor Accident Insurance Commission (MAIC), The Queensland Government, Australia (grant number: 2014000857).References
[1] J. D. Cassidy et al., “Incidence, risk factors and prevention of mild traumatic brain injury: Results of the WHO Collaborating Centre Task Force on mild traumatic brain injury,” J. Rehabil. Med., vol. 36, no. SUPPL. 43, pp. 28–60, 2004. [2] M. Cross, S. Kemp, A. Smith, G. Trewartha, and K. Stokes, “Professional Rugby Union players have a 60% greater risk of time loss injury after concussion: A 2-season prospective study of clinical outcomes,” Br. J. Sports Med., vol. 50, no. 15, pp. 926–931, 2016. [3] J. Kamins et al., “What is the physiological time to recovery after concussion? A systematic review,” Br. J. Sports Med., vol. 51, no. 12, pp. 935–940, 2017. [4] A. Stillman, M. Alexander, R. Mannix, N. Madigan, A. Pascual-Leone, and W. P. Meehan, “Concussion: Evaluation and management,” Cleve. Clin. J. Med., vol. 84, no. 8, pp. 623–630, 2017. [5] D. R. Namjoshi et al., “Merging pathology with biomechanics using CHIMERA (Closed-Head Impact Model of Engineered Rotational Acceleration): a novel, surgery-free model of traumatic brain injury,” Mol. Neurodegener., vol. 9, no. 55, p. 55, 2014. [6] M. A. Flierl, P. F. Stahel, K. M. Beauchamp, S. J. Morgan, W. R. Smith, and E. Shohami, “Mouse closed head injury model induced by a weight-drop device,” Nat. Protoc., vol. 4, no. 9, pp. 1328–1337, 2009. [7] E. F. Willis, P. F. Bartlett, and J. Vukovic, “Protocol for short- and longer-term spatial learning and memory in Mice,” Front. Behav. Neurosci., vol. 11, no. October, 2017. [8] F. A. Nasrallah, H. Tay, and K. Chuang, “Detection of functional connectivity in the resting mouse brain,” Neuroimage, vol. 86, pp. 417–424, 2014. [9] X. Hong, X. V. To, I. Teh, J. Rui, and K. Chuang, “Evaluation of EPI distortion correction methods for quantitative MRI of the brain at high magnetic fi eld,” Magn. Reson. Imaging, vol. 33, no. 9, pp. 1098–1105, 2015. [10] M. Tariq, T. Schneider, D. C. Alexander, C. A. Gandini Wheeler-Kingshott, and H. Zhang, “Bingham-NODDI: Mapping anisotropic orientation dispersion of neurites using diffusion MRI,” Neuroimage, vol. 133, pp. 207–223, 2016. [11] S. M. Smith et al., “Advances in functional and structural MR image analysis and implementation as FSL,” Neuroimage, vol. 23, no. SUPPL. 1, pp. 208–219, 2004. [12] M. Anderson, T. Adali, and X.-L. Li, “Joint blind source separation swith multivariate gaussian model: Algorithms and performance analysis,” IEEE Trans. Signal Process., vol. 60, no. 4, pp. 1672–1683, 2012. [13] J. H. Lee, T. W. Lee, F. A. Jolesz, and S. S. Yoo, “Independent vector analysis (IVA): Multivariate approach for fMRI group study,” Neuroimage, vol. 40, no. 1, pp. 86–109, 2008. [14] M. W. Wojnarowicz, A. M. Fisher, O. Minaeva, and L. E. Goldstein, “Considerations for experimental animal models of concussion, traumatic brain injury, and chronic traumatic encephalopathy-these matters matter,” Front. Neurol., vol. 8, no. JUN, pp. 1–14, 2017. [15] S. Bouix, O. Pasternak, Y. Rathi, P. E. Pelavin, R. Zafonte, and M. E. Shenton, “Increased gray matter diffusion anisotropy in patients with persistent post-concussive symptoms following mild traumatic brain injury,” PLoS One, vol. 8, no. 6, 2013. [16] M. D. Budde, L. Janes, E. Gold, L. C. Turtzo, and J. A. Frank, “The contribution of gliosis to diffusion tensor anisotropy and tractography following traumatic brain injury: Validation in the rat using Fourier analysis of stained tissue sections,” Brain, vol. 134, no. 8, pp. 2248–2260, 2011.Figures
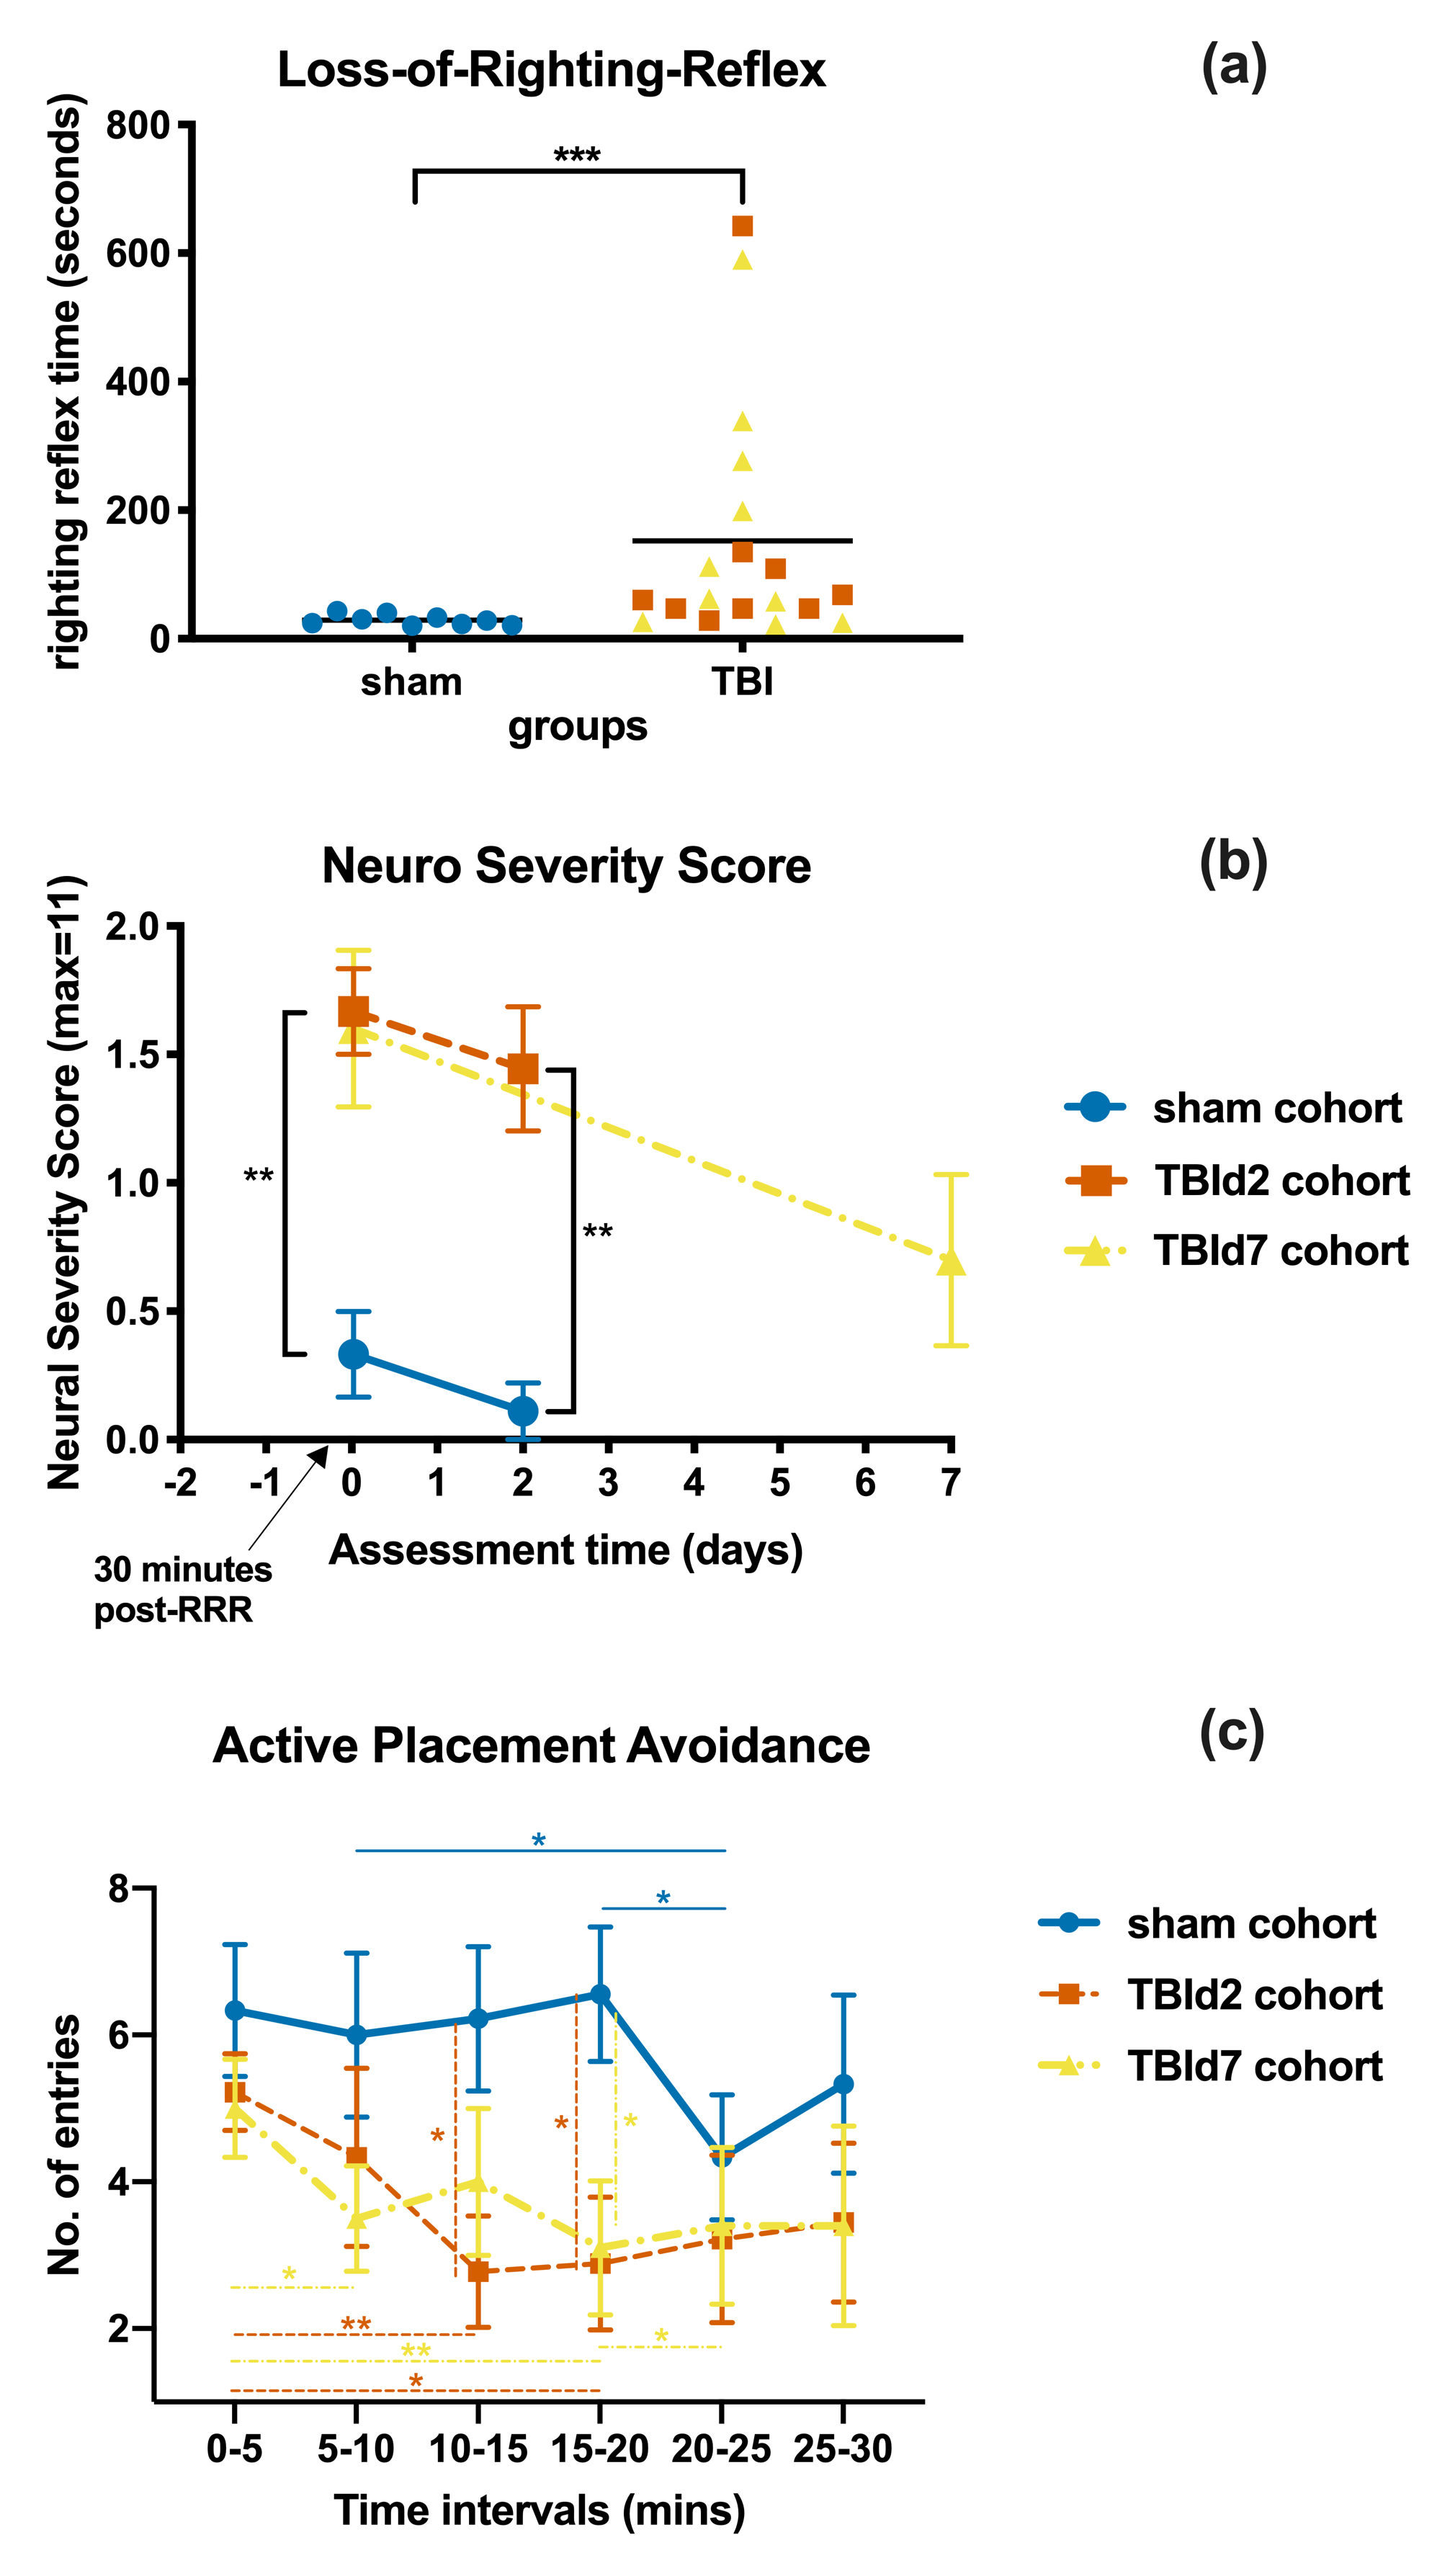
Behavioural measures of TBI and sham cohorts: (a) Loss-of-Righting-Reflex time after impact or sham procedure (b) Neuro Severity Score of different cohorts measured at 30-minutes post-recovery or at the day of MRI scan (c) total number of entries into the shock zone during each 5 minutes intervals of a single 30-minutes Active Placement Avoidance trial. P Value < 0.05 (*), 0.01 (**), 0.001 (***), (b and c) 2 samples Mann-Whitney tests, 2-tailed. (c) post-hoc Fisher’s Least Squared Difference test following two-way repeated measures ANOVA.
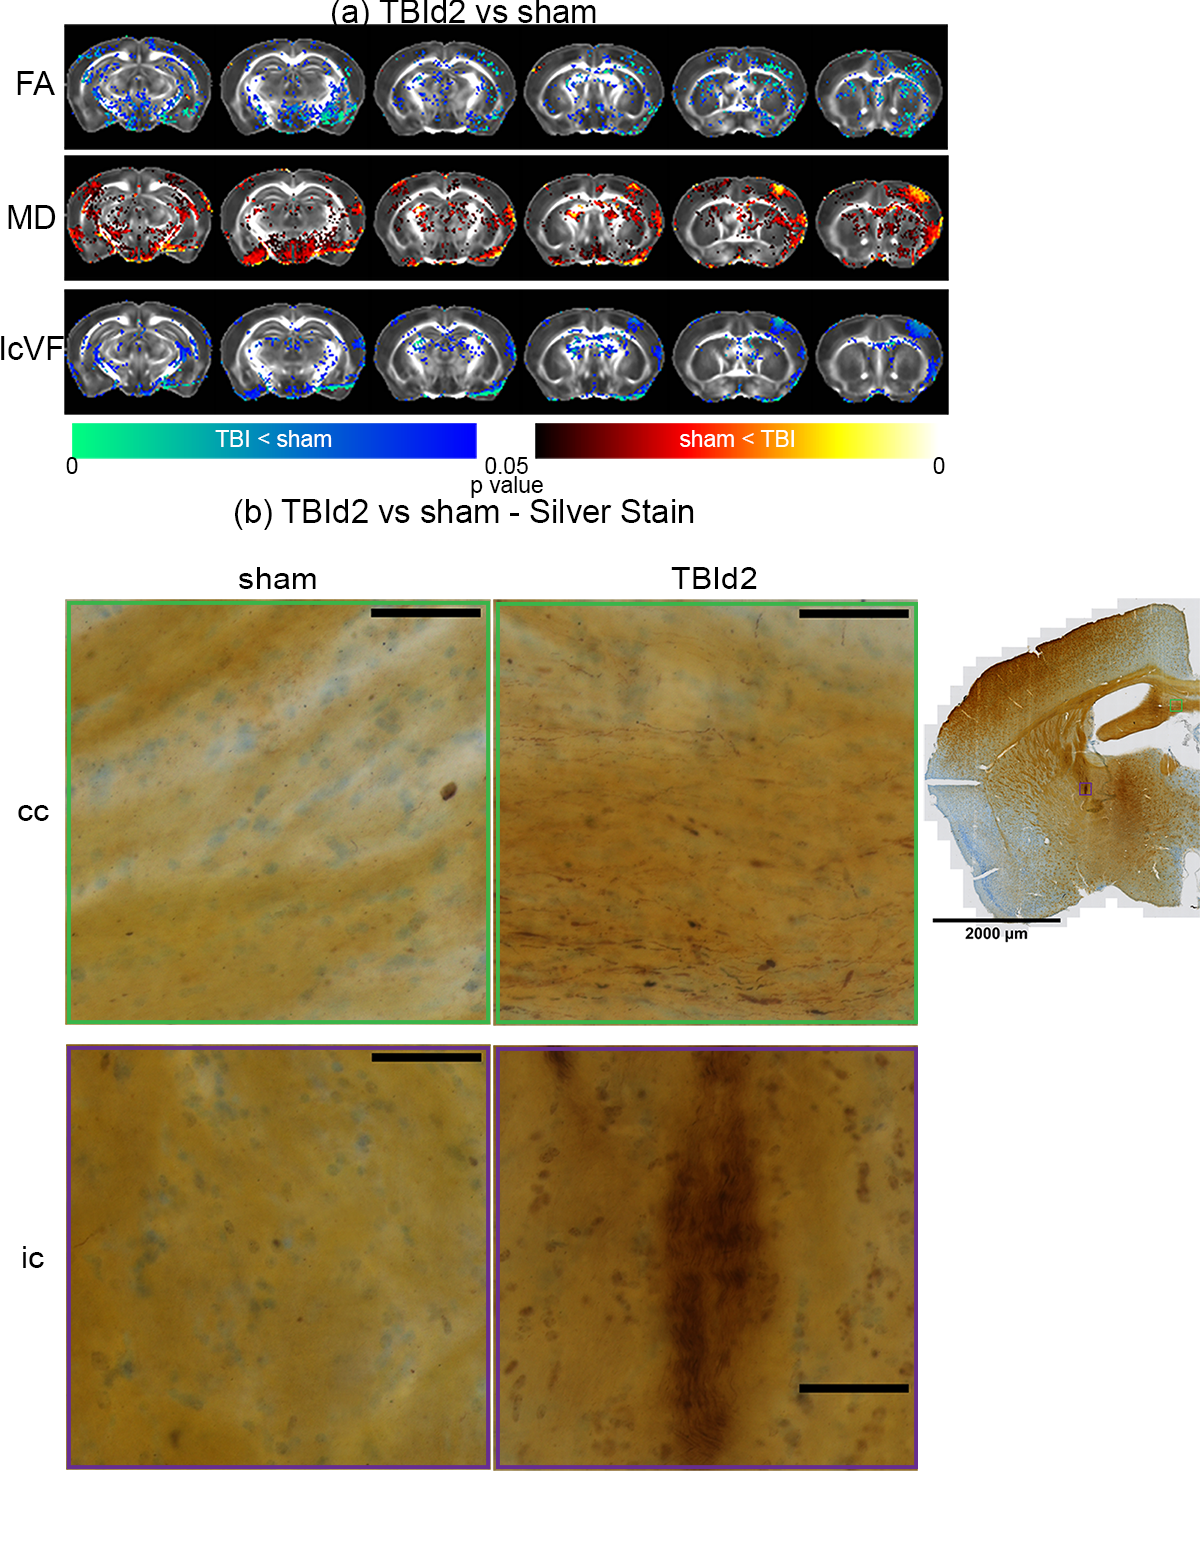
Imaging and silver stain evidences of white matter injuries in single concussed animals at day 2 post-injury: (a) Voxel-wise analysis results of DTI (FA =
Fractional Anisotropy, MD = Mean Diffusivity), and NODDI metrics (IcVF =
Intracellular Volume Fraction) concussed animals (n = 6) compared to shams (n = 7). P value < 0.05, two-tailed, unpaired two sample
t-test, permutation tested. (b) De Olmos silver stained images concussed and sham animals showing examples of argyrophilic degenerating axons of the Corpus Callosum (cc), and Internal Capsule (ic). Scale bar = 50 um.
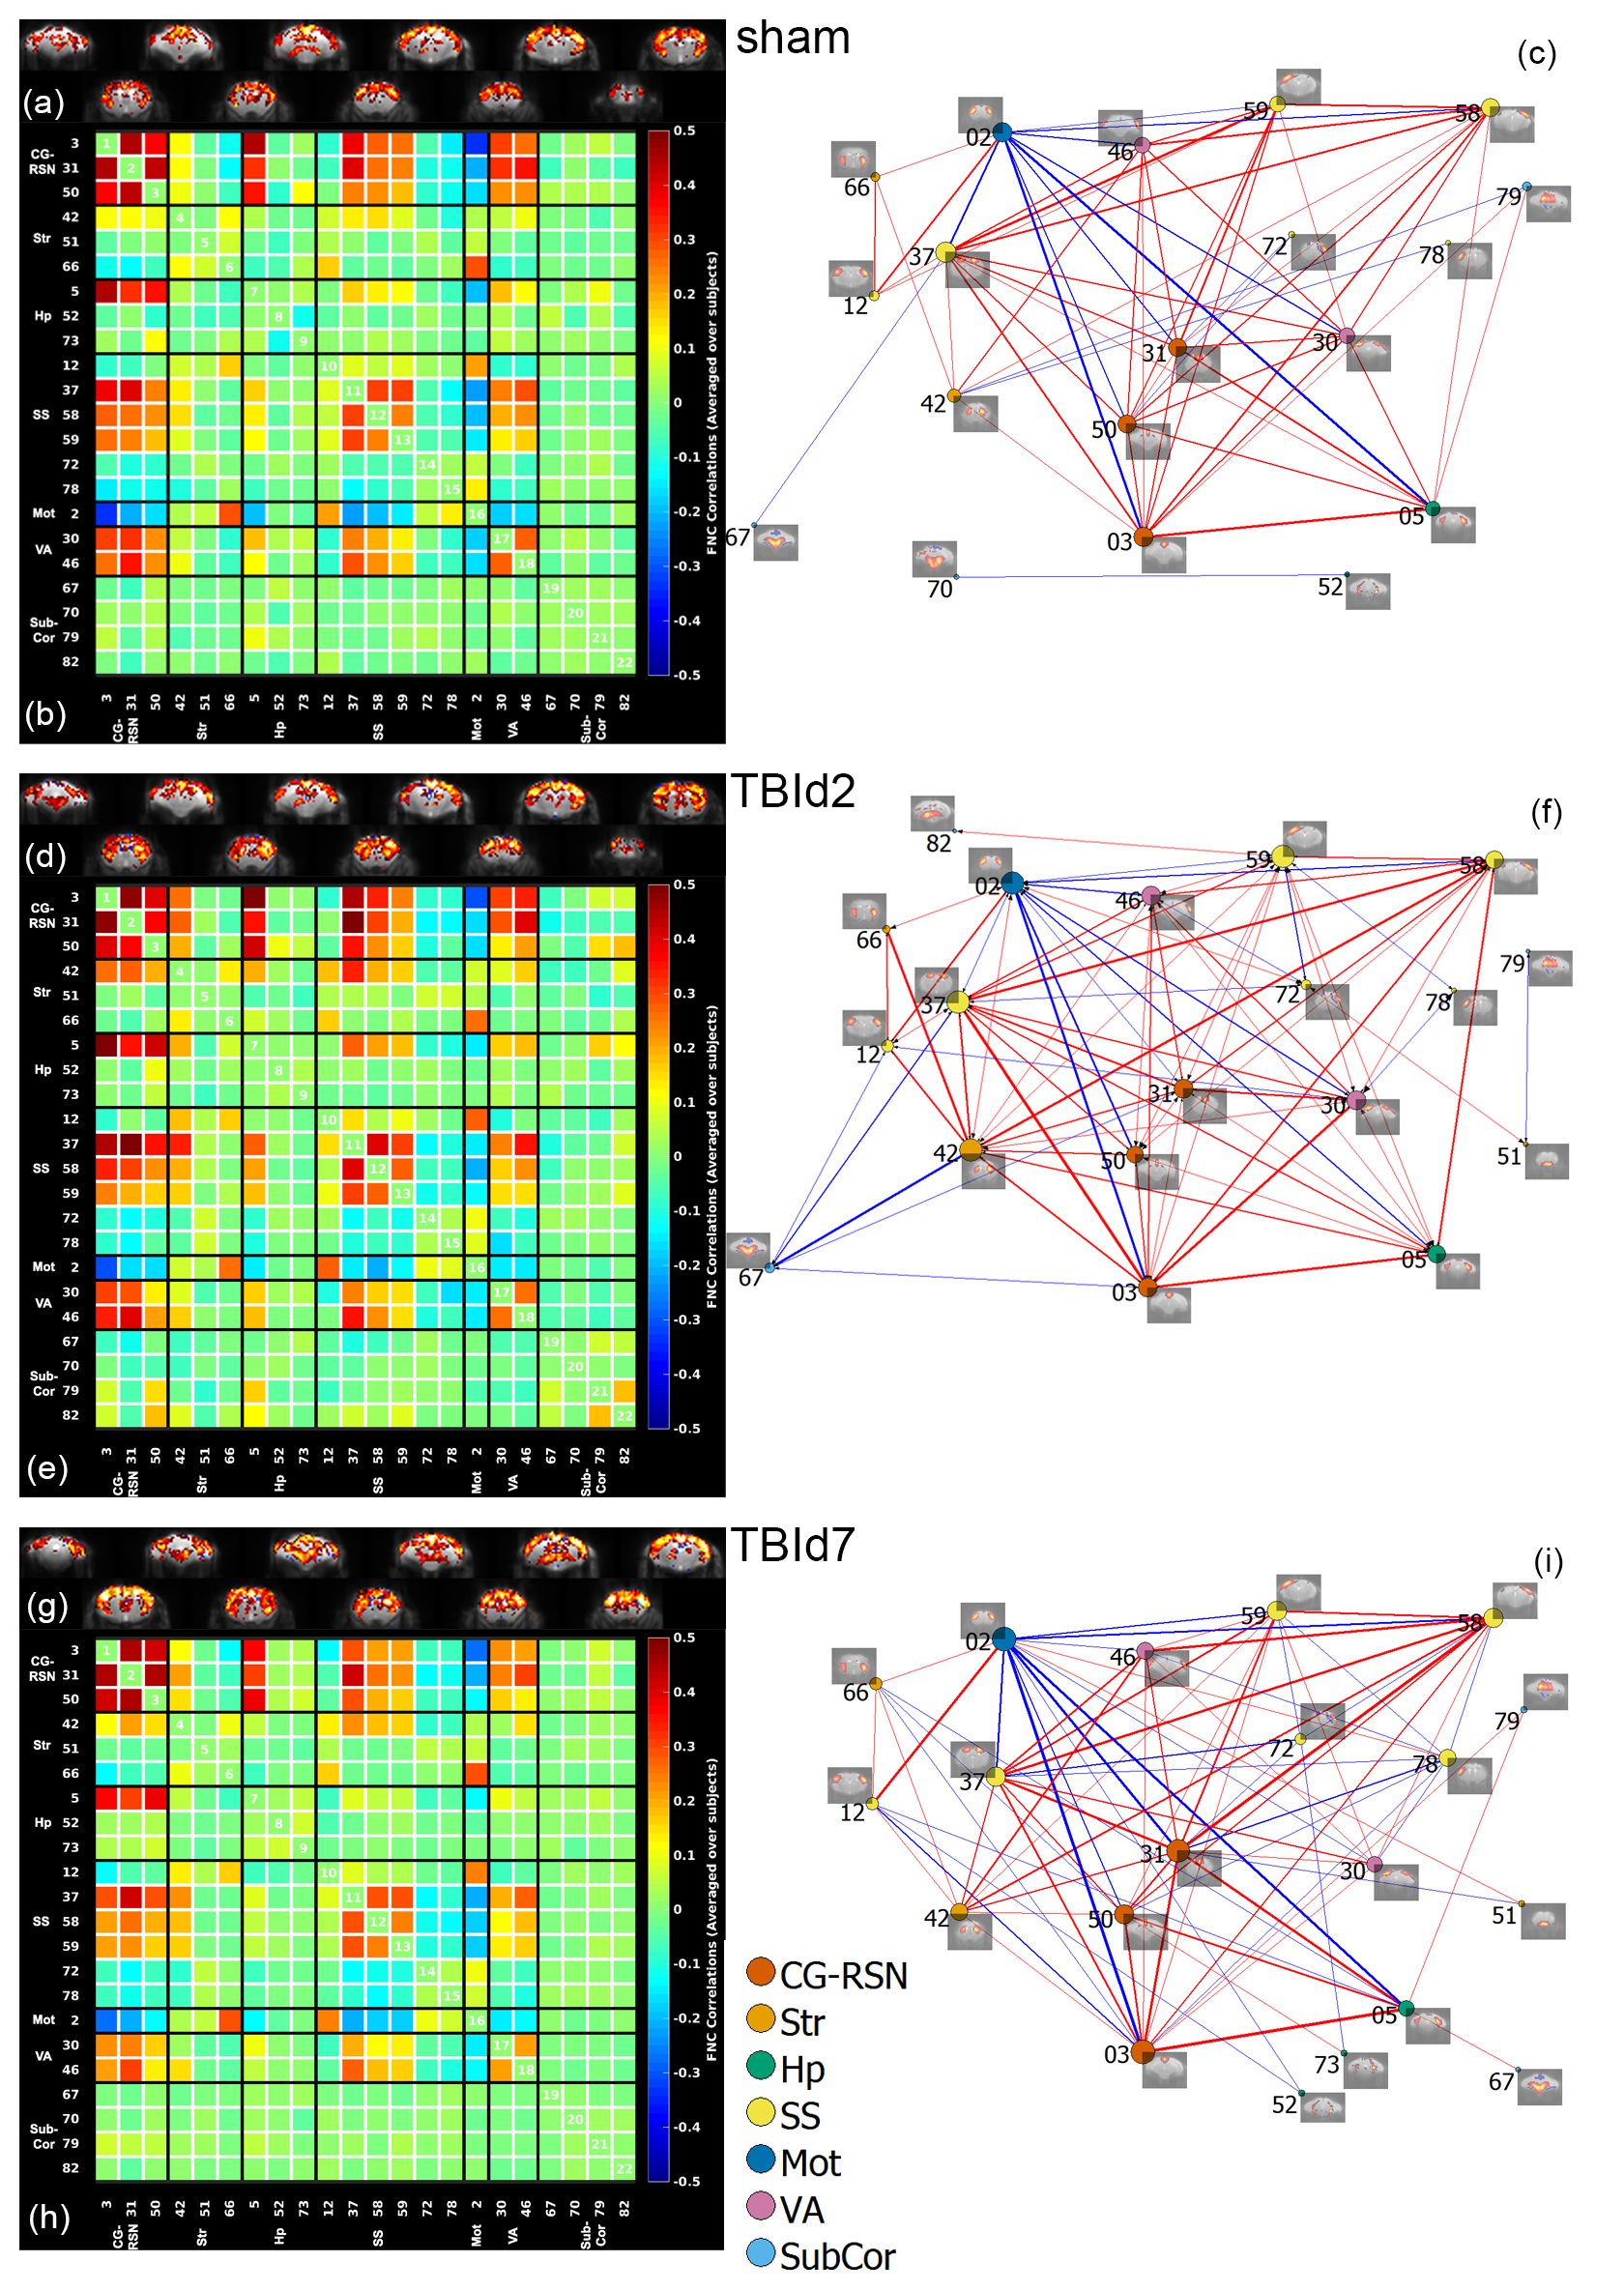
Group-level resting-state functional
connectivity of sham (n = 9), day 2 (n = 9) and day 7 (n = 10) post-injury animals. (a, d, g) aggregated one sample t-test results of independent component (IC) spatial maps of each
group, p value < 0.01, FDR corrected;
(b, e, g) average IC-IC functional network correlation score of each group; (c,
f, i) graph group-averaged IC-IC connectivity: nodes defined as ICs and edges defined as connections with P value < 0.05, two-tailed, one sample t-test, permutation-tested, FDR corrected. Red = positive
correlation, blue = negative correlation.
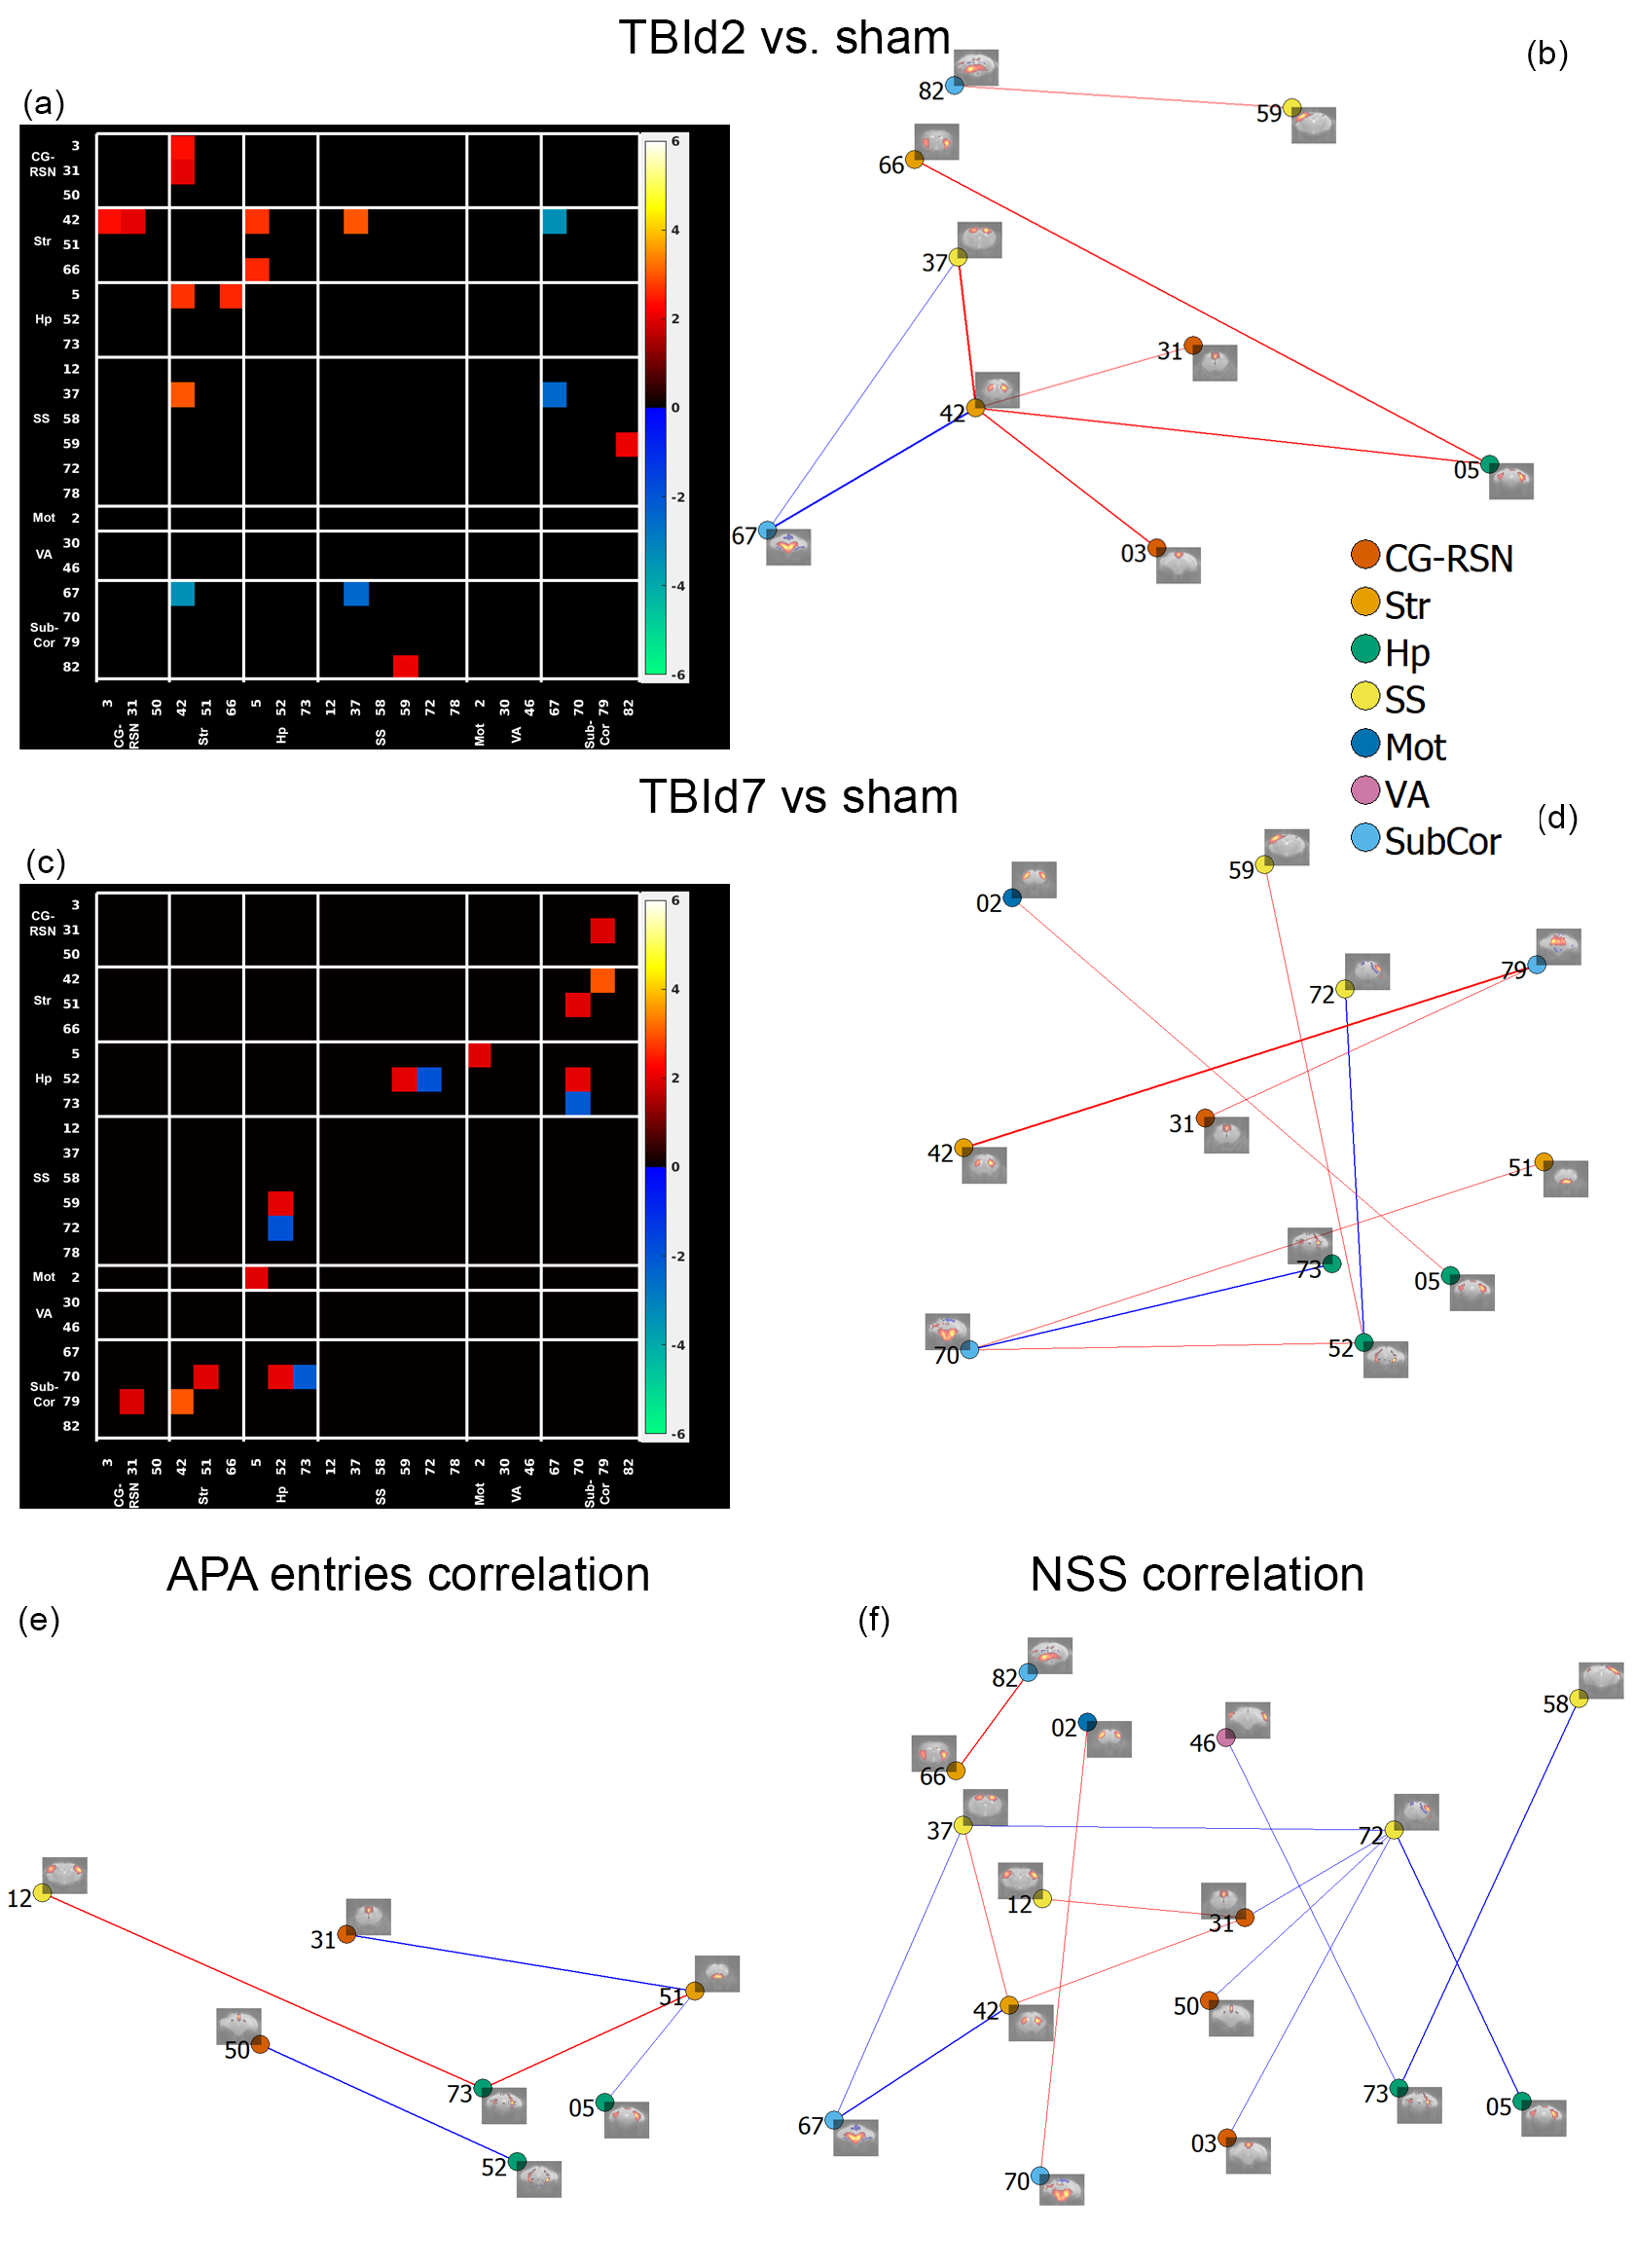
FC differences
between concussed and sham animals connectivity correlations with behavioural performances.
2 sample t-test of IC-IC connectivity in TBId2 vs. sham (a, b) and TBId7 vs.
Sham (c, d); P value < 0.05, two-tailed,
permutation tested two samples t-test. Red = TBI > sham, blue = TBI <
sham.
(e,f):
IC-IC connection strength correlated with number of shock zone entries in 10-20
mins interval (e; fewer was better) and Neuro Severity Score (NSS) (f; lower was
better) P value < 0.05, two-tailed, permutation tested. Red edges = positive
correlation; blue edges = negative correlation.
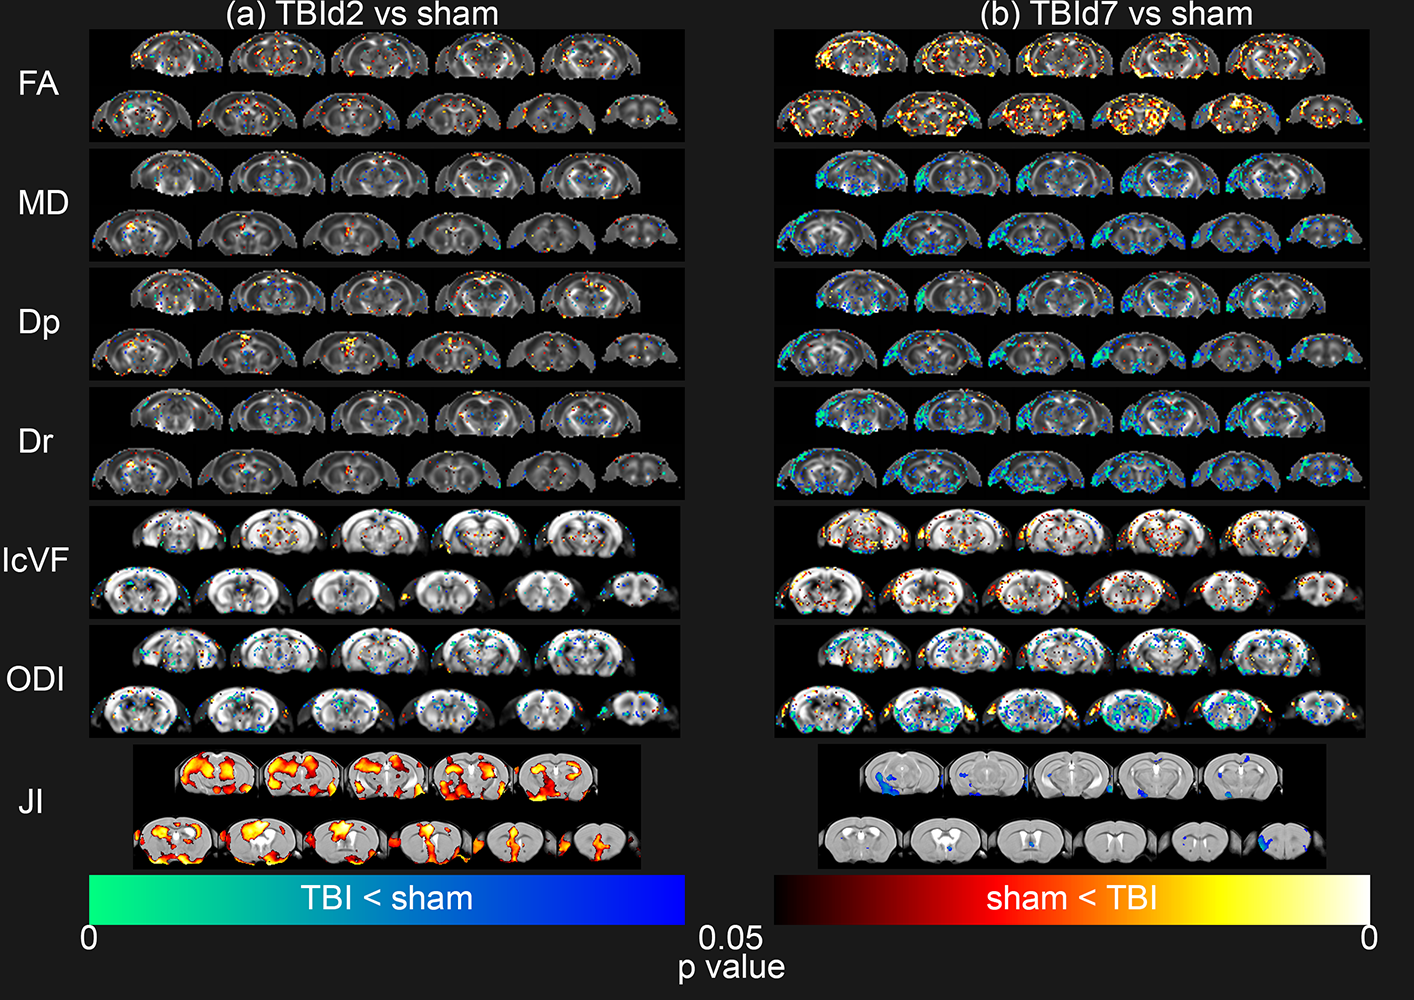
Voxel-by-voxel
statistical analysis results of Diffusion Tensor Imaging metrics (FA = Fractional Anisotropy, MD = Mean
Diffusivity, Dp = Parallel Diffusivity, Dr = Radial Diffusivity) and
Neurite Orientation Dispersion and Density Imaging metrics (IcVF = Intracellular Volume Fraction, ODI = Orientation Dispersion Index) and Tensor Based Morphometry (JI = Jacobian Index) of
TBId2 (n = 9, a) and TBId7 (n = 10, b) groups compared to sham (n = 9) group, thresholded
at P value < 0.05, two-tailed, permutation tested unpaired two sample t-test.