0919
Altered neurometabolic changes in acute mild traumatic brain injury patients: a SPICE study1Radiology department, The Fifth People's Hospital of Shanghai, Shanghai, China, 2Institute for Medical Imaging Technology, School of Biomedical Engineering, Shanghai Jiao Tong University, Shanghai, China, 3Neurosurgery department, The Fifth People's Hospital of Shanghai, Shanghai, China, 4Beckman Institute for Advanced Science and Technology, University of Illinois at Urbana-Champaign, Urbana, IL, United States, 5Department of Electrical and Computer Engineering, University of Illinois at Urbana-Champaign, Urbana, IL, United States, 6Med-X Research Institute, Shanghai Jiao Tong University, Shanghai, China
Synopsis
Mild traumatic brain injury (mTBI) is the most prevalent form of brain injury but the underlying physiological mechanisms are still not fully understood. MRSI has long been recognized as a potentially powerful tool for detection of neurometabolic alterations induced by TBI but most existing studies are limited by low resolution. In this study, we used a 3D high-resolution MRSI technique, known as SPICE, to study neurometabolic alterations in acute mTBI patients. Our experimental results showed various metabolic changes in different areas of patients, which lay a foundation for further investigation to gain new insights into the pathophysiology underlying acute mTBI.
Introduction
Mild traumatic brain injury (mTBI) is the most prevalent form of brain injury, accounting for over 70% of the hospital visits 1. However, the mechanisms underlying the clinical and cognitive symptoms in acute mTBI are still not fully understood. Diffuse axonal injury (DAI) is a major complication of TBI resulting from traumatic shearing forces on nerve cells, which leads to widespread cognitive dysfunction 2. However, the DAI detection in acute mTBI using conventional MRI was often negative and the pathophysiology underlying the tissue damage remains unclear. There is an urgent need for more sensitive biomarkers to reveal the subtle pathological alterations underlying mTBI in the acute stage 3. MRSI has long been recognized as an ideal tool for detection of neurometabolic alterations induced by TBI. For example, using 1H-MRSI, N-acetylaspartate (NAA) can be measured as a marker of neuronal integrity, choline (Cho) as a marker of cellular membrane turnover, and myo-inositol (mI) as a marker of astrocytosis. However, the poor spatial resolution and partial volume effects associated with current MRSI techniques greatly reduce the sensitivity for detection of neurometabolic changes in DAI lesions. In this study, we used a newly developed 3D high-resolution MRSI technique, known as SPICE (SPectroscopic Imaging by exploiting spatiospectral CorrElation), to study the neurometabolic alterations in mTBI patients in the acute stage (<7d). We acquired 3D 1H-MRSI data at a 2.0 x 3.0 x 3.0 mm3 nominal resolution within an 8-minute scan; we compared the between group metabolic changes in corpus callosum (CC), which is the most vulnerable region, and hippocampus and amygdala which are closely related with cognitive impairment in TBI patients. Our results showed noticeable neurometabolic alterations in different brain areas of the patients.Method
We prospectively recruited 34 mTBI patients (GCS score: 13-15; LOC < 30 min; PTA <24 hours) and 31 age-matched healthy subjects into this study. The patients were scanned at an average of 1.3 days post injury (range 1-7days). Exclusion criteria included the presence of a contraindication for MRI, previous brain injury or surgery, or a history of neurological disease, psychiatric illness, and substance abuse. This study was approved by the IRB of The Fifth People’s Hospital of Shanghai, China. Written informed consent was obtained from all participants. The MR scans were performed on a 3T MR scanner (Siemens Skyra). The scanning protocols included 3D MRSI scan using SPICE sequence 4-6 (TR/TE = 160/1.6 ms, resolution = 2.0 x 3.0 x 3.0 mm3, FOV = 240 x 240 x 120 mm3, scan time = 8 min), 3D MPRAGE imaging (TR/TE/TI = 2400/2.13/1100 ms, resolution = 1.0x1.0x1.0 mm3, FOV = 256 mm, 192 slices), diffusion-tensor imaging (DTI) (TR/TE = 8300/74 ms, resolution = 2x2x2 mm3, FOV = 256 mm, 75 slices, b = 1000s/mm2), and 3D Fluid-Attenuated Inversion Recovery (FLAIR) imaging (TR/TE/TI = 5000/395/1800 ms, resolution = 1.0x1.0x1.0 mm3, FOV = 256 mm, 192 slices). The spatiospectral functions of metabolites were reconstructed using a union-of-subspaces model, incorporating pre-learned spectral basis functions 5-7. The spectral quantification was done using an improved LCmodel-based algorithm that incorporated both spatial and spectral priors 8. The reported metabolite concentrations were normalized to the companion water signals, since no water suppression was applied in the SPICE sequence. The MRSI and DTI images were coregistered to T1w image using affine linear transformation. The statistical analyses were performed to compare the regional neurometabolic changes in the CC, bilateral amygdala and hippocampus. The segmentation of bilateral amygdala and hippocampus was done using T1w images by Freesurfer 6.0. The CC was extracted and divided into three sub-regions: splenium, genu and body, using DTI images by FSL. Independent two-sample t-test was conducted for the comparison.Results and Discussion
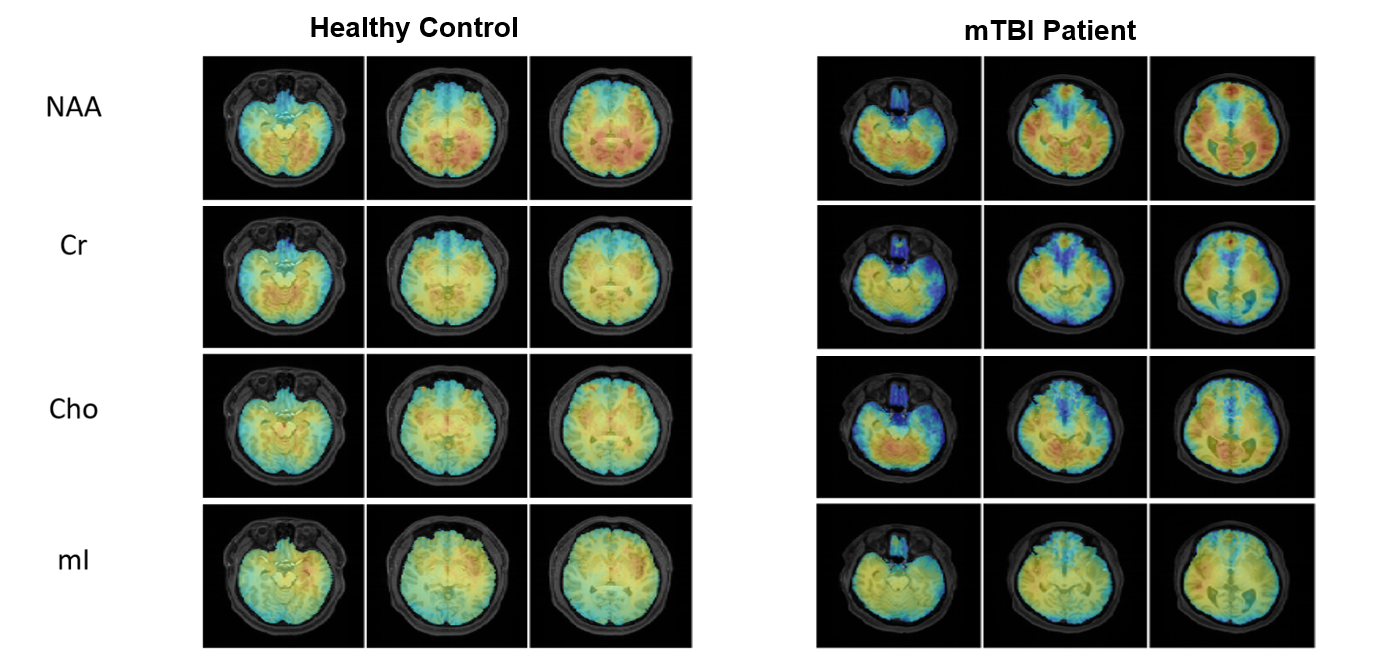
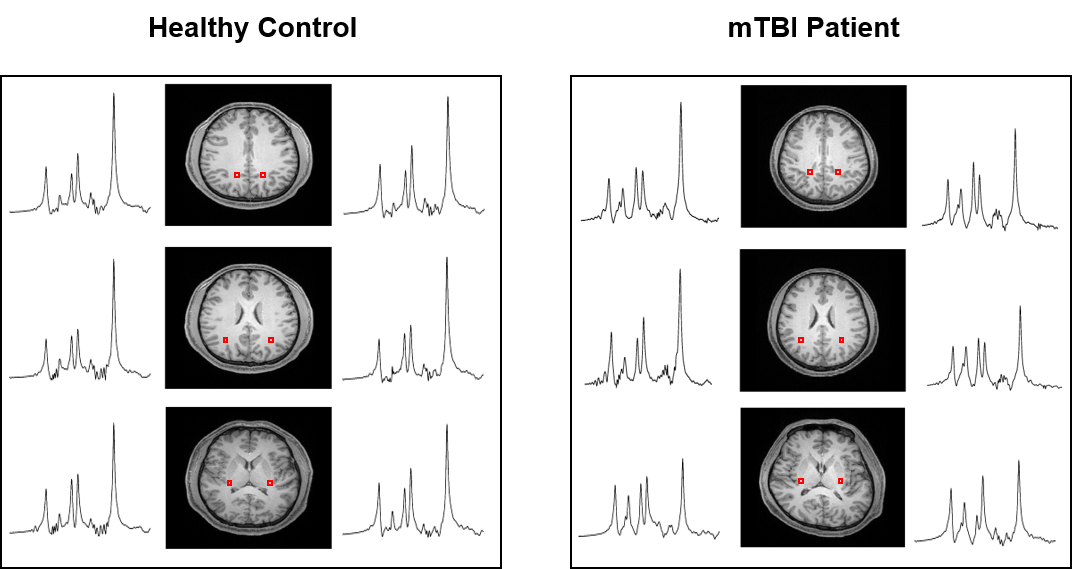
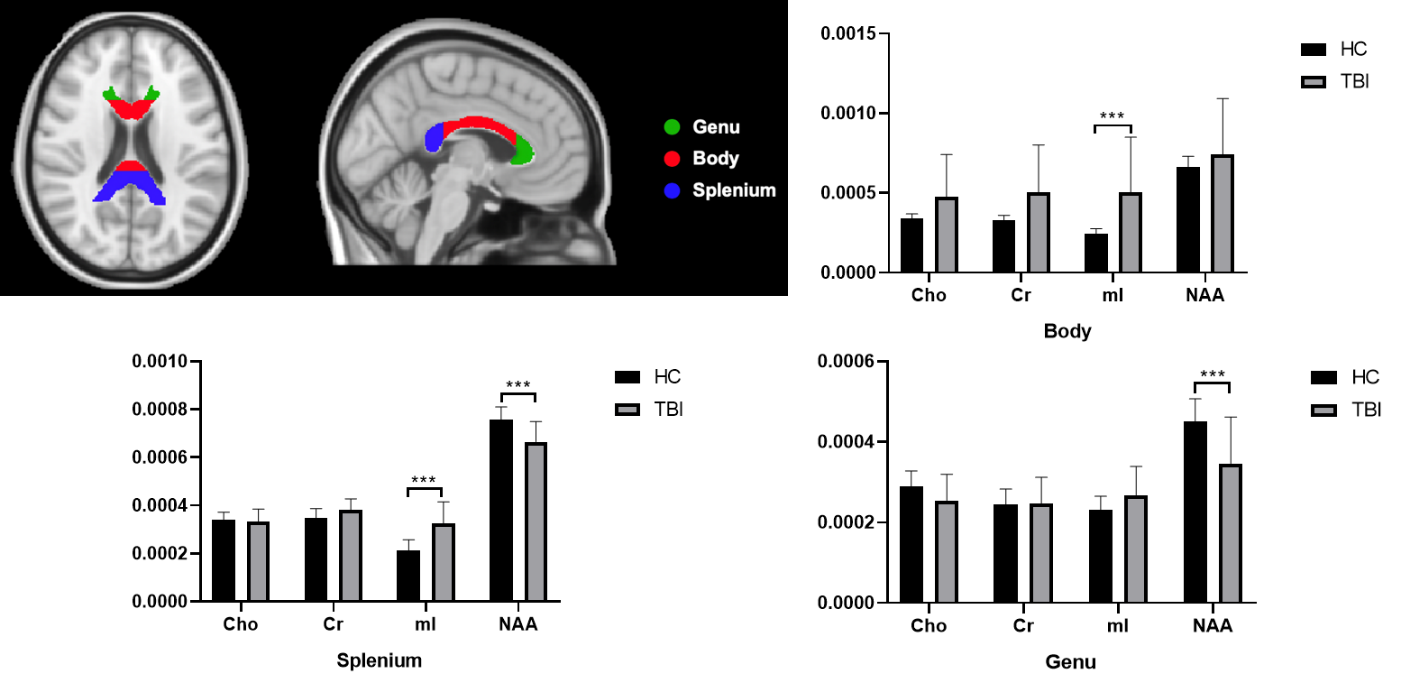
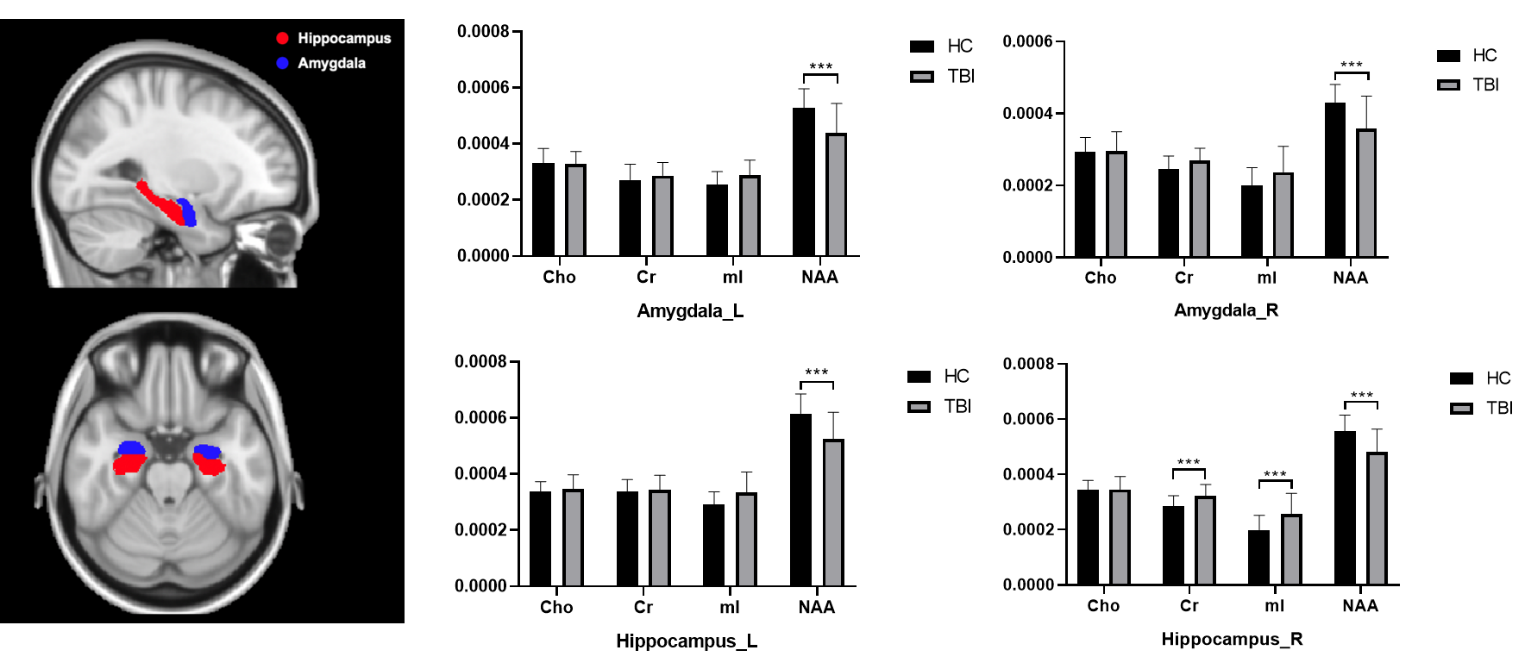
Figure 1 shows a set of representative metabolic maps of an mTBI patient and a healthy subject. The whole brain covered, high-resolution, high-quality spatial distributions of NAA, creatine (Cr), Cho and mI have been obtained successfully from the SPICE sequence. Figure 2 shows the comparison of spatially resolved spectra. In this case, no significant differences were observed in the structural images, but the MRSI spectra revealed a reduction of NAA and increase of mI in the mTBI patient. As shown in Figure 3, a significant reduction in NAA in the genu and splenium parts of CC and an increase of mI in the splenium and body of CC (Bonferroni-corrected p<0.0018) were observed. In Figure 4, the NAA decreases were observed in bilateral amygdala and hippocampus, while increases of mI and Cr were shown in right hippocampus of mTBI patients (Bonferroni-corrected p<0.0018).Conclusion
This paper reports a first study on the use of 3D high-resolution MRSI to assess neurometabolic alterations in acute mTBI patients. Our results showed noticeable neurometabolic changes in CC, amygdala and hippocampus of the patients. The findings may provide a foundation for further investigation to gain new insights into the pathophysiology underlying the DAI damage in acute mTBI using 3D high-resolution MRSI.Acknowledgements
This work is supported by National Science Foundation of China (No.61671292 and 81871083) and Key Program of Multidisciplinary Cross Research Foundation of Shanghai Jiao Tong University (YG2017ZD13) and Shanghai Municipal Commission of Health and Family Planning (No. 20154Y0094).References
1. Arciniegas DB, Anderson CA, Topkoff J and McAllister TW. Mild traumatic brain injury: A neuropsychiatric approach to diagnosis, evaluation, and treatment. Neuropsychiatr Dis Treat 2005, 1:311–327.
2. Cook GA and Hawley JS. A review of mild traumatic brain injury diagnostics: current perspectives, limitations, and emerging technology. Military medicine 2014, 179:1083-1089.
3. Lin AP, Liao HJ, Merugumala S K, et al. Metabolic imaging of mild traumatic brain injury. Brain Imaging Behav 2012, 6:208-223.
4. Lam F and Liang ZP. A subspace approach to high‐resolution spectroscopic imaging. Magn Reson Med 2014, 71:1349-1357.
5. Lam F, Ma C, Clifford B, et al. High-resolution 1H‐MRSI of the brain using SPICE: data acquisition and image reconstruction. Magn Reson Med 2016, 76:1059-1070.
6. Peng X, Lam F, Li Y, et al. Simultaneous QSM and metabolic imaging of the brain using SPICE. Magn Reson Med 2018, 79:13-21.
7. Ma C, Lam F, Johnson CL, et al. Removal of nuisance signals from limited and sparse 1H MRSI data using a union‐of‐subspaces model. Magn Reson Med 2016, 75:488-497.
8. Li Y, Lam F, Clifford B, et al, A Subspace Approach to Spectral Quantification for MR Spectroscopic Imaging. IEEE Trans Biomed Eng 2017, 64:2486-2489.
Figures