0918
A correlation analysis between DTI/DKI derived metrics and metabolite levels in the brain of HIV+ individuals1Radiology, University of Miami, Miami, FL, United States, 2Postgraduate Institute for Medical Education & Research, Chandigarh, India, 3Psychiatry and Behavioral Sciences, University of Miami, Miami, FL, United States
Synopsis
Several studies have focused on diffusion tensor imaging (DTI) as marker for structural damage in the brain due to infection from human immunodeficiency virus (HIV). However, few have associated the findings from diffusion kurtosis imaging (DKI) and magnetic resonance spectroscopic imaging (MRSI) measures. In this work, we correlate measures of DTI and DKI with MRSI in order to evaluate associations between structural alterations and changes in metabolite concentrations within the brain of HIV individuals.
Introduction
Human immunodeficiency virus (HIV) is known to have sustained impact on the central nervous system (CNS) even in those taking HIV medications (i.e., ART), which is known to result in neurocognitive impairment. Most imaging research studies have focused on tissue structural alterations, primarily using diffusion tensor imaging (DTI), as a quantitative assessment of structural integrity1. Other imaging techniques can also be used to monitor brain inflammation and neuronal damage associated with HIV, such as magnetic resonance spectroscopic imaging (MRSI) and diffusion kurtosis imaging (DKI). DKI is better than DTI in describing the non-Gaussian diffusion that occurs in tissue water2. In this study, our aims are twofold: 1) to evaluate associations between DTI/DKI and MRSI measures, and 2) to establish if any observed correlations can be localized to some specific regions of the brain that are more affected by HIV infection.Methods
Our multi-modal MR data were collected using a 3T MRI scanner available at the Post Graduate Institute of Medical Education & Research (PGIMER) in India from 150 volunteers with 81 HIV-treatment-naïve Clade-C HIV+ subjects (55/26 male/female; age: 32.23 ± 6), and 62 HIV- individuals as a control group (41/21 male/female; age: 29.6 ± 7). We acquired 9 b0 and 60 dual-shell (b = 1000/2000 s/mm2) DW-images using 30 gradient directions per shell. For DTI and DKI analysis, we used the following parameters: 1.5 × 1.5 × 3.0 mm3 spatial resolution, TR = 1150 ms, TE = 98 ms, 54 axial slices. Whole brain metabolite and water non-suppressed water reference MRSI data were acquired in the same scanning session. DTI/DKI images are pre-processed for eddy current, motion correction, and brain extraction using FSL. Tensor fitting was performed using the DIPY software3, from which we obtained the following parametric maps: fractional anisotropy (FA), mean-, axial-, and radial-diffusivity (MD, AD, RD), kurtosis fractional anisotropy (kFA), and mean-, axial-, and radial-kurtosis (MK, AK, RK). The MRSI datasets were processed using the Metabolite Imaging and Data Analysis System (MIDAS) platform4,5. We used the MIDAS’s Map-INTegrated (MINT) module for integration of spectra from voxels within a region of interest (ROI) to create a single integrated spectrum and performed spectral fitting. For the purpose of this study, we only examined N-acetyl aspartate (NAA) and myo-inositol (MI) because these two metabolites showed significantly bigger alterations throughout the brain due to HIV infection (see abstract # 6690). Using a modified JHU-MNI-SS-type2 atlas, we evaluate metabolite levels and DTI/DKI metrics at approximately identical ROIs. We calculated Z-scores to discard all outlying data points with more than 3 standard deviations. For our first test, we calculated the Pearson’s coefficient r to determine positive or negative correlations between DTI/DKI metrics (FA, MD, AD, RD, kFA, MK, AK, and RK) and NAA at each ROI for controls and HIV+ subjects separately. For the second test, we calculate r for DTI/DKI metrics against MI.Results
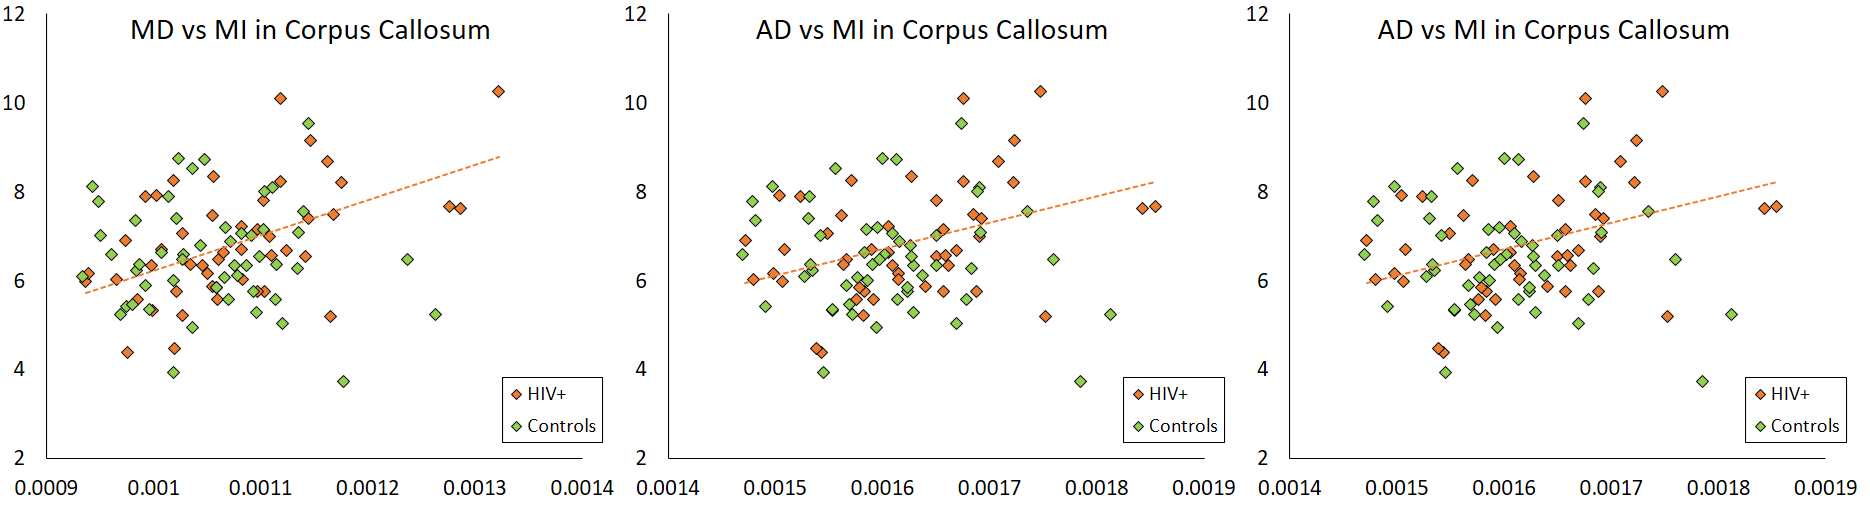
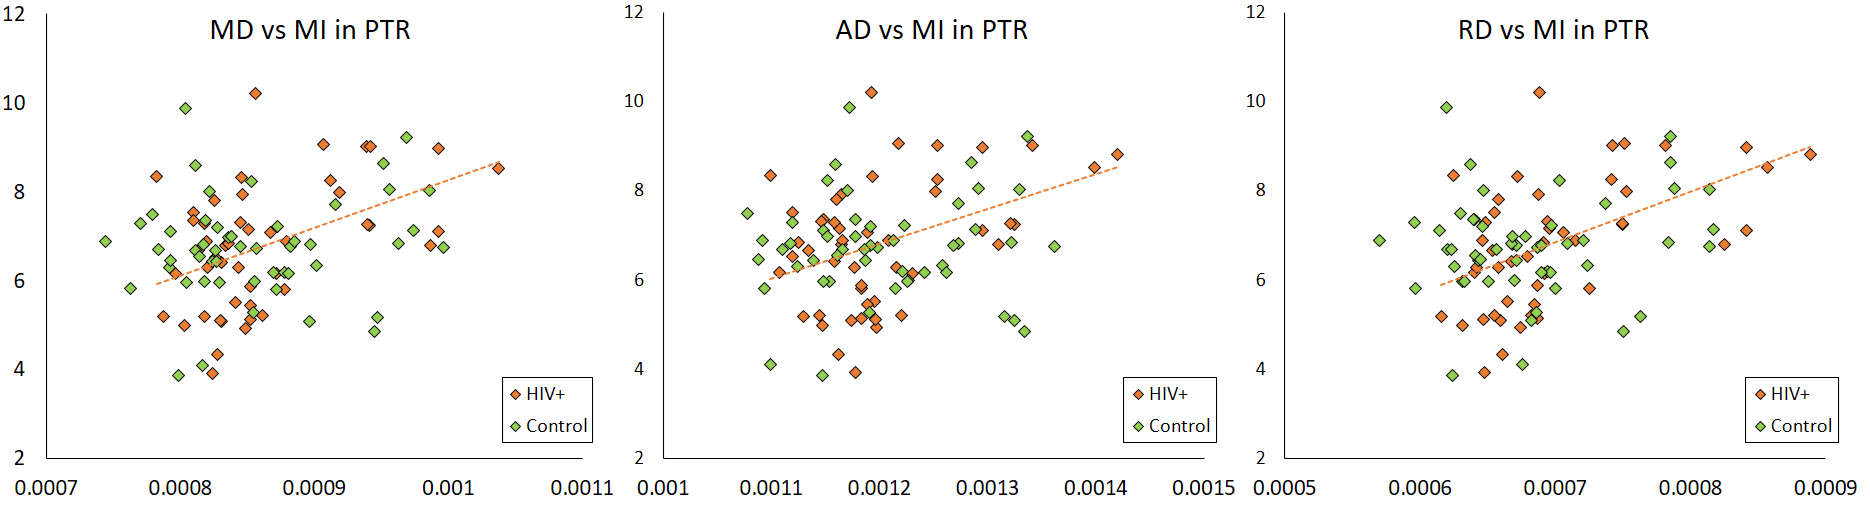
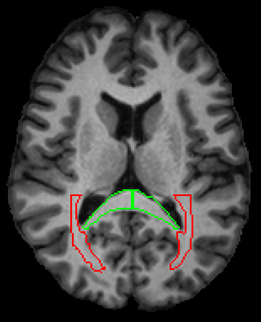
In the control group, we observed weak to no correlations (abs(r) < 0.3) for both NAA and MI. In the HIV+ group, we observed moderate correlations (0.3 < abs(r) < 0.6; p < 0.05) in several ROIs for NAA and MI. For MI, we note positive correlations with DTI derived diffusivity measures (MD, AD, RD) in 9 ROIs, mainly contained in the white mater (WM) regions. The strongest correlations (r = 0.561; p < 0.0001) appear in the splenium of the corpus callosum (SCC) and the posterior thalamic radiation (PTR) as shown in Fig 1-3 . Kurtosis metrics (MK, AK, RK) show negative correlations with MI. Conversely, NAA has negative correlations with diffusivity metrics and positive correlations with kurtosis metrics in several WM regions. However, these correlations are not strong (0.3 < abs(r) < 0.45). In addition, we observed weak correlations among FA, kFA, NAA and MI.Conclusion
For DTI metrics, the observed positive correlations with MI and negative correlations with NAA in several WM regions in HIV+ individuals indicate an increased diffusivity in these brain regions. These findings are complimented with increased MI and reduced NAA levels. These findings are suggestive of neuronal damage and increased gliosis in which microglia proliferate to combat HIV induced inflammation.Acknowledgements
Funding from NIH grant, R01 NS094043.References
1. O’Connor E, et al. Reliability of White Matter Microstructural Changes in HIV Infection: Meta-analysis and Confirmation. AJNR Am J Neuroradiol;2017;38(8):1510-1519.
2. Jensen JH, et al. Diffusional kurtosis imaging: the quantification of non-Gaussian water diffusion by means of magnetic resonance imaging. Magn Reson Med 2005;53(6):1432-1440.
3. Garyfallidis E, et al. DIPY, a library for the analysis of diffusion MRI data. Frontiers in Neuroinformatics;2014;8(8).
4. Maudsley AA, et al. Comprehensive processing, display and analysis for in vivo MR spectroscopic imaging. NMR in biomedicine. 2006;19(4):492-503.
5. Maudsley AA, et al. Mapping of brain metabolite distributions by volumetric proton MR spectroscopic imaging (MRSI). Magnetic resonance in medicine: official journal of the Society of Magnetic Resonance in Medicine / Society of Magnetic Resonance in Medicine. 2009;61(3):548-559.
Figures