0915
Neurocognitive and psychiatric features among primary Sjögren’s syndrome patients: from clinical outcomes to brain MRI1Département de médecine interne et maladies multi-organiques, Hôpital Saint Eloi, CHRU Montpellier, Montpellier, France, 2Médecine interne, CHU de Nîmes, Nîmes, France, 3Faculté de médecine, Université de Montpellier, Montpellier, France, 4Advanced Clinical Imaging Technology, Siemens Healthcare AG, Lausanne, Switzerland, 5Department of Radiology, Lausanne University Hospital and University of Lausanne, Lausanne, Switzerland, 6LTS 5, École Polytechnique Fédérale de Lausanne (EPFL), Lausanne, Switzerland, 7Centre Mémoire de Ressources et de Recherche, Hôpital Gui De Chauliac, CHRU Montpellier, Montpellier, France, 8IRMB, INSERM, CHU Montpellier, Montpellier, France, 9Département d’imagerie médicale, Hôpital Gui de Chauliac, CHRU Montpellier, Montpellier, France, 10Institut d'Imagerie Fonctionnelle Humaine (I2FH), Hôpital Gui de Chauliac, Centre Hospitalier Régional Universitaire de Montpellier, Montpellier, France, 11Laboratoire Charles Coulomb, CNRS UMR 5221, Université de Montpellier, Montpellier, France, 12Laboratoire de Biochimie-Protéomique Clinique - IRMB - CCBHM - Inserm U1183, CHU Montpellier, Hôpital St-Eloi - Université Montpellier, Montpellier, France
Synopsis
To date, neuropsychiatric profiles in Sjögren’s syndrome patients are not explained by the immunological profile or clinical symptoms. Consequently, there is a lack of biomarkers potentially characterizing such profiles for this rare autoimmune disease. Our goal was to investigate the potential of MRI-based features to objectively explain fatigue, depression and cognitive complaints in twenty-nine patients with primary Sjögren’s syndrome. Specifically, we explored features from automated brain morphometry and brain lesion segmentation as potential imaging biomarkers. Z-score differences in certain brain structures (thalamus, corpus callosum, ventricles, and insula) were found, suggesting an association between MRI-based biomarkers and patient’s neuropsychiatric profiles.
Introduction
Sjögren’s syndrome (SS) is a rare autoimmune disease which leads to sicca syndrome. Although the severity of the disease is characterized by an increased risk of lymphoma occurrence, patients are mainly complaining of cognitive impairments, anxiety, depression symptoms, fatigue, and generally a bad quality of life1,2. These features are poorly correlated with classical and objective measurement scales of the disease, such as EULAR Sjögren’s Syndrome Disease Activity Index (ESSDAI), but are rather correlated with EULAR Sjögren’s Syndrome Patient Related Index (ESSPRI), including pain and fatigue scales3. This work studies the relation between neuropsychological tests and MR-based quantitative measures, such as morphometry or spatially differentiated white matter hyperintense lesion (WMHL) load, in primary SS patients with cognitive impairments.Material and Methods
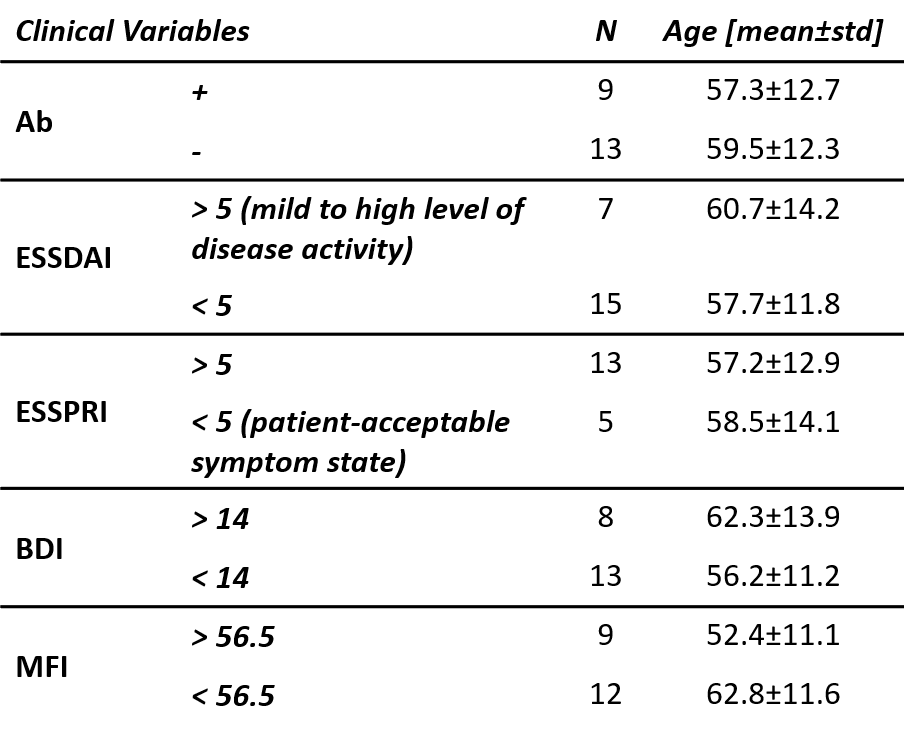
Twenty-nine patients (27 woman, median age = 57 years and standard deviation = 11.5; all with a bachelor’s level of education) diagnosed with primary Sjögren’s syndrome (pSS, according to EULAR/ACR criteria) presenting cognitive complaints and followed-up in Montpellier University Hospital between November 2016 and January 2019, were included in this retrospective study approved by the Institutional Review Board (2018_IRB-MTP_06-08). 47% of enrolled subjects presented symptoms different from skin or joint involvement. Disease activity was assessed by ESSDAI and ESSPRI. In order to explore cognitive complaints, they underwent cognitive and neuropsychological tests, including: Beck Depression Index (BDI)4 and Multidimensional Fatigue Inventory (MFI)5. Additional neuropsychological tests were performed to assess their neuro-cognitive profiles. All patients were scanned at 3T (MAGNETOM Skyra, Siemens Healthcare, Erlangen, Germany) using a 32-channel head coil. Whole-brain 3D T1- and T2-weighted imaging was achieved with MP-RAGE (resolution=1x1x1.2mm3, FOV=256x240mm2, TI=900ms, TR=2300ms, FA=9°, TA=5:12min) and FLAIR (interpolated resolution=0.9x0.9x0.9mm3, TR=5000ms, TE=384ms, TI=1800ms, FA=120°) sequences. Brain atrophy and WMHL load were evaluated by both visual (via Scheltens and Fazekas scales) and automated assessments. Brain volumetry was obtained through the MorphoBox prototype6 which includes z-score computation that results from the comparison of each brain volume to an age- and gender-matched population. WMHL volume was computed using LemanPV prototype7–10, and the spatial distribution of WMHL was obtained according to the brain parcellation from MorphoBox. The population was stratified according to five different clinical variables: BDI (with a threshold of 14), ESSDAI3 (threshold of 4), ESSPRI (threshold of 5), MFI (the population median score 56.5 was used to define low and high fatigue groups), and autoantibodies positivity (Ab, SSa or/and SSb autoantibodies ). Demographics can be found in Table 1. For each clinical variable, Student’s t- and Wilcoxon tests were performed between the two groups on each MorphoBox brain structure z-score and regional/global WHML volume, respectively. P-values were then adjusted for multiple comparisons using False Discovery Rate (FDR) method within each clinical variable. All the statistical analyses were performed using the R-software (v3.5.3).Results
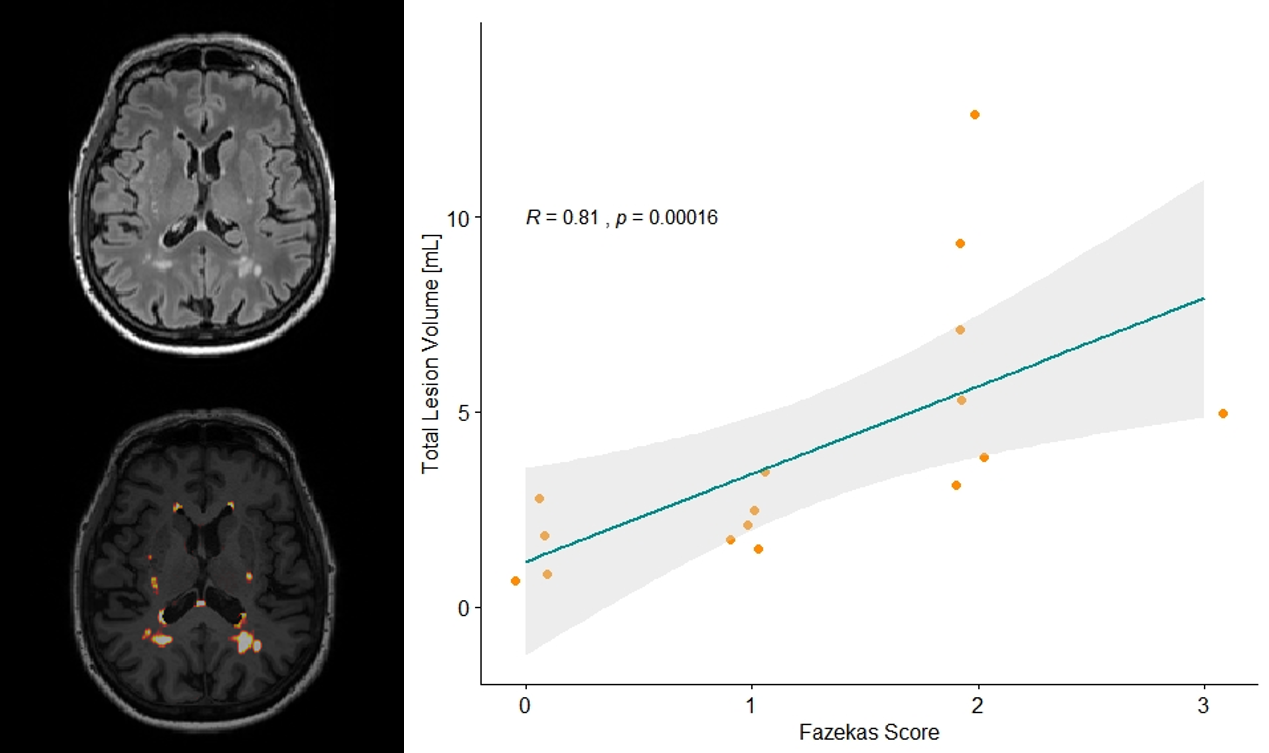
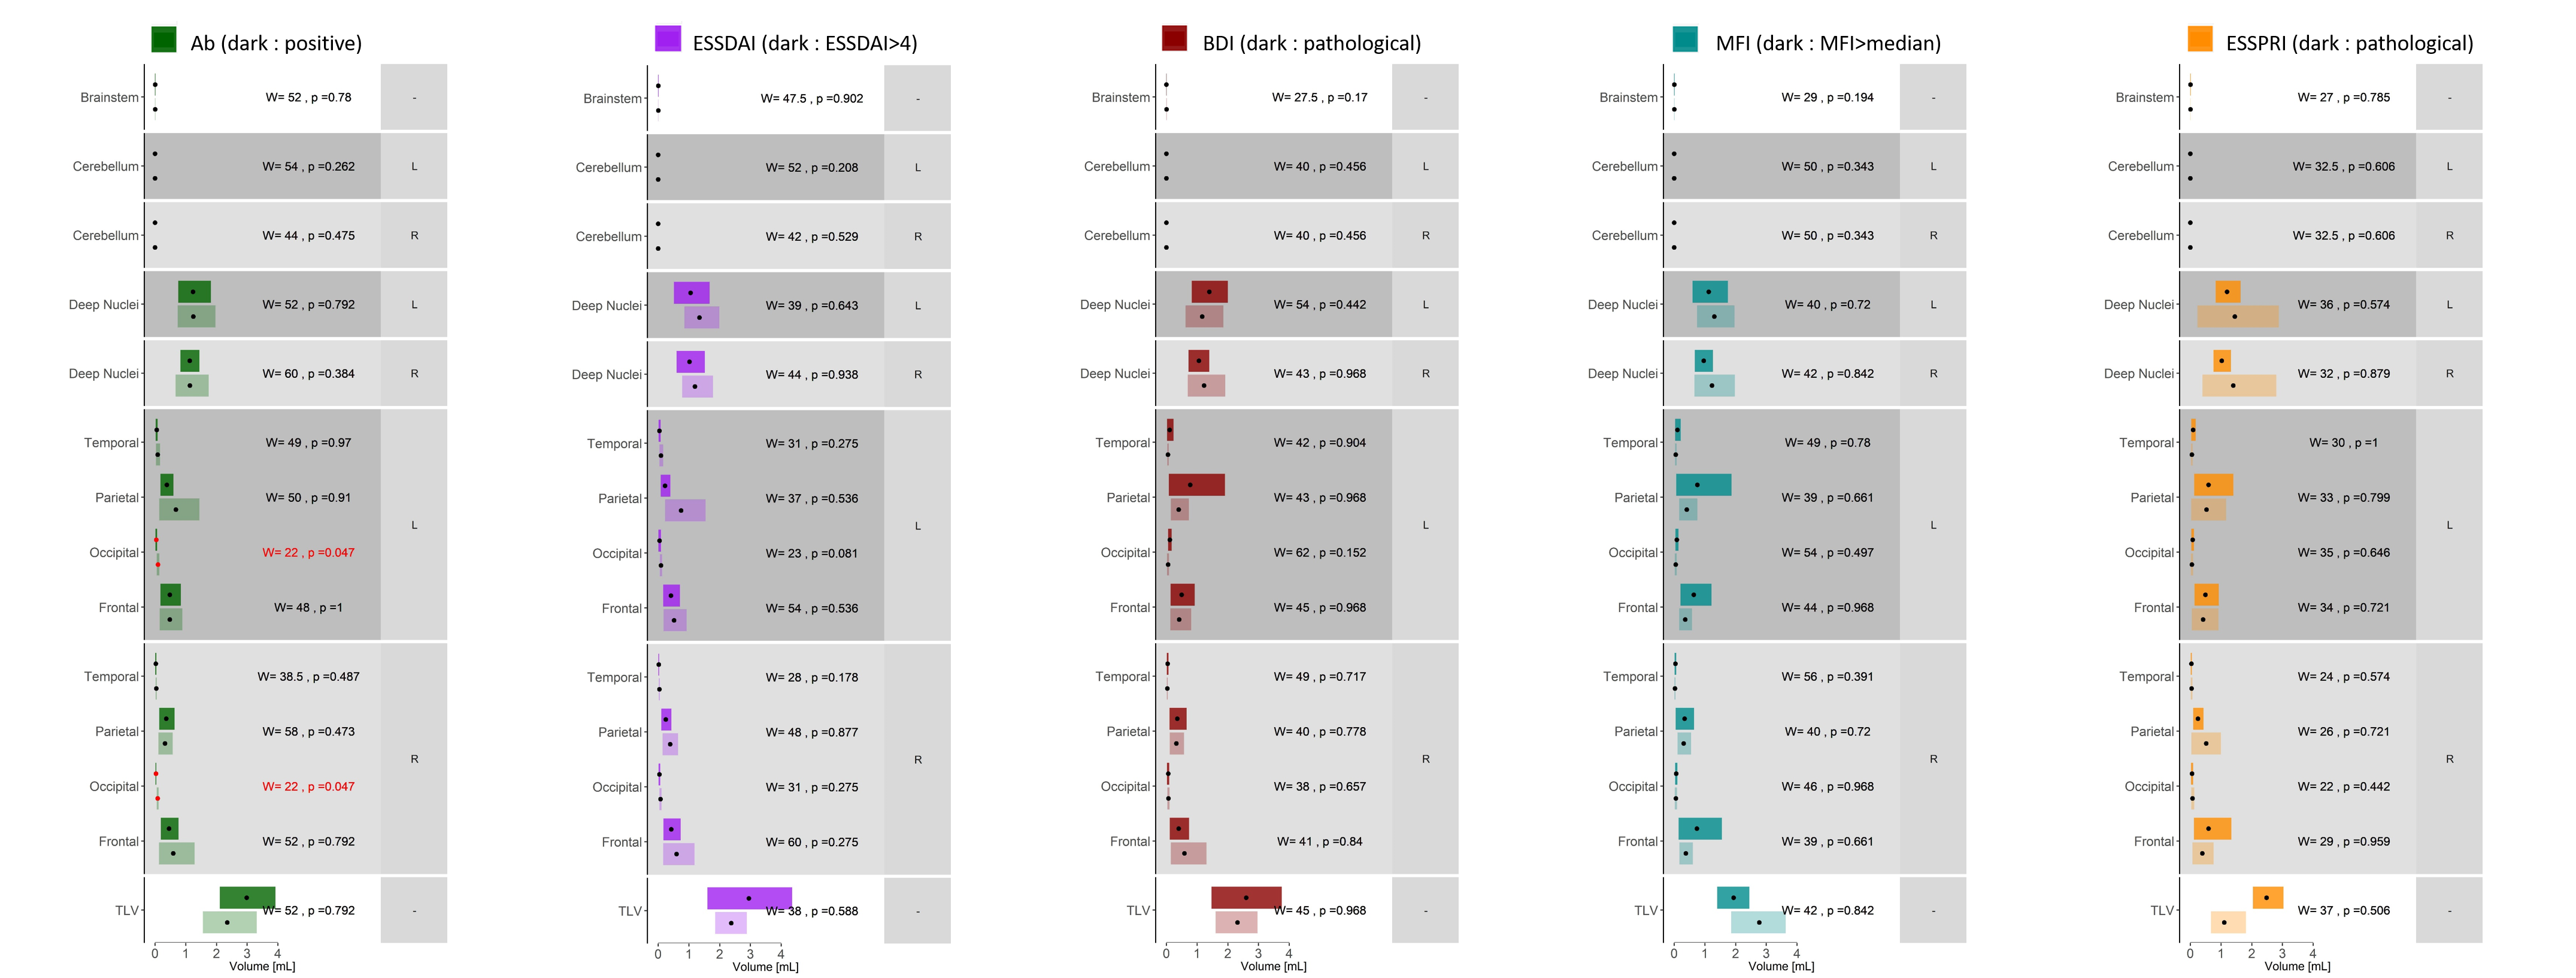
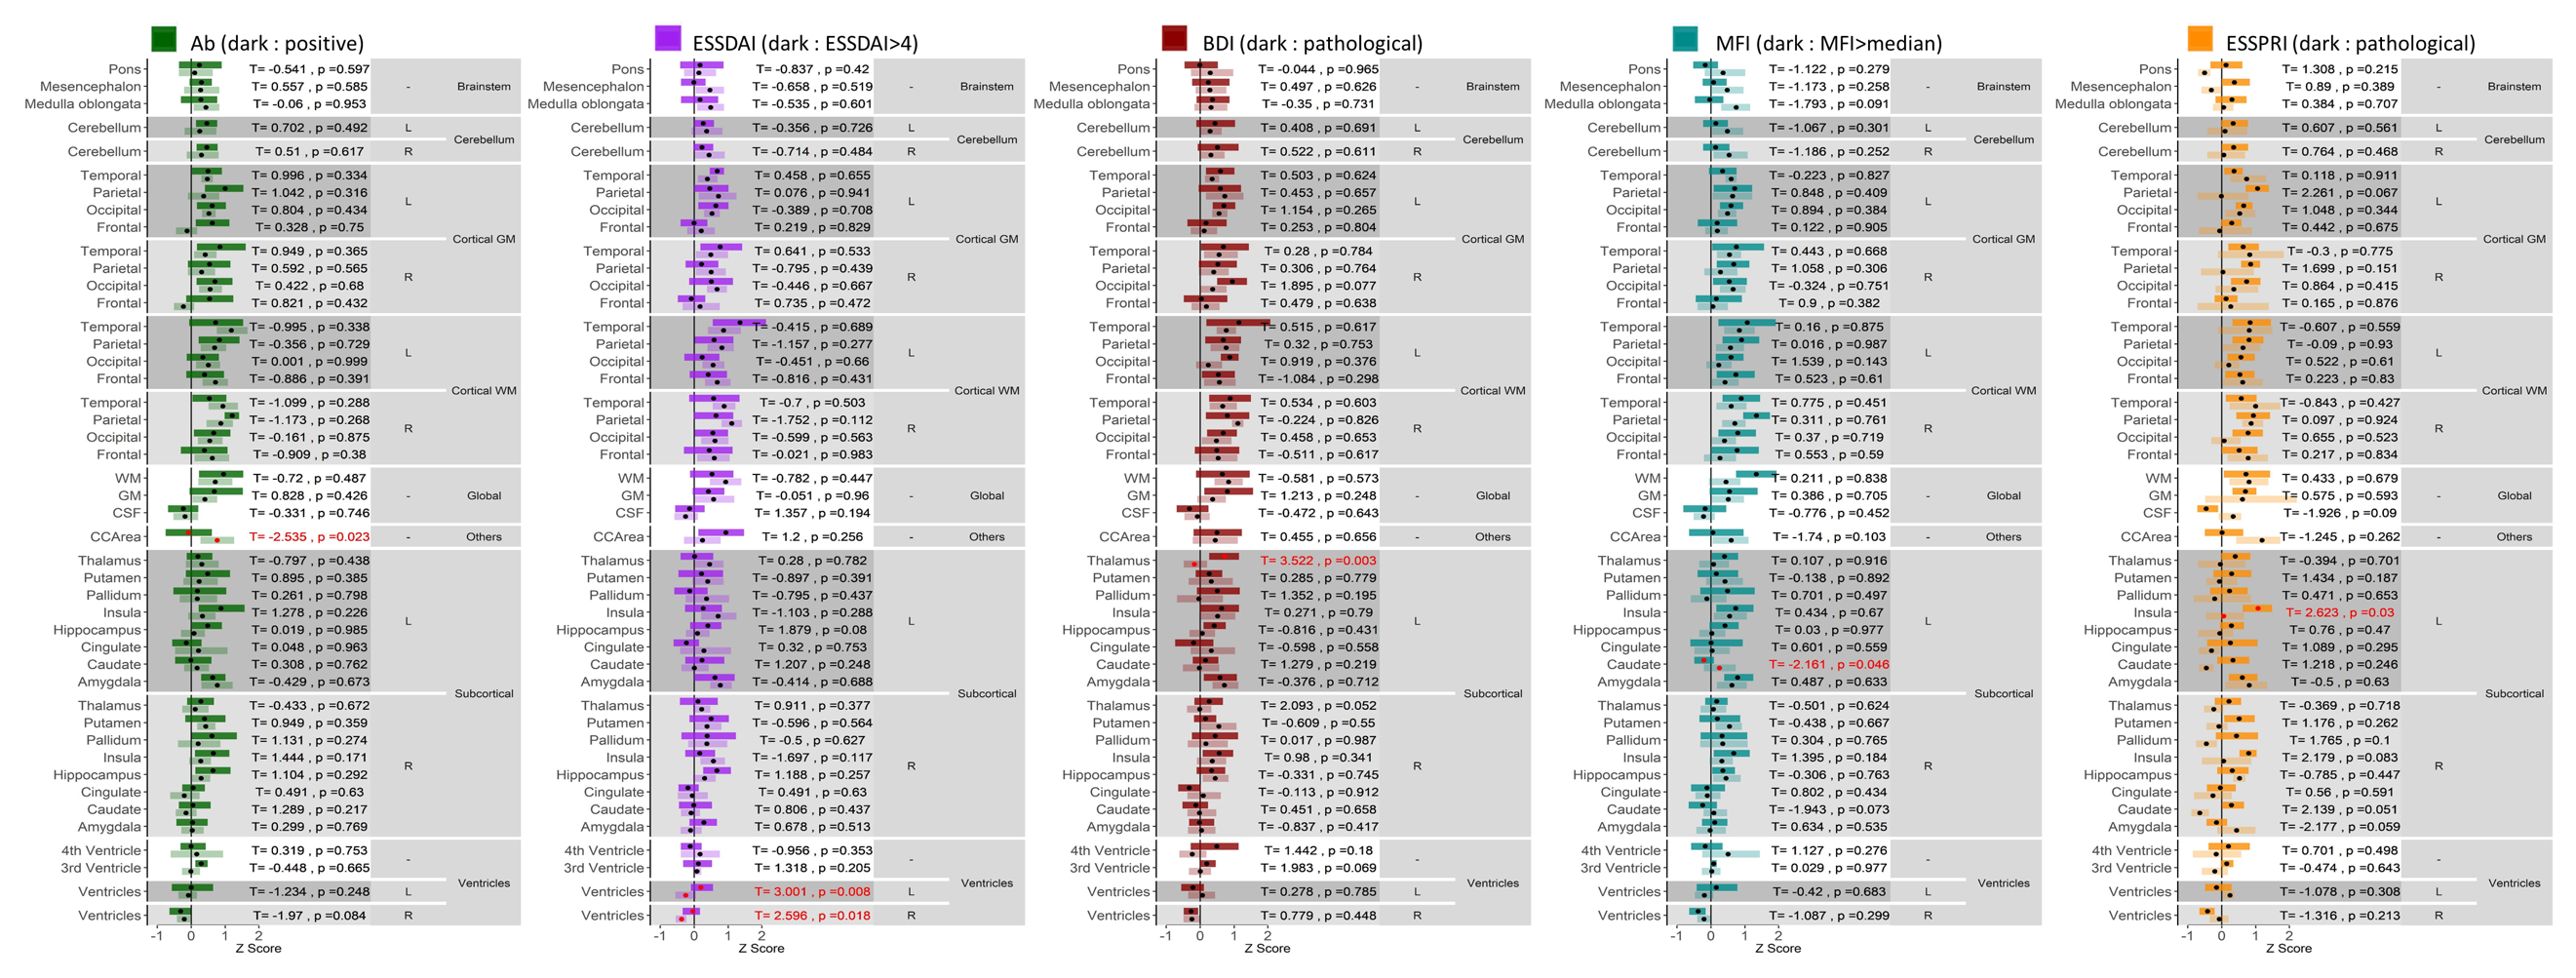
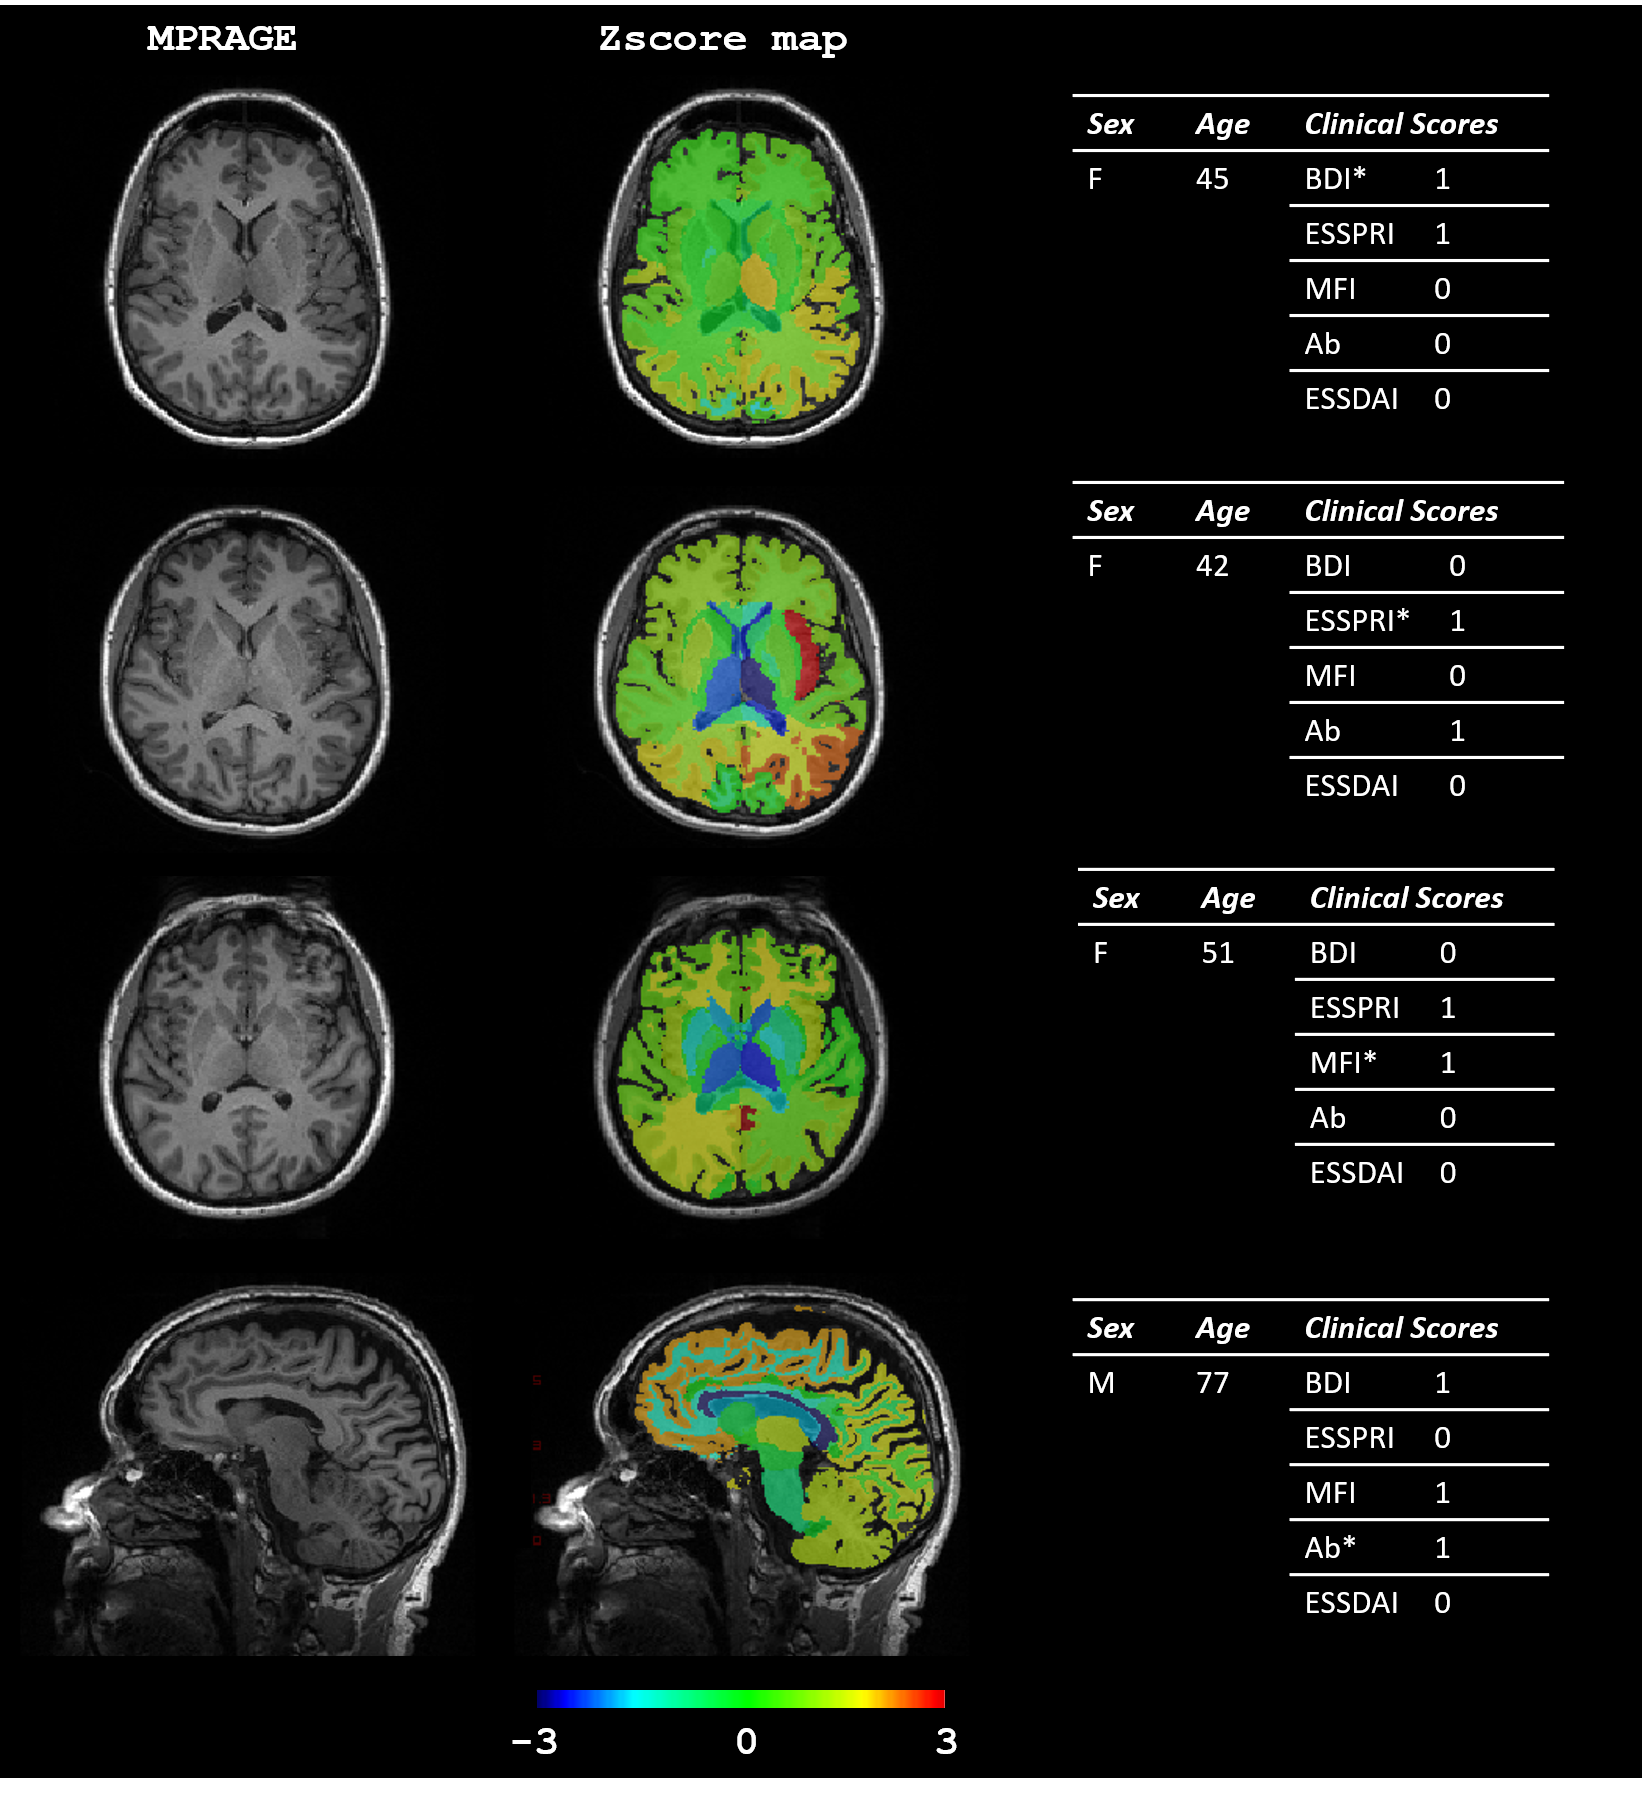
Although all patients complained of cognitive disorders, tests could not document any abnormal profile in 10 patients. However, 20 of patients showed a dysexecutive syndrome, four had a defect in instrumental abilities, and two had cognitive impairments. Radiologist visual assessment revealed Fazekas score > 0 in 20 patients and Scheltens scale of 1 for 6 patients. Visual (Fazekas scale) and automated assessments for lesion load were highly correlated (Spearman ρ=0.81, p<0.001, see Figure 1). Overall, no significant discrimination was found for any clinical variable between the two groups using regional and global WHML volume (see Figure 2), except in occipital lobe for Ab score (p=0.047) despite a low WHML volume (<0.1ml). However, as shown on Figure 3, we found significant differences in Z-scores for: left thalamus when population was stratified according to BDI (larger thalamus for larger BDI, p=0.003); mid-sagittal corpus callosum area for Ab (smaller area for positive patients, p=0.023 ); ventricles for ESSDAI (larger ventricles for larger ESSDAI, p<0.05); left caudate for MFI (smaller caudate for larger MFI, p=0.046), and left insula for ESSPRI (larger insula for larger ESSPRI, p=0.03). Illustrative examples of Z-scores maps that reflect these findings are shown in Figure 4. No significant results were found after FDR correction for multiple comparisons.Discussion and Conclusion
Our work showed that most patients with pSS and cognitive complaints showed a dysexecutive syndrome. Given that the immunological profile or clinical symptoms did not seem to correlate with neuropsychiatric profiles, brain MRIs with volume analyses and WMHL analyses could help understanding the pathophysiology of the neuropsychiatric symptoms. As previously observed in patients with Parkinson’s disease, a higher volume of caudate nucleus seems to be correlated to a higher level of fatigue, and a higher volume of thalamus is observed among depressed SS patients11,12. The lack of significant results after correction for multiple comparisons is likely due to the small sample size, and further investigations should be made. However, our findings suggest that MRI could provide useful information to better characterize SS patient complaints. Furthermore, MRI biomarkers could contribute to explain the potential pathophysiological pathways linking immunological aspects of the diseases and neurological aspects.Acknowledgements
No acknowledgement found.References
1. Miyamoto ST, Valim V, Fisher BA. Health-related quality of life and costs in Sjögren’s syndrome. Rheumatology. February 2019. doi:10.1093/rheumatology/key370
2. Hackett KL, Davies K, Tarn J, et al. Pain and depression are associated with both physical and mental fatigue independently of comorbidities and medications in primary Sjögren’s syndrome. RMD Open. 2019;5(1):e000885. doi:10.1136/rmdopen-2018-000885
3. Seror R, Theander E, Brun JG, et al. Validation of EULAR primary Sjögren's syndrome disease activity (ESSDAI) and patient indexes (ESSPRI). Ann Rheum Dis. 2015;74(5):859 LP - 866. doi:10.1136/annrheumdis-2013-204615
4. Beck AT, Ward CH, Mendelson M, Mock J, Erbaugh J. An Inventory for Measuring Depression. Arch Gen Psychiatry. 1961;4(6):561-571. doi:10.1001/archpsyc.1961.01710120031004
5. Smets EMA, Garssen B, Bonke B, De Haes JCJM. The multidimensional Fatigue Inventory (MFI) psychometric qualities of an instrument to assess fatigue. J Psychosom Res. 1995;39(3):315-325. doi:https://doi.org/10.1016/0022-3999(94)00125-O
6. Schmitter D, Roche A, Marechal B, et al. An evaluation of volume-based morphometry for prediction of mild cognitive impairment and Alzheimer’s disease. NeuroImage Clin. 2015;7:7-17. doi:10.1016/j.nicl.2014.11.001
7. Fartaria MJ, Bonnier G, Roche A, et al. Automated detection of white matter and cortical lesions in early stages of multiple sclerosis. J Magn Reson Imaging. 2016;43(6):1445-1454. doi:10.1002/jmri.25095
8. Dunet V, Fartaria MJ, Deverdun J, et al. Episodic memory decline in Parkinson’ s disease: relation with white matter hyperintense lesions and influence of quantification method. Brain Imaging Behav. 2019;13(3):810-818. doi:10.1007/s11682-018-9909-x
9. Fartaria MJ, Roche A, Meuli R, Granziera C, Kober T, Bach Cuadra M. Segmentation of Cortical and Subcortical Multiple Sclerosis Lesions Based on Constrained Partial Volume Modeling BT - Medical Image Computing and Computer Assisted Intervention − MICCAI 2017. In: Descoteaux M, Maier-Hein L, Franz A, Jannin P, Collins DL, Duchesne S, eds. Cham: Springer International Publishing; 2017:142-149.
10. Fartaria MJ, Todea A, Kober T, et al. Partial volume-aware assessment of multiple sclerosis lesions. NeuroImage Clin. 2018;18:245-253. doi:10.1016/j.nicl.2018.01.011
11. Cardoso EF, Maia FM, Fregni F, et al. Depression in Parkinson’s disease: Convergence from voxel-based morphometry and functional magnetic resonance imaging in the limbic thalamus. Neuroimage. 2009;47(2):467-472. doi:https://doi.org/10.1016/j.neuroimage.2009.04.059
12. Kluger BM, Zhao Q, Tanner JJ, et al. Structural brain correlates of fatigue in older adults with and without Parkinson’s disease. NeuroImage Clin. 2019;22:101730. doi:10.1016/j.nicl.2019.101730
Figures