0914
Metabolic and microstructural MPSII brain alteration revealed by multiparametric MR imaging and spectroscopy – a combined 3T and 7T study1Department of Medicine III, Medical University of Vienna, Vienna, Austria, 2High Field MR Centre, Department of Biomedical Imaging and Image-guided Therapy, Medical University of Vienna, Vienna, Austria, 3Clinical Division for Endocrinology and Metabolism, Department of Medicine III, Medical University of Vienna, Vienna, Austria, 4Athinoula A. Martinos Center for Biomedical Imaging, Boston, MA, United States
Synopsis
While glycosaminoglycan deposition in Mucopolysaccharidosis type II, a rare X-linked lysosomal storage disorder, unquestionably alters the brain, metabolic and microstructural MR markers have not been yet established. Thus, we utilized 3T diffusion MRI and fine-tuned semi-LASER MR spectroscopy as well as in-house developed 7T 3D-FID-MRS imaging to examine differences between seven MPSII and eight age-matched healthy males. Analyses revealed profound deficit in the supratentorial white matter consistent with de/dysmyelination on both diffusion and spectroscopy as well as decrease of neuronal population or hypometabolism measured as glutamate deficit in the posterior cingulate cortex, which is a critical hub of neurocognitive networks.
Introduction
Alteration of iduronate-2-sulfatase in Mucopolysaccharidosis type II (MPSII), which is a rare X-linked lysosomal storage disorder (LSD), leads to abnormal accumulation of glycosaminoglycans in the brain.1 Intravenous enzyme replacement therapy currently provides the only treatment and does not properly address progressive neuropsychological deficits due to the obstacle of the blood-brain-barrier. An emergent need for novel brain-directed therapies further accelerates the necessity to establish sensitive quantitative measures of brain deficits in MPS II.2 While MPSII brains indeed exhibit typical morphological brain abnormalities (e.g., atrophy, white-matter (WM) hyperintensities, and enlarged Robin-Virchow spaces), underlying in vivo deficits are not fully understood. To date, sparse number of MR studies described volumetric2 and metabolic deficits in murine models1 and patients,3 however, quantitative MR markers of metabolic and microstructural brain alterations still have to be established in MPSII. Thus, we utilized diffusion MRI (dMRI) in combination with 3T single-voxel MR sLASER spectroscopy (SVS) and 7T 3D MRS imaging (3D-MRSI) to examine differences between MPSII and healthy males.Methods
Seven MPSII patients (23 ±10 years) along with 8 aged-matched male healthy controls (HC, 25 ±7 years) signed an IRB-approved informed consent. T1-MPRAGE with TR/TE/TI = 2400/2.24/1060ms with isotropic voxel 0.8mm3, together with two dMRI datasets with reversed phase encoding and voxel size of 2mm3 with TR/TE = 2720/64 ms, with 7 b0, 48 b=1000 s/mm2, and 45 b=2000 s/mm2 scans and single-voxel semi-LASERlocalization sequence (64 NEX, TR/TE=5000/23ms, 22mm3 )4 with FASTMAP shimming for correcting in-homogeneities and voxel placed to Posterior Cingulate Cortex (PCC) were acquired at 3T Siemens Prisma using standard 20-channel head-and-neck coil. 3D-MRSI data were obtained at 7T Siemens Magnetom scanner using standard 32-channel head coil with FID-MRSI sequence with 3D k-space ellipsoid encoding (CONCEPT) with 64x64x39 matrix and 3.4mm3 isotropic voxel. FOV was placed supratentorially to cover frontal, parietal and cingulate areas. Rapid WET water suppression and short acquisition window allowed a short TR of 500 ms. Off-line MRSI data post-processing and spectra reconstruction were described previously.5,6 Spectra were quantified in the LCmodel and 14 metabolic maps were created. SVS data were analyzed in MRSpa software and were quantified using LCmodel. dMRI data were corrected for eddy current, motion and susceptibility artifacts and were fitted with tensor model in FSL7 to extract fractional anisotropy (FA), mean (MD), axial (AD) and radial diffusivity (RD). T1-MPRAGE scans were processed with Freesurfer v5.3.0-HCP8 to extract ROIs from frontal, parietal, cingulate, dorsal cingulate (i.e., isthmus cinguli + PCC) cortical regions and corresponding WM areas as well as corpus callosum (CC). T1-weighted images were registered to dMRI and metabolic 3D-MRSI maps using bbregister.8 Values extracted from metabolic and dMRI maps as well as metabolic SVS concentrations from PCC were compared between-groups using non-parametric Wilcoxon Rank-Sum test. Results were corrected for multiple comparison error using 10% false-discovery-rate (FDR). Two patients were not able to undergo 7T scans due to presence of temporary knee implants, thus, the 7T 3D-MRSI analysis was considered exploratory and was not corrected for multiple comparisons.Results
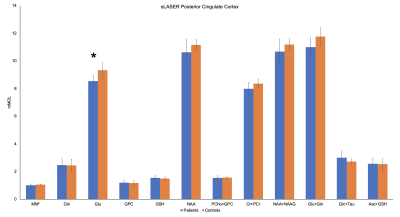
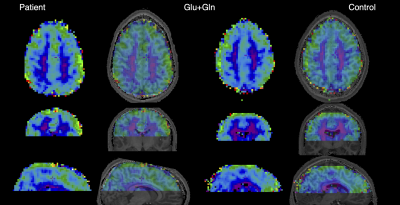
Analysis of twelve most abundant brain metabolites revealed significantly lower glutamate (Glu) in the PCC (9%, pFDR=0.008) in patients compared to HC (Fig.1,2) and was corroborated by 10% decrease of Glu in the dorsal cingulate cortex in patients found on the 7T-3D-MRSI maps (puncorrected=0.03). Exploratory MRSI analysis of the whole WM also showed 11% increase of glycerophosphorylcholine (GPC, puncorrected=0.04) in patients in contrast to healthy inviduals (Fig.3). dMRI analysis detected significant decrease of FA (21%, pFDR=0.027) as well as increase of RD (20%, pFDR=0.027) and MD (13%, pFDR=0.009) in the whole WM in patients relative to HC (Fig. 4). Lobar analysis showed significant changes of FA, RD and MD in parietal, frontal, cingulate and dorsal cingulate WM (pFDR<0.05), but not in the CC. Analysis did not detect any significant dMRI alterations in any cortical areas.Discussion
Alteration of dMRI parameters points to the de/dysmyelination in MPSII patients that was consistently reported in other MPS subtypes (e.g., severe MPS type I, MPSI),9,10 but not confirmed in MPSII in vivo. Myelin deficiency is further corroborated by alterations in GPC concentration, which might be potentially caused by accelerated myelin turn-over.11 While analysis depicted changes in the whole WM, it did not delineate any significant changes in the CC, which were consistently reported in MPSI9,10 and thus suggest distinctions between MPS types. Pathology in WM microstructure may ultimately lead to a decrease in WM volumes that were reported previously. Metabolic Glu deficit refers to the neuronal loss or hypometabolism in the PCC,11 which is considered a critical hub of the default mode network as well as other circuits involved in the normal cognitive functioning and in/attention.12Conclusion
Our results confirmed metabolic and microstructural alterations of WM and detected abnormality of key neuro-metabolite in the functionally highly important cortical brain area in MPSII patients. Thus, 3D-FID-MRSI might provide an optimal approach in disorders with poorly understood metabolic brain alteration. Overall, study highlighted importance of multiparametric MR data analysis in LSDs, which share some common features with neurological disorders such as Alzheimer and Parkinson disease.Acknowledgements
AS was supported by the European Union’s Horizon 2020 research and innovation program under the Marie Skłodowska-Curie grant agreement No 794986. PB was partially supported by a NARSAD Young Investigator Grant from the Brain and Behavior Research Foundation (Grant No. 27238) and by the European Union’s Horizon 2020 research and innovation program under the Marie Skłodowska-Curie grant agreement No 846793. Research was partially funded by National MPS Society.References
1. Tkac, I. et al. In ISMRM; 2018. 2. Yund, B. et al. Mol. Genet. Metab.2015, 114(2), 170–177. 3. Davison, J. E. et al. J. Inherit. Metab. Dis.2010, 33(SUPPL. 3), 395–399. 4. Deelchand, D. K. et al. Magn. Reson. Med.2015, 73(5), 1718–1725. 5. Hingerl, L. et al. Invest. Radiol.2019, in press. 6 . Hingerl, L. et al. In MRS Workshop Utrecht; Utrecht, 2018. 7. Jenkinson, M. et al. Neuroimage 2012, 62(2), 782–790. 8. Fischl, B. et al. Neuron 2002,33(3), 341–355. 9. Svatkova, A. et al. In Organization for Human Brain Mapping; Geneva, 2016. 10. Shapiro, E. et al. Mol. Genet. Metab. 2012, 107(1–2), 116–121. 11. Oz, G. In Magnetic Resonance Spectroscopy of Degenerative Brain Diseases.; Cham: Springer International Publishing;, 2016; pp 1–11. 12. Van Erven, B. et al. Sci. Rep.2017,7(1), 1–13.
Figures


Figure 2. Mean concentrations (mM) of reliably quantified metabolites (CRLB<20%) in the posterior cingulate cortex. Significant differences in glutamate between patients and controls were detected (asterisk). Macromolecules concentration is reported in arbitrary units. Error bars represent ± SD.

