0913
Vulnerable brain network in a mouse model of Huntington’s disease revealed by gluCEST, magnetization transfer and anatomic imaging.1Molecular Imaging Research Center (MIRCen), Commissariat à l'Energie Atomique et aux Energies Alternatives (CEA), Fontenay-aux-Roses, France, 2UMR 9199, Neurodegenerative Diseases Laboratory, Centre National de la Recherche Scientifique (CNRS), Université Paris-Sud, Université Paris-Saclay, Fontenay-aux-Roses, France, 3Inserm UMR-S U1237, Normandie University, UNICAEN, GIP Cyceron, Caen, France, 4Inserm U1077 Neuropsychologie et Imagerie de la mémoire Humaine, Normandie University, UNICAEN, EPHE, CHU de Caen, Caen, France, 5Inserm UMR-S U1127, Institut du Cerveau et de la Moelle épinière (ICM), Sorbonne Université, Paris, France, 6Département de génétique, Groupe Hospitalier Pitié-Salpêtrière, APHP, Paris, France, 7Inserm U1216, Grenoble Institut des Neurosciences (GIN), Univ. Grenoble Alpes, Grenoble, France
Synopsis
Huntington’s disease (HD) is an inherited neurodegenerative disease characterized by cognitive, motor and psychiatric symptoms. Despite tremendous efforts made during past years, there is a need for more predictive and functional biomarkers of disease pathogenesis and progression. In the present study, we developed a longitudinal and multimodal imaging protocol to elucidate HD pathogenesis in a mouse model of HD and to evaluate the potential of different biomarkers. Our approach combining volume, gluCEST and magnetization transfer imaging and automated brain segmentation revealed a brain network particularly vulnerable in this model.
Introduction
Huntington’s disease (HD) is an inherited neurodegenerative disease characterized by cognitive, motor and psychiatric symptoms1. Atrophy of the striatum as measured by MRI is one of the best biomarkers of disease progression in HD gene carriers2. However, it provides very few information about HD pathogenesis as it probably reflects long-term consequences of subtle biological modifications that onset several years before atrophy occurrence. Thus, there is a need to find more predictive, functional and earlier biomarkers to better understand disease pathogenesis and to monitor its progression.In a previous work, we demonstrated the interest of gluCEST imaging3 in the context of HD. In particular, we highlighted that corpus callosum (CC) was strongly affected in a slowly progressive mouse model of HD4, confirming the pivotal role of this structure in HD5 and, more generally, in neurodegenerative diseases6-7. In the present study, we developed a longitudinal and multimodal imaging protocol to elucidate HD pathogenesis in a mouse model of HD and to evaluate the potential of different biomarkers.
Methods
Mouse model: Knock-in mice expressing mouse/human exon 1 containing 140 CAG repeats inserted in the huntingtin (htt) gene were used8. Heterozygous mice for the htt gene (Ki140, n=11) were compared to their relative age-matched littermates (WT, n=12).MRI protocol: Animals were scanned longitudinally (10, 20, 34 and 48 weeks of age) on a horizontal 11.7T Bruker magnet using a Cryoprobe. The MRI protocol was composed by an anatomical image (TSE sequence, 48 slices, 0.25 x 0.25 mm², 0.5 mm slice thickness), a gluCEST image (Magnetization Transfer Ratio (MTRasym) at ±3 ppm calculated from a Zspectrum acquired between -5 and 5 ppm, B1=5 µT, Tsat=1 s, WASSR correction for B0 inhomogeneity9) and a magnetization transfer (MT) image (MTRasym at ±16 ppm, B1=10 µT, Tsat=800 ms).
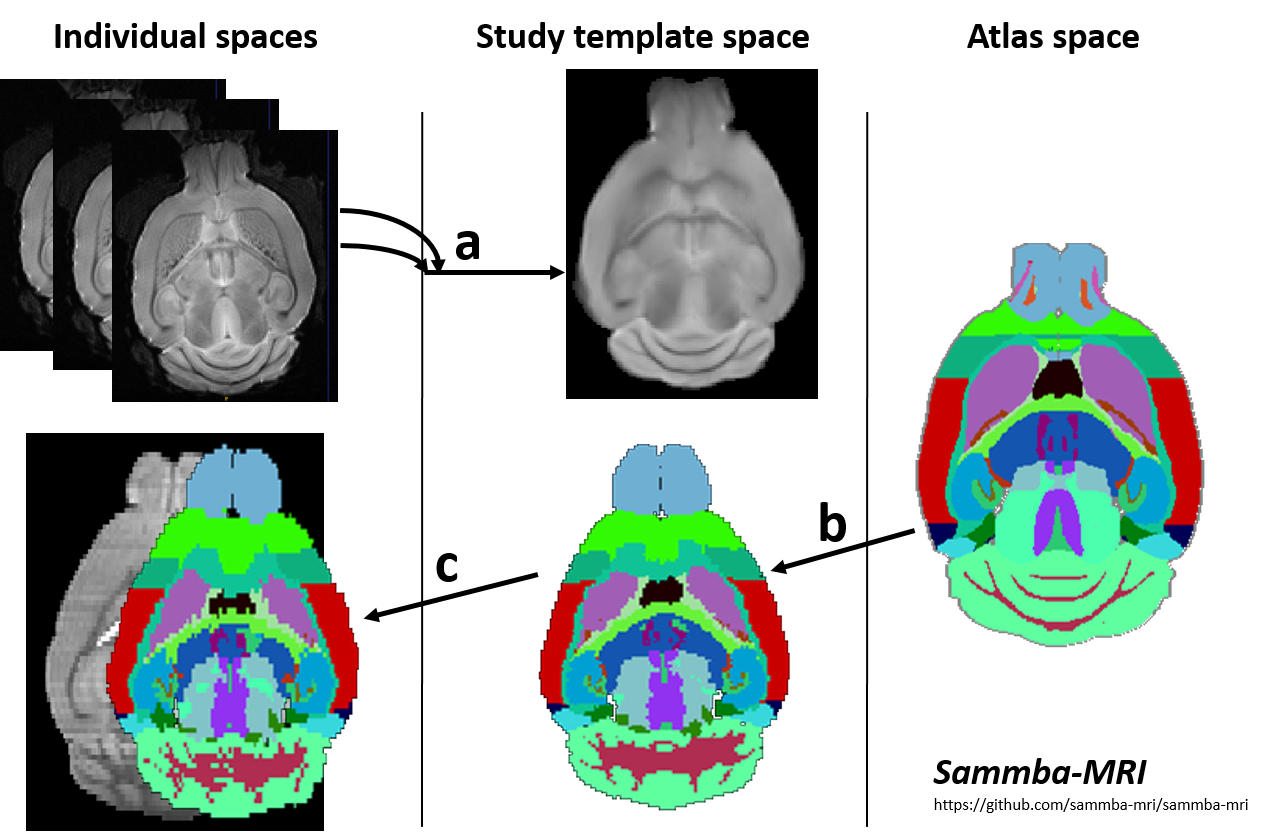
Automated Segmentation: Images were co-registered and automatically segmented using an atlas composed of a high-resolution template and labels (34 regions, Fig.1), based on Allen mouse brain atlas10. The registration pipeline used an in-house python library (Sammba-MRI11, Fig. 1).
Statistical analysis: After Shapiro-Wilk normality test, one-way ANOVA with repeated measures was used for statistical analysis and was followed by Fisher LSD post-hoc test.
Results
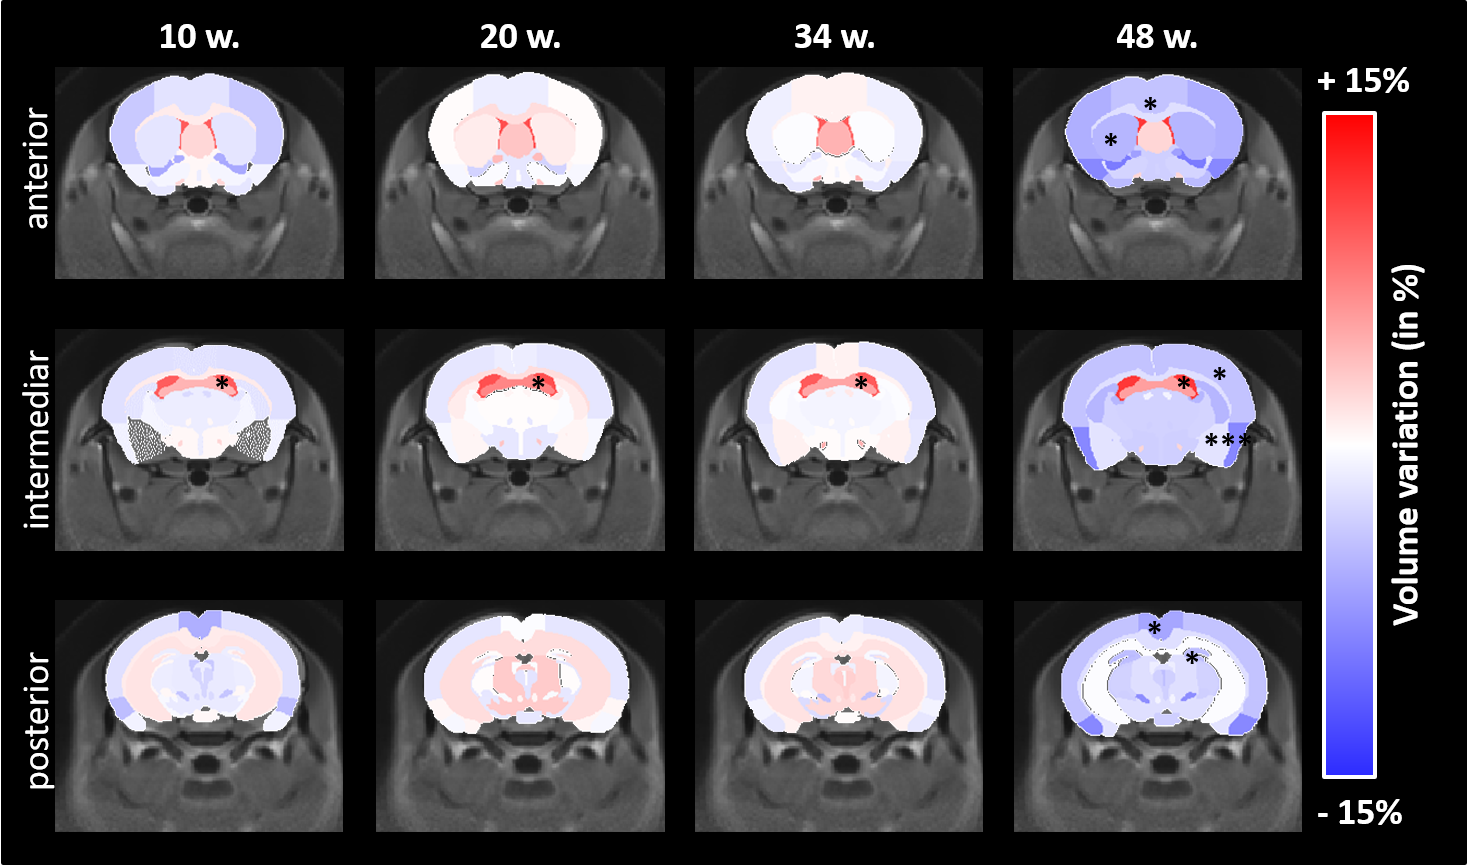
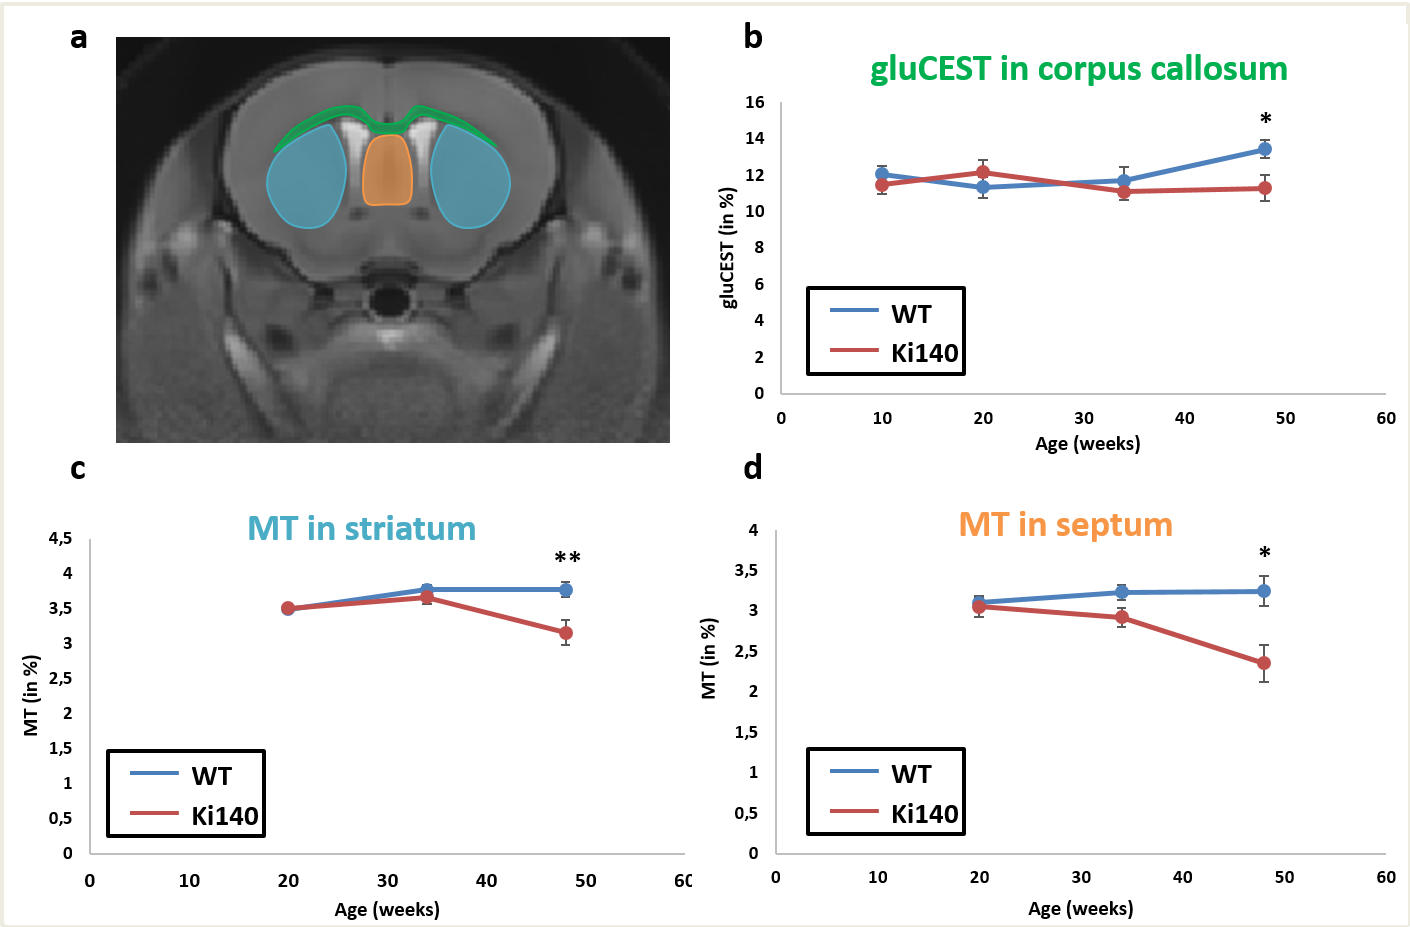
Morphometry: Based on volume measurements, variation maps between WT and Ki140 mice were calculated (Fig.2). Except for lateral ventricles, which were dilated in Ki140 mice as early as 10 weeks, no structure showed any volume variation before 48 weeks. At 48 weeks, Ki140 mice exhibited a global atrophy of the brain (Fig.2, 4th column). Volume variation as compared to WT was significant in the striatum (-4.2%, p<0.05), in the dentate gyrus (-3.7%, p<0.05) and in several cortical regions such as the motor (-3.5%, p<0.05), the piriform (-7.0%, p<0.001) and the retrosplenial cortexes (-5.2%, p<0.05).GluCEST and MT imaging: GluCEST and MT images were acquired on a single slice positioned based on our previous work4 (Fig.3.a). A significant decrease of gluCEST signal was measured in the CC of Ki140 mice at 48 weeks (Fig.3.b, -16%, p<0.05). HD mice also exhibited a significant decrease of MT contrast in the striatum (Fig.3.c, -16%, p<0.01) and in the septum (Fig.3.d, -25%, p<0.05) at 48 weeks.
Discussion and conclusion
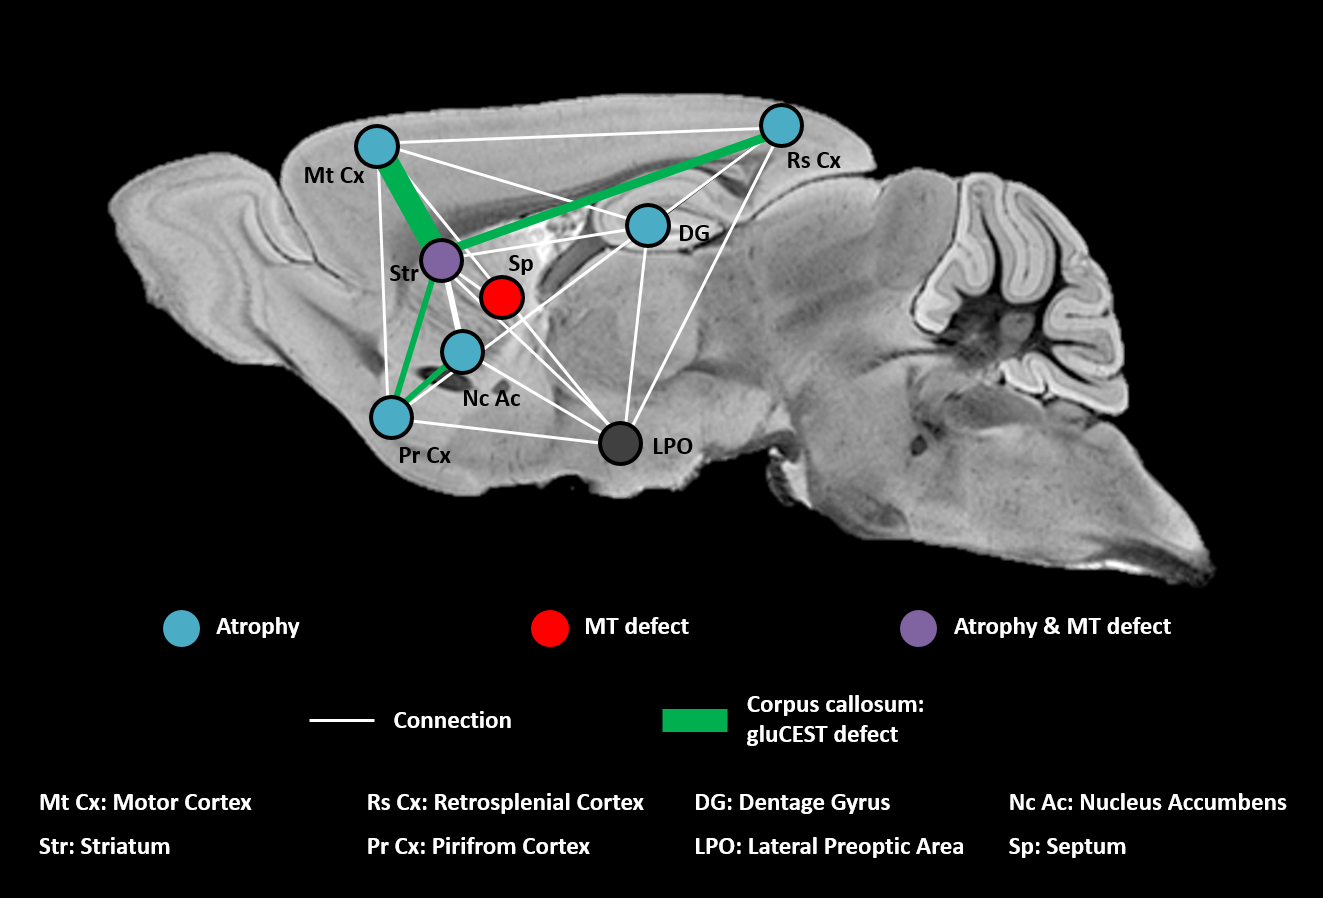
Based on our longitudinal study, we observed only small modifications of MRI parameters until 34 weeks, confirming that Ki140 mouse model is a very progressive and mild model of HD8. Nonetheless, dilatation of lateral ventricles suggested global atrophy of the brain, even at 10 weeks. Interestingly, the 16% decrease of gluCEST contrast measured in the CC at 48 weeks was consistent with our previous results4, confirming the specific alteration of this structure. Concomitantly, we measured significant variations of macromolecular content of tissues using MT imaging in the striatum of HD mice, a region known to be particularly vulnerable in HD12, and in the septum. These results suggest that myelin content could be affected in these regions. It could also reflect neuronal atrophy and/or neurodegeneration at later stage of the disease as suggested by atrophy of several brain structures (Fig.2). In order to investigate a potential propagation of the defects, a future time point will be acquired at 18 months of age.Using data from Allen Connectivity Atlas reference paper13, we figured out that most of affected regions were strongly connected, forming a network vulnerable to HD pathology in our mouse model of HD (Fig. 4). Most interestingly, regions atrophied in Ki140 mice appeared to be mostly cortical, while MT defects were located in striatal regions. Moreover, the cortico-striatal connections, firmly appearing in this network, are reported to communicate via CC14, where we measured decrease of glutamate levels.
We hypothesize that in the Ki140 HD model pathogenesis starts from the striatum, the only region affected in both volumetric MRI and MT, or from the lateral preoptic area, a small region of hypothalamus that seems central in terms of connections with this network. Interestingly, metabolism changes have been reported in the hypothalamus in HD patients15.
This study emphasizes the relevance of our multimodal approach to better understand pathogenesis of the disease and to highlight specific regions early affected in HD mouse models.
Acknowledgements
Project was supported by eRARE ERA-Net (“TreatPolyQ” ANR-17-RAR3-0008-01) and NeurATRIS, (“Investissements d'Avenir”, ANR-11-INBS-0011). The 11.7T scanner was funded by NeurATRIS (“Investissements d'Avenir”, ANR-11-INBS-0011).References
1. Walker, F.O., Huntington's disease. Lancet, 2007. 369(9557): p. 218-28.
2. Tabrizi, S.J. et al., Predictors of phenotypic progression and disease onset in premanifest and early-stage Huntington's disease in the TRACK-HD study: analysis of 36-month observational data. Lancet Neurol., 2013. 12(7): p.637-49.
3. Cai, K. et al. Magnetic resonance imaging of glutamate. Nat. Med., 2012. 18(2): p302-6.
4. Pépin, J. et al. In vivo imaging of brain glutamate defects in a knock-in mouse model of Huntington's disease. Neuroimage, 2016. 139: p53-64.
5. Phillips, O. et al. Tractography of the Corpus Callosum in Huntington’s Disease. PLoS ONE 8(9): e73280.
6. Goldman, J.G. et al. Corpus callosal atrophy and associations with cognitive impairment in Parkinson disease. Neurology, 2017. 88(13): 1265–1272.
7. Walterfang, M. et al. Shape analysis of the corpus callosum in Alzheimer’s disease and frontotemporal lobar degeneration subtypes. J. Alzheimer Dis., 2014. 40(4): 897–906.
8. Menalled, L.B. et al., Time course of early motor and neuropathological anomalies in a knock‐in mouse model of Huntington's disease with 140 CAG repeats. The Journal of Comparative Neurology, 2003. 465: 11–26.
9. Kim, M. et al. Water saturation shift referencing (WASSR) for chemical exchange saturation transfer (CEST) experiments. Magn. Reson. Med., 2009. 61(6):1441-50.
10. Lein, E.S. et al. Genome-wide atlas of gene expression in the adult mouse brain, Nature, 2007. 445: 168-176.
11. Nadkarni, N.A. et al. Digital templates and brain atlas dataset for the mouse lemur primate.Data in Brief, 2018. P1178-1185.
12. André, V.M. et al. Dopamine and glutamate in Huntington's disease: A balancing act. CNS Neurosci.Ther., 2010. 16(3):163-78.
13. Oh, S.W. et al. A mesoscale connectome of the mouse brain. Nature, 2014. 508: 207-214.
14. Shepherd, G.M.G. Corticostriatal connectivity and its role in disease. Nat. Rev. Neurosci., 2013. 4(4): 278–291.
15. Petersén, A. et al. Hypothalamic and Limbic System Changes in Huntington’s Disease. Journal of Huntington’s Disease, 2012. 5–16.
Figures