0909
Neurodegenerative and functional signatures of the cerebellar cortex in m.3243A>G patients1Robarts Research Institute, Western University, London, ON, Canada, 2Department of Cognitive Neuroscience, Maastricht University, Maastricht, Netherlands, 3Department of Medical Biophysics, Schulich School of Medicine and Dentistry, Western University, London, ON, Canada, 4Department of Genetics and Cell Biology, Maastricht University, Maastricht, Netherlands, 5Maastricht Center for Systems Biology, Maastricht University, Maastricht, Netherlands, 6Institute for Basic Science, Center for Neuroscience Imaging Research, Department of Biomedical Engineering, Sungkyunkwan University, Suwon, Republic of Korea, 7University Health Network, Toronto, ON, Canada
Synopsis
The m.3243A>G mutation is the most commonly observed mitochondrial mutation in humans. It causes a wide range of phenotypes, ranging from normal healthy aging to a severely affected quality of life through neuroradiological changes and cognitive impairment. Here, we studied the cerebellar changes in these patients and showed significant local reductions in gray matter tissue volume and functional connectivity using 7T MRI. Interestingly, its white matter remains relatively intact. Taken together, the current results contributes to the still limited understanding of brain pathologies in m.3243A>G patients.
Introduction
The m.3242A>G mitochondrial mutation is known to cause a wide range of symptoms which collectively are often referred to as the mitochondrial encephalopathy lactate acidosis and stroke-like episodes (MELAS) syndrome[1]. These patients are predominantly characterized by hearing impairment, exercise and glucose intolerance, as well as neurological changes and cognitive impairment[2]. In our first paper, using multi-parametric 7T MRI data, we provided a detailed quantitative description of m.3243A>G patients' brains, focusing especially on the neocortical changes[3]. We identified macroscopic brain correlates of m.3243A>G disease severity, including decreasing cortical volume with increasing 'mutation load' – the number of mitochondria within a cell that carry the mutation. In line with previous work, we observed changes in the cerebellar cortex, but these have not been investigated at an in-depth level yet. Therefore, the current work aims to characterize the cortical changes within the cerebellum more precisely. In addition, we test for changes in functional connectivity between the affected cerebellar area(s) and the rest of brain's (sub)cortex.Methods
Acquisition: Twenty-two m.3243A>G patients (age 41.23±10.29 yrs) and fifteen age-, gender- and education matched control subjects (38.40±14.24) were scanned. MP2RAGE, B1+[4],and rs-fMRI data were acquired using a whole-body 7T scanner (Siemens Healthineers, Erlangen, Germany) and 32-channel phased-array coil (Nova Medical, Wilmington, USA) with nominal isotropic voxel sizes of 0.7, 2 and 1.4 mm, respectively (see Table 1 for details). Dielectric pads were placed proximal to the temporal lobes to locally increase the transmit B1+ field and to improve its homogeneity across the brain[5].Voxel-based morphometry: Structural data were preprocessed, including cerebellar segmentation, as described in the initial paper[3]. Based on the manually-corrected cerebellar segmentations, morphometry was performed using the SUIT (v3.2)[6] and VBM[7] toolboxes for SPM12 by normalizing the gray matter (GM) probability map to a spatially-unbiased template of the cerebellum. Then, modulation of the normalized GM maps – to account for volume changes during the transformation – will reduce/enhance intensity in regions characterized by lower/higher GM density, respectively.
Functional connectivity analyses: rs-fMRI EPI volumes were pre-processed by slice-timing, motion and distortion correction, and spatial smoothing (FWHM=5 mm3). Pre-processed BOLD timeseries were then denoised using the standard routine implemented within the CONN toolbox[8]. To allow ROI-wise analyses, residual timeseries were fitted to a 2 mm3 MNI template by linearly coregistering the subject’s mean rs-fMRI EPI volume to the subject’s native skull stripped anatomical volume and applying the non-linear subject’s native anatomical-to-MNI transformation matrix using SPM12. ROIs were defined by the VBM results (‘seed ROIs’) and those from the atlas within CONN. For each subject, ROI-to-ROI connectivity (i.e., Fisher-transformed bivariate correlation) matrices were computed and used for statistical analyses.
Statistical analyses: Group differences were explored using the outputs from the VBM and rs-fMRI workflows and the appropriate statistical models implemented in the SPM12 and CONN toolboxes. Where necessary, age, gender and estimated total intracranial volume were included as covariates, and FDR-correction was applied to control for multiple comparisons.
Results
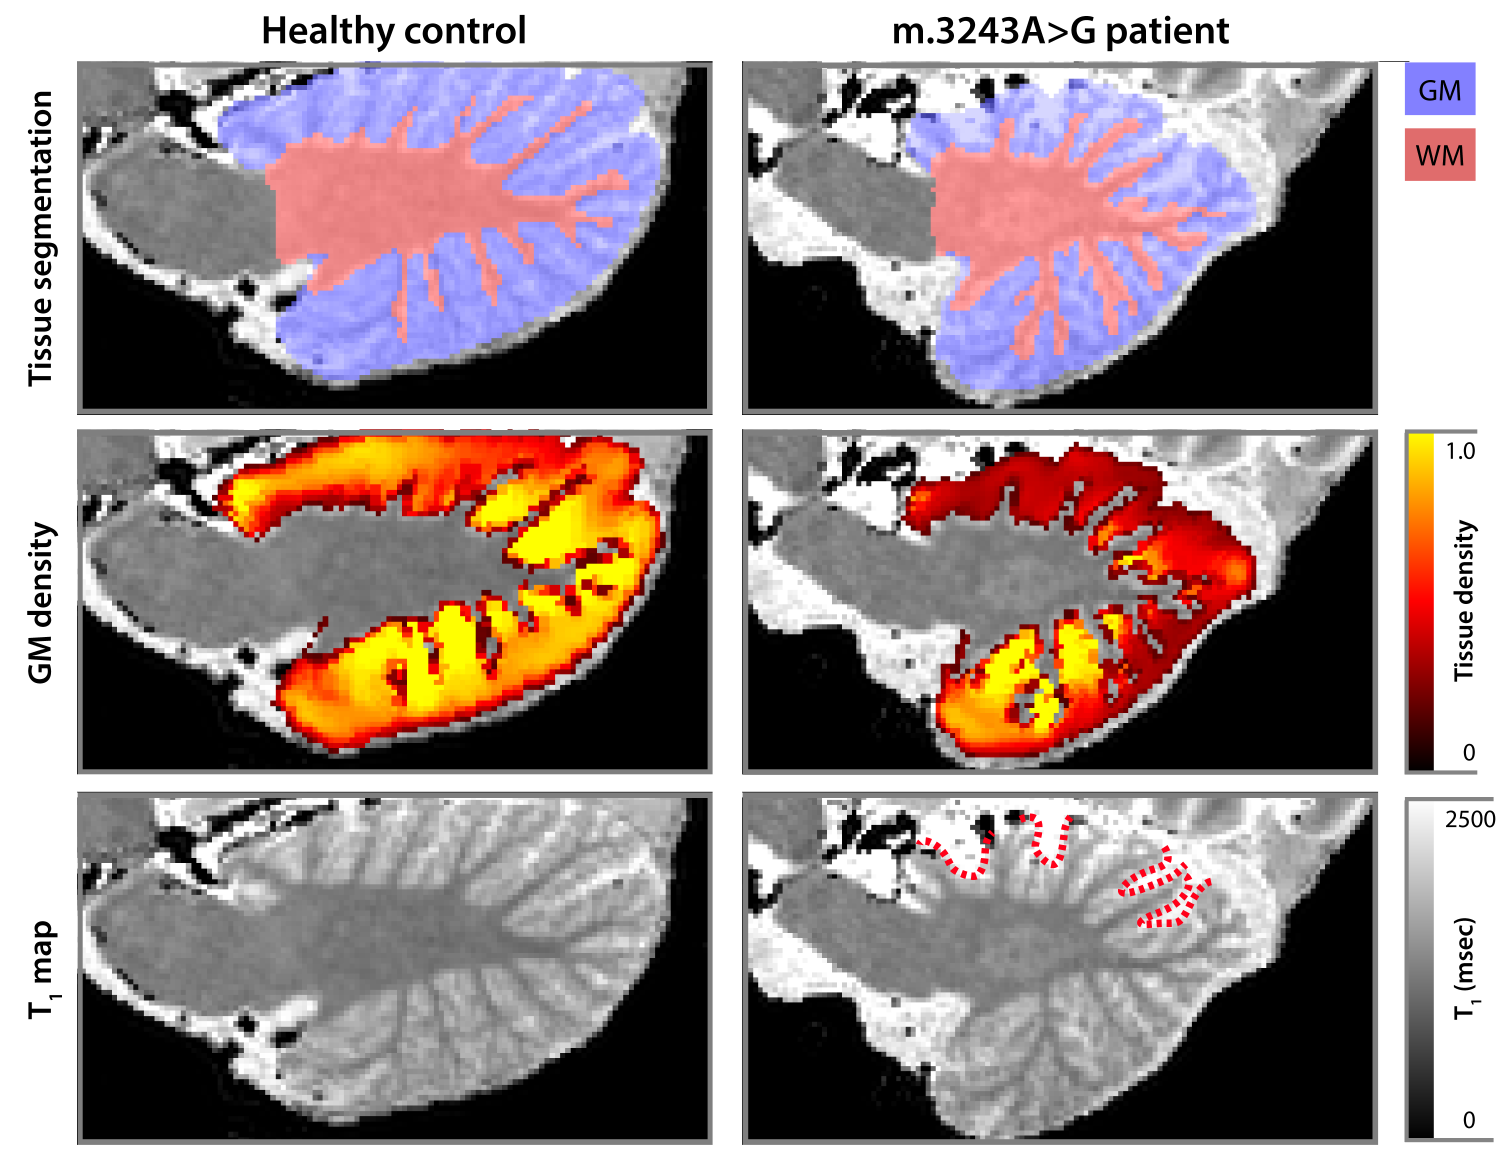
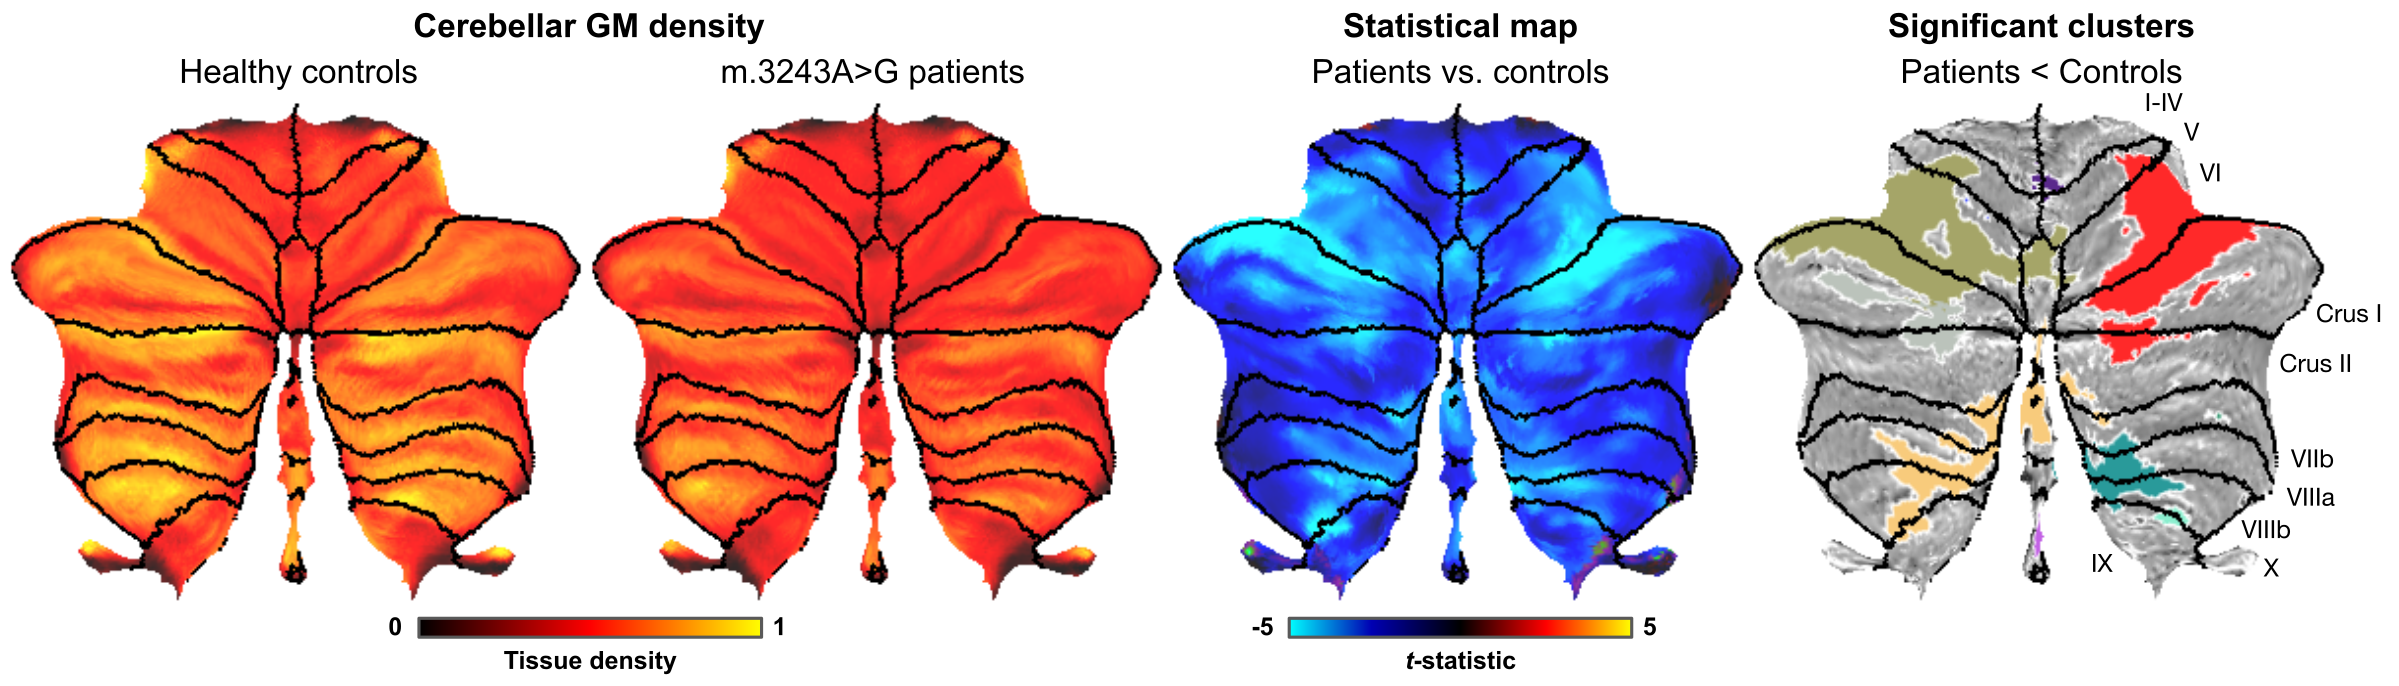
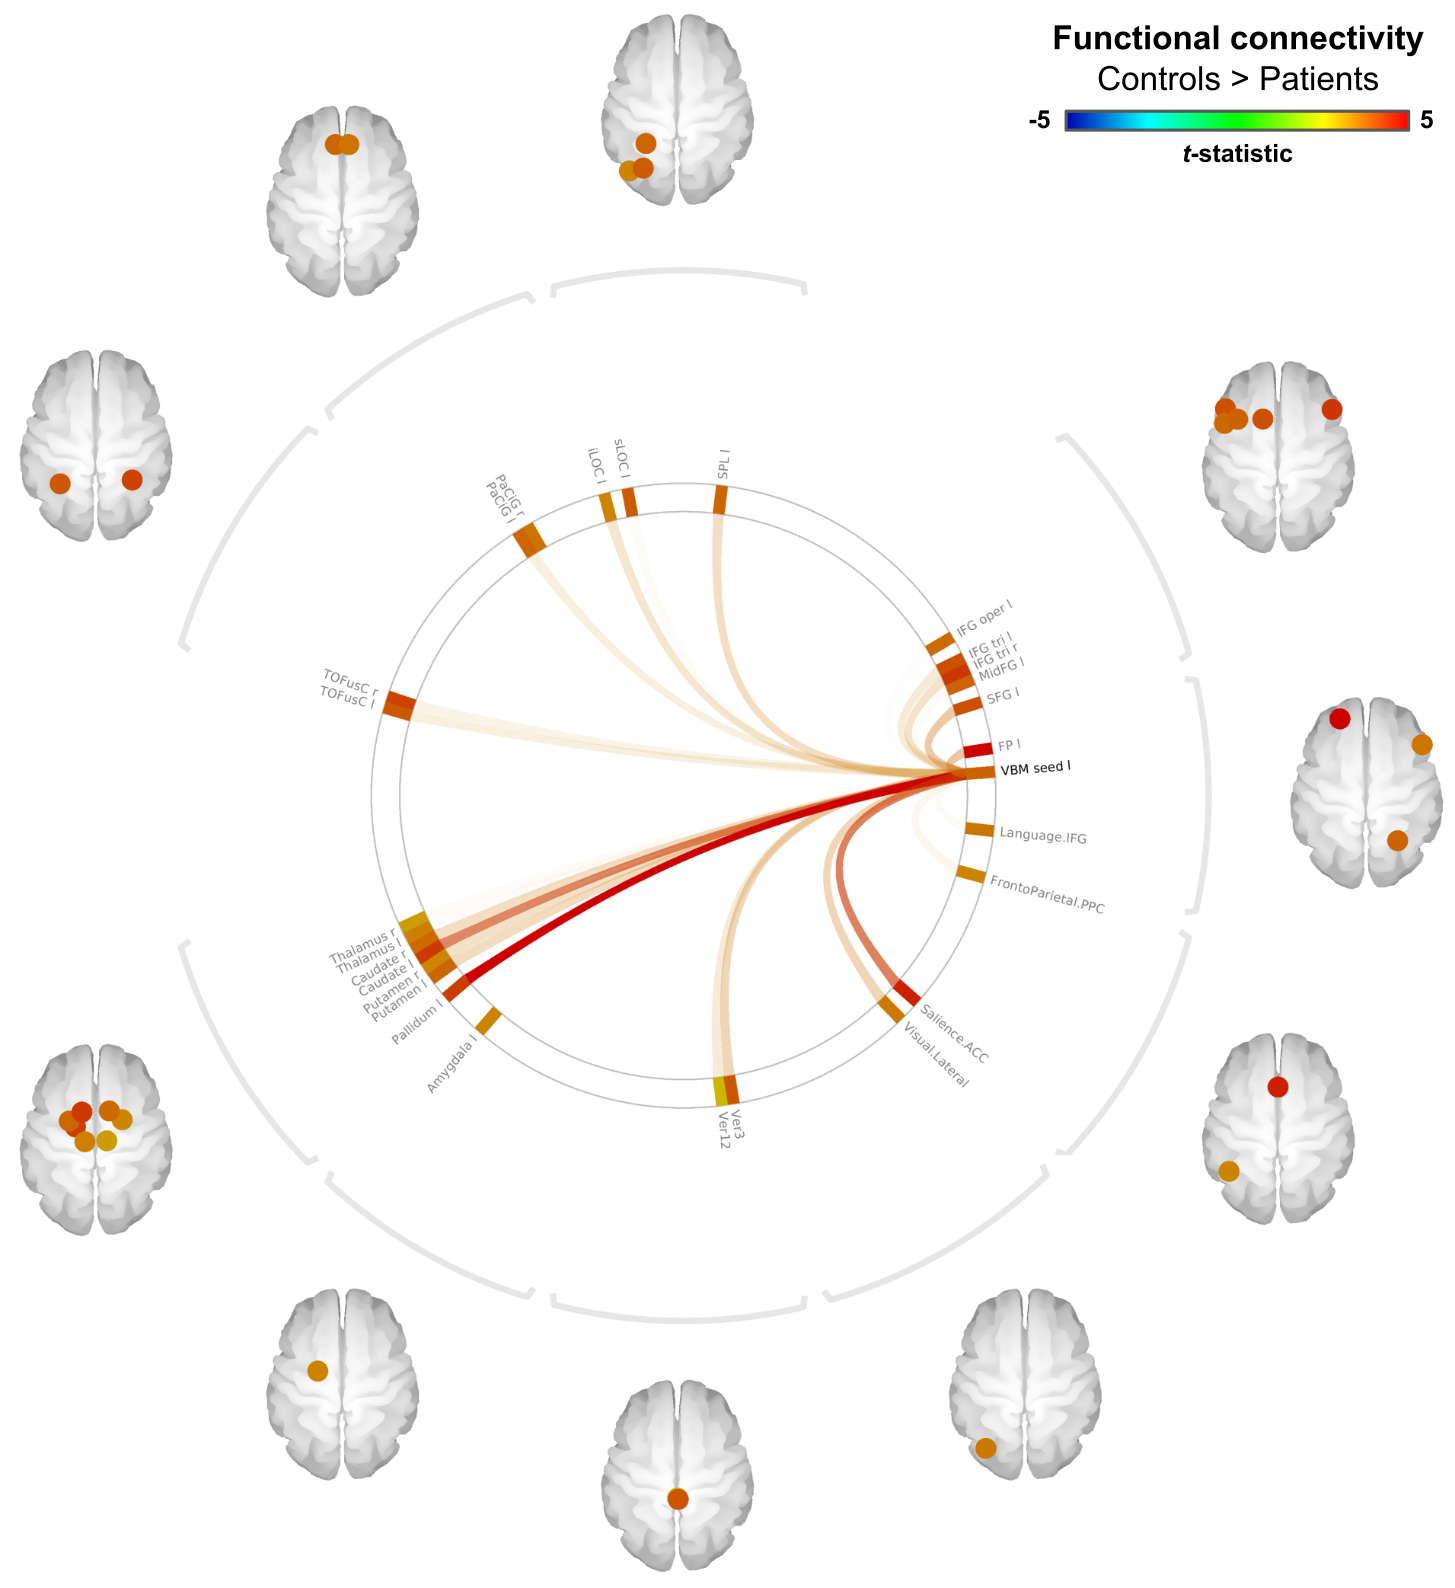
Example cerebellar GM (semi-transparent blue overlay) and WM (red) segmentations, GM density (a.u.) and quantitative T1 maps (msec), for a healthy control (left) and m.3243A>G (right) patient, are shown in Figure 1, top to bottom, respectively. It is clearly visible that the m.3243A>G patient's cerebellar GM is characterized by lower tissue density. Here, the superior part seems to affected most, apparent also by the larger interfolial spaces (demarcated using dashed red lines). The patients' reduced GM density is confirmed by comparing the groups' left and right hemisphere averages in Figure 2A and cerebellar lobules in Figure 2B (following the parcellation in Figure 2C).While results in Figure 2 show a 'global' decrease in GM volume, Figure 3 allows more precise localization of the differences by mapping the GM density and VBM results onto an 'unfolded' (i.e., flatmap) representation of the cerebellar GM. GM density (Figure 3A) is lower throughout the entire cerebellar GM for patients based on the structure-wide negative (i.e., in blue) t-statistic (Figure 3B). However, cluster-wise correction reveals several bilateral (color-coded) patches of tissue within the VI-Crus I and VIIIa-VIIIb lobules that are characterized by significant volume reduction (p<0.05, FDR-corrected, see Figure 3C). These patches were then used as seeds-ROIs to probe for differences in functional connectivity profiles across groups. Here, preliminary analyses by using the right hemisphere VI-Crus I cluster (i.e., red in Figure 3C) as example, show a significant (p<0.05, FDR-corrected) reduction in functional connectivity to the ipsilateral pallidum.
Discussion
These new results highlight a strong m.3243A>G mutation effect on the cerebellar anatomy, and on its functional connectivity. While we observe a global decrease in GM density, VBM analyses reveal multiple distinct clusters, located on both sides of the cerebellum, that are characterized by significantly reduced GM density. Based on a recently published functional cerebellar atlas[9], the affected regions largely colocalize with regions linked to divided attention, which coincides with our patients' worse performance on attention-related tasks[3]. However, more thorough analyses of the rs-fMRI are necessary to map the m.3243A>G functional consequences more precisely. Taken together, our results show involvement, not only of the cerebral cortex, but also of the cerebellar system in the m.3243A>G brains' phenotype.Acknowledgements
The author Roy AM Haast is supported by the BrainsCAN postdoctoral fellowship for this work. This research is enabled in part by support provided by Compute Canada (www.computecanada.ca).References
[1] Goto et al. Nature. 1990 Dec 13;348(6302). [2] de Laat et al. J Inherit Metab Dis. 2012 Nov;35(6). [3] Haast et al. Neuroimage Clin. 2018 Jan 31;18:231-244. [4] Marques and Gruetter, PLoS One. 2013 Jul 16;8(7). [5] Teeuwisse et al. Magn Reson Med. 2012 Apr;67(4). [6] Diedrichsen et al. Neuroimage. 2009 May 15;46(1):39-46. [7] Ashburner and Friston, Neuroimage. 2000 Jun;11(6 Pt 1):805-21. [8] Whitfield-Gabrieli and Nieto-Castanon, Brain Connect. 2012;2(3):125-41. [9] King et al. Nat Neurosci. 2019 Aug;22(8):1371-1378.
Figures