0908
In vivo Quantification of Restriction Sizes in Gray Matter of Rat Brain Using Temporal Diffusion Spectroscopy1Vanderbilt University Institute of Imaging Science, nashville, TN, United States
Synopsis
The diffusion time (tdiff) dependence of diffusion MRI signals provides a means to characterize tissue microstructure at cellular levels. Several studies have reported the diffusion time dependence of diffusion signals from rodent brains in health and disease, as well as human brains. Here, we apply IMPULSED (Imaging Microstructural Parameters Using Limited Spectrally Edited Diffusion), a temporal diffusion spectroscopy-based method that we have described previously, to map the mean restriction size for water diffusion in gray matter of the rat brain in vivo by fitting the tdiff dependence of diffusion signals to a simple biophysical model.
Introduction
The diffusion time (tdiff) dependence of diffusion-weighted signals in rodent and human brains over the regime of tdiff ≈ 1-40 ms has been recently reported, and the information provided interpreted as potential biomarkers of neuropathology (1-4). However, it is challenging to associate parameters that have ambiguous biophysical origins (e.g., differences in DWI/DTI/DKI-derived parameters between diffusion measurements using long and short tdiff) with specific pathological changes. Complex and multi-parametric models may provide more precise descriptions of water diffusion, and may allow the derivation of specific cellular properties directly, but they require more measurements and higher signal-to-noise ratio to fit multiple model parameters. Here, we propose a more pragmatic approach based on IMPULSED (Imaging Microstructural Parameters Using Limited Spectrally Edited Diffusion) (5-7), a diffusion imaging protocol which allows reliable and robust assessments of gray matter microanatomy by fitting a limited set of diffusion signals to a simplified biophysical model of water compartments. Parameters derived from this method are consistent with soma size and density, which are important morphological substrates of the nervous system, and thus could potentially have broad applications. In addition, we investigated how microcirculatory flow affects the quantification of IMPULSED in brain in vivo, which has usually been ignored in tdiff dependence studies in brains.Theory and Methods
We model diffusion MRI signals in gray matter as a sum of signals from Intravoxel Incoherent Motion (IVIM), such as blood microcirculation and CSF flow, and cellular tissue components as in Eq.[1]. $$S_{GM}(b,t_{diff})=v_{IVIM}S_{IVIM}(b,t_{diff})+(1-v_{IVIM})S_{tissue}(b,t_{diff})(1)$$where vIVIM is the flow fraction and the latter consists of three non-exchanging compartments: neurite, soma (cell body) and extra-neuronal spaces. Neurites are modelled as cylinders of infinitesimal diameter and the soma as spheres. If direction-averaging for each b shell (i.e. spherical mean) is used to remove orientation dependence, we obtain
$$S_{tissue}(b,t_{diff})=v_{neurite}S_{neurite}(b)+v_{soma}S_{soma}(b,t_{diff})+(1-v_{neurite}-v_{soma})S_{ex}(2)$$
$$S_{neurite}(b)=\sqrt{π/4bD_{in}}erf(\sqrt{bD_{in}}),S_{ex}=exp(-bD_{ex}),S_{soma}=E(d,D_{const})$$
where vneurite and vsoma are the signal fractions of intra-neurites and intra-soma spaces. Ssoma from cell bodies is modelled as water diffusion restricted in impermeable spheres, whose analytical expressions for MRI pulse sequences using different gradient waveforms have been reported previously (5) as a function (E) of restriction size d (associated with the soma size) and intrinsic diffusion coefficient Din_soma. Solving Eq.[2] may require data with a wide range of b values (up to 40 ms/µm2) (8). Here we use the different tdiff properties to tease out Ssoma. For the tdiff used in this study (1-48 ms), the major tdiff dependence is caused by the soma ( 5 – 10 μm) while Sneurite and Sex have much smaller tdiff dependence because of relatively smaller and larger restriction sizes, respectively. Therefore, after removing the IVIM component, the direction-averaged signals can be written as a sum of “apparently restricted” (e.g. Ssoma) and “none-apparently restricted” (i.e. the sum of Sneurite and Sex approximated as a mono-exponential term using Taylor expansion for simplicity) as
$$S_{tissue}(b,t_{diff})=v_{res}E(d,D_{in_soma})+(1-v_{res})exp(-bD_{const})(3)$$ where Dconst is a linear combination of Din and Dex. Although the first term represents soma signals in the model, in practice it includes all the signal contributions from restrictions of length scales that can be detected over tdiff ranging from 1 – 48 ms. We therefore replace the variable vsoma by volume fraction of restricted diffusion vres.
To remove the IVIM component, the in vivo direction-averaged signal curves from rat brains acquired at 0.2 ms/µm2 ≤ b ≤ 1.0 ms/µm2 were extrapolated to obtain a y-intercept assuming a mono-exponential model. The y-intercept normalization transformed Sgraymatter to Stissue, which was fit to Eq.[3] to generate three parameters (restriction size d, vres, and Dconst). Din_soma was fixed at 2 μm2/ms as it better stabilizes the fittings of the other three parameters with minor biases (6).
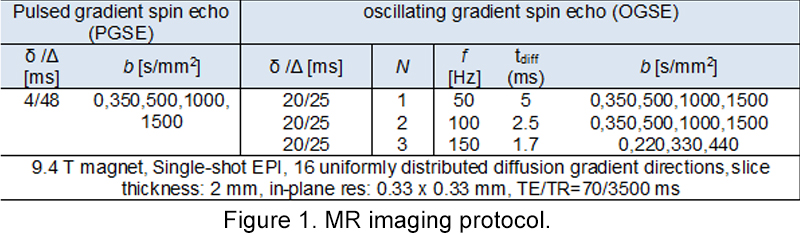
In this study, three male Sprague-Dawley rats were imaged using the protocol summarized in Figure 1.
Results
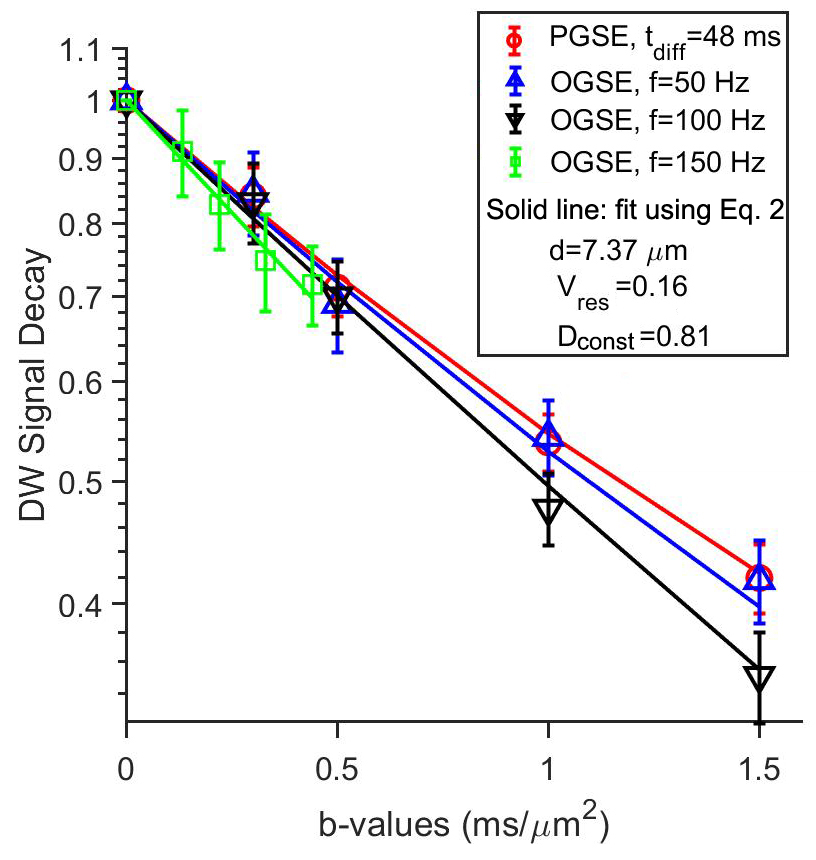
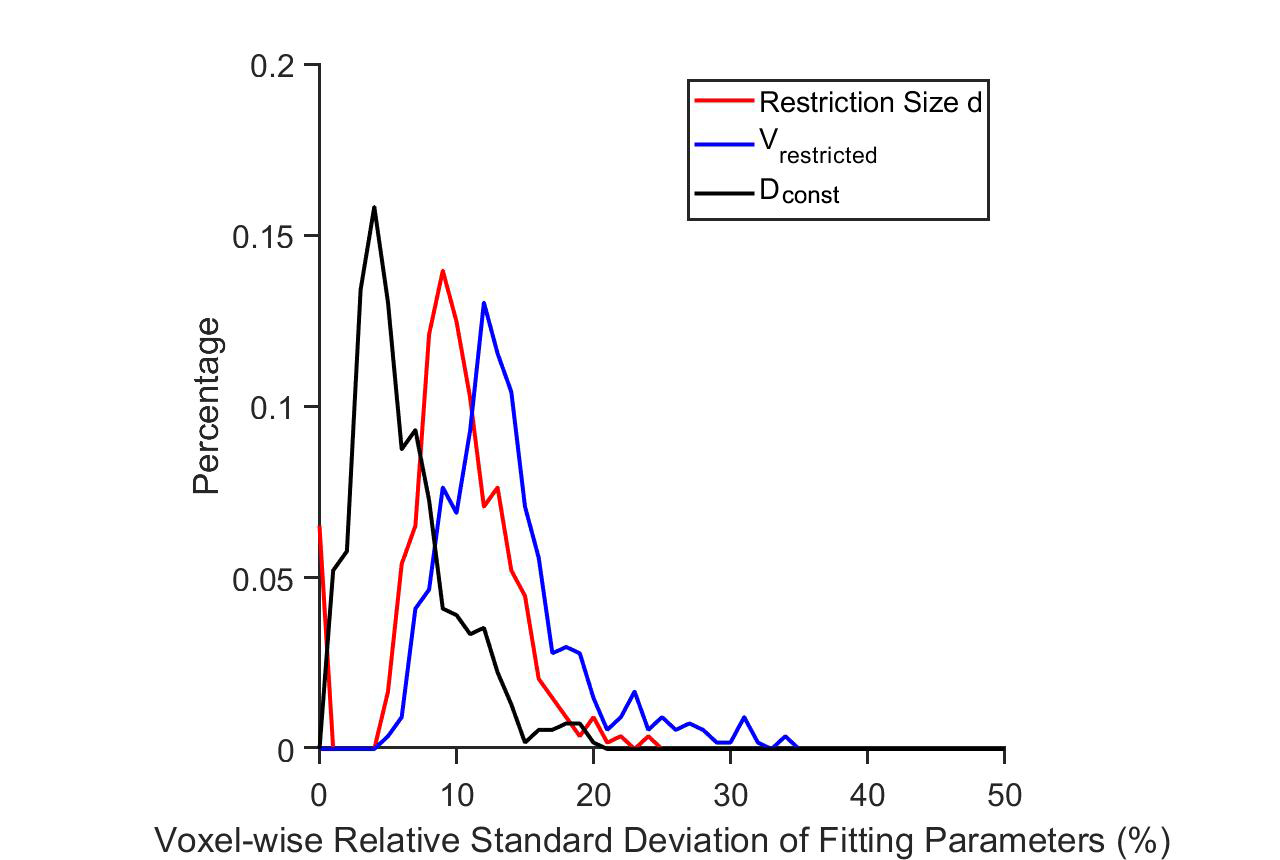
fIVIM for gray matters from a single slice of the rat brain were 6.6±6.52%, 5.8±5.71%, 4.3±4.21%, and 0.3±0.01%, for effective tdiff = 48, 5, 2.5, and 1.7 ms (Figure 2). After removing the IVIM effects, voxel signals were examined using an F test to determine whether a model with either constant or varying ADCs at different diffusion times/oscillating gradient frequencies is statistically more justified. Voxel signals showing varying ADCs were fit to Eq.[2] (Figure 3) to generate three parametric maps (Figure 4A-D). The restriction size d, vres, and Dconst for all the gray matters, are 6.5±2.70 µm, 19.7±8.23%, and 1.1±0.34 µm2/ms, respectively (Figure 4E-G). The precision of the voxel-wise parameter estimates were assessed by calculating the covariance matrix of the fitted parameters. As shown in Figure 5, Dconst has the highest precision with a relative standard deviation (RSD) of ~ 5%. The RSDs of restriction size d and vres are ~ 10% and 14%.Discussion and Conclusion
The fitted restriction size in gray matter is about 6.5 µm, and the cellularity, approximated by ≈2(3vres/2π)2/3/d2, is ~ 105 per mm2. Both are in line with reported soma sizes (9) and neuron densities in the gray matter of rat brain (10). These findings, although still requiring further histological validation, may be used as a basis for obtaining novel contrast sensitive to cell body sizes and neuron densities, and potentially lead to new biomarkers of pathology.Acknowledgements
This study was supported by NIH 5R01CA109106-13References
1. Wu D, Martin LJ, Northington FJ, Zhang J. Oscillating-gradient diffusion magnetic resonance imaging detects acute subcellular structural changes in the mouse forebrain after neonatal hypoxia-ischemia. Journal of cerebral blood flow and metabolism : official journal of the International Society of Cerebral Blood Flow and Metabolism 2019;39(7):1336-1348.
2. Aggarwal M, Jones MV, Calabresi PA, Mori S, Zhang J. Probing mouse brain microstructure using oscillating gradient diffusion MRI. Magnetic resonance in medicine 2012;67(1):98-109.
3. Baron CA, Beaulieu C. Oscillating gradient spin-echo (OGSE) diffusion tensor imaging of the human brain. Magnetic resonance in medicine 2014;72(3):726-736.
4. Does MD, Parsons EC, Gore JC. Oscillating gradient measurements of water diffusion in normal and globally ischemic rat brain. Magnetic resonance in medicine 2003;49(2):206-215.
5. Gore JC, Xu JZ, Colvin DC, Yankeelov TE, Parsons EC, Does MD. Characterization of tissue structure at varying length scales using temporal diffusion spectroscopy. NMR in biomedicine 2010;23(7):745-756.
6. Xu Junzhong JX LH, Arlinghaus Lori R, McKinley Eliot T, Devan Sean P, Hardy Benjamin M, Xie Jingping, Kang Hakmook, Chakravarthy Anuradha B, Gore John C. Magnetic resonance imaging of mean cell size in human breast tumors. arXiv preprint 2019;190507818.
7. Jiang X, Li H, Xie J, McKinley ET, Zhao P, Gore JC, Xu J. In vivo imaging of cancer cell size and cellularity using temporal diffusion spectroscopy. Magnetic resonance in medicine 2017;78(1):156-164. 8. Palombo M, Ianus A, Nunes DC, Guerreri M, Alexander DC, Shemesh N, Zhang H. SANDI: a compartment-based model for non-invasive apparent soma and neurite imaging by diffusion MRI. 2019. 9. Meitzen J, Pflepsen KR, Stern CM, Meisel RL, Mermelstein PG. Measurements of neuron soma size and density in rat dorsal striatum, nucleus accumbens core and nucleus accumbens shell: differences between striatal region and brain hemisphere, but not sex. Neuroscience letters 2011;487(2):177-181.
10. Bandeira F, Lent R, Herculano-Houzel S. Changing numbers of neuronal and non-neuronal cells underlie postnatal brain growth in the rat. Proceedings of the National Academy of Sciences of the United States of America 2009;106(33):14108-14113.
Figures