0905
Oxygen carrier therapy slows infarct growth in large vessel occlusion dog model based on perfusion- and diffusion-weighted MRI analysis1University of Massachusetts Medical School, Worcester, MA, United States, 2Worcester Polytechnic Institute, Worcester, MA, United States, 3Omniox Inc., San Carlos, CA, United States
Synopsis
The dog large vessel occlusion (LVO) model mimics the clinical trend observed in patients where the brain infarct follows either a slow or fast progression. The dog LVO model can be used in the design of new therapeutics to improve clinical outcome in patients. This study examined the effect of an oxygen carrier in its ability to slow infarct growth in the dog LVO model. In fast evolvers, the oxygen carrier therapy prolonged infarct progression and reduced the final normalized infarct volume. Delaying infarct progression can potentially extend the time-window for thrombectomy enabling more patients to receive this critical treatment.
Introduction
The dog large vessel occlusion (LVO) model has been developed to assess neuroprotectants and other therapeutics.1 This model, similar to that observed in humans, tends to develop brain infarct at either a fast or slow rate. More recently, this dog model was refined to predict the infarct progression pathway (slow vs. fast evolvers) based on time-to-peak (TTP) maps derived from perfusion-weighted (PW) MRI within 30 min of middle cerebral artery occlusion (MCAO).2 This refinement allows study design of new therapeutics by removing the natural history effect from the treatment effect. Supplemental oxygen carrier therapy is a treatment mechanism that could slow the infarct growth thereby prolonging the time-window for treatment. In this study, the dog LVO model was used to examine the effect of an oxygen carrier in its ability to extend the time window before the infarct size reached 50% of maximum infarct volume based on diffusion-weighted (DW) MRI. Furthermore, a comparison was made between the PW-MRI predicted infarct volume and the DW-MRI final infarct volume at 5 h after MCAO.Methods
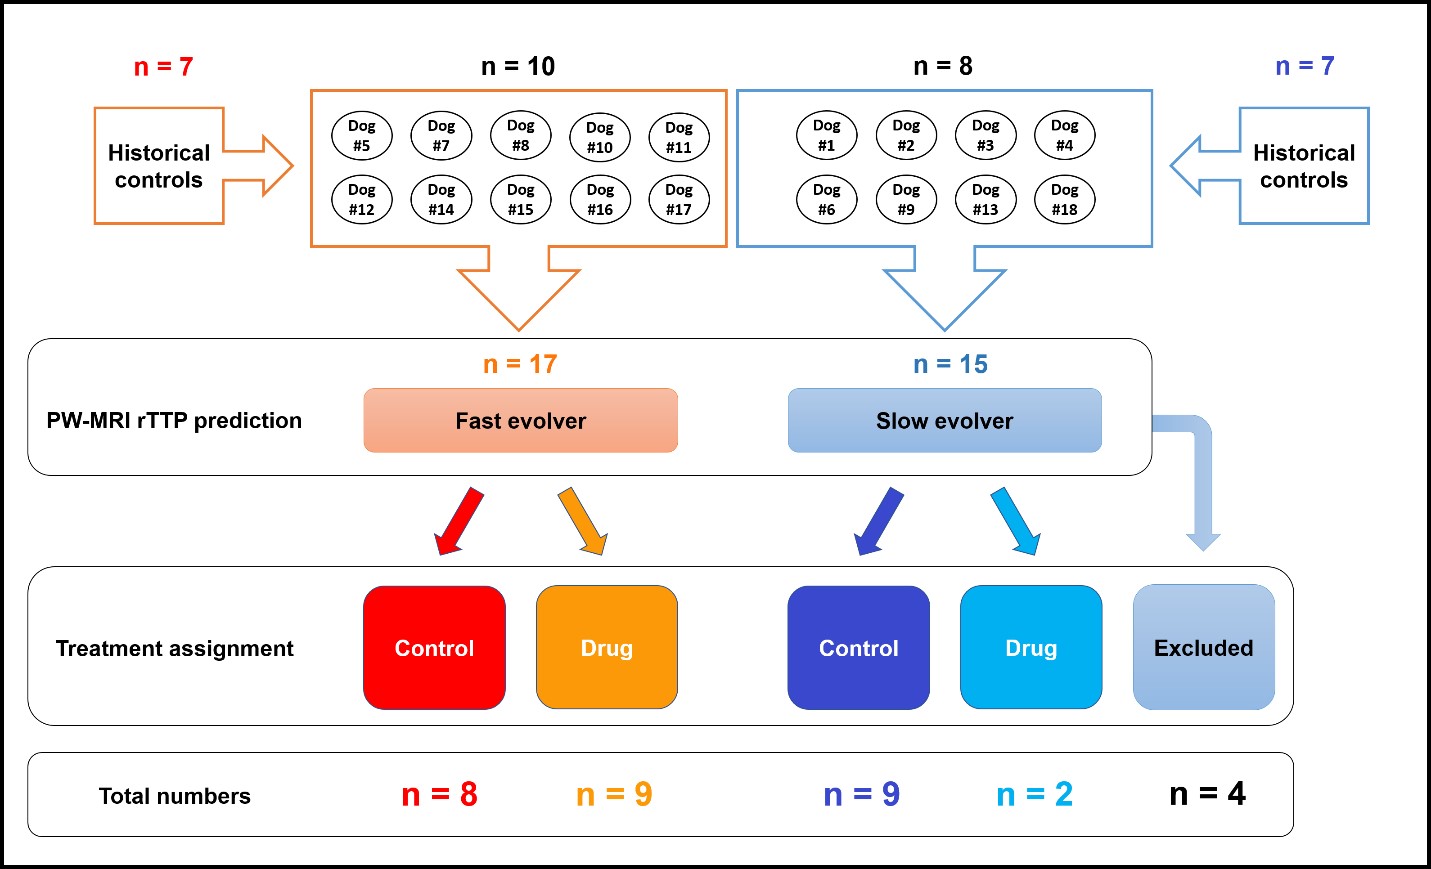
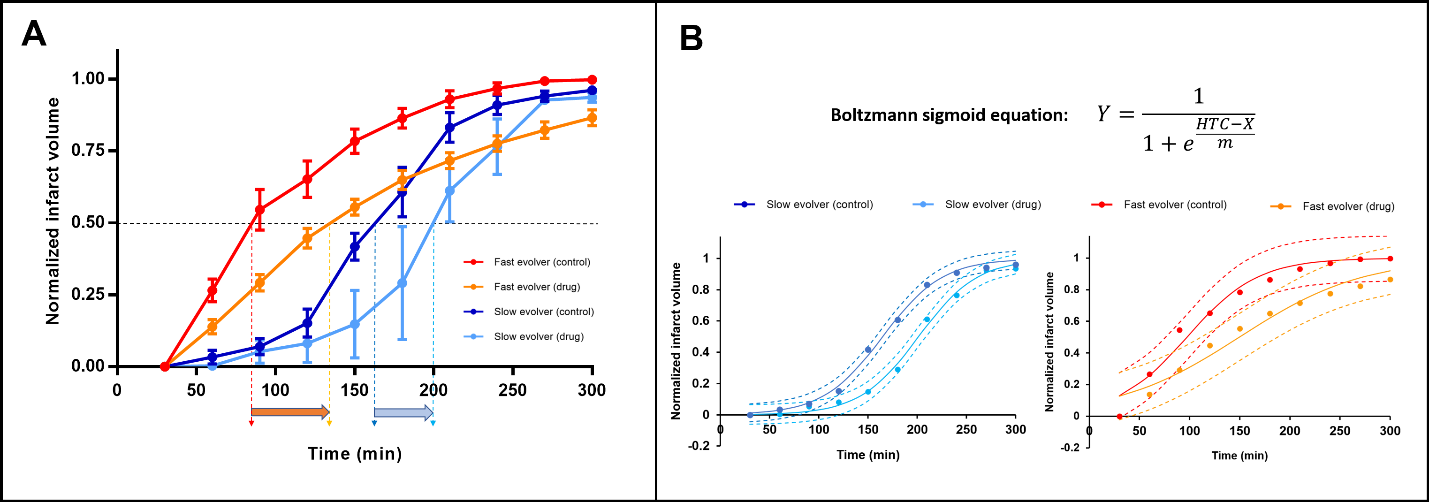
Eighteen dogs, based on the evolver type, were randomly assigned to receive saline or drug treatment. To improve the power of our study, we enriched our cohort with an additional 14 historical controls (7 fast and 7 slow evolvers). An autologous clot was injected into the MCA in order to cause an occlusion and subsequent infarction as described previously.2 After confirming occlusion using angiography, MRI was performed. Imaging protocol included time-of-flight (ToF) (TR/TE 20/4ms, FA = 20o, matrix 332×212), DW-MRI (TR/TE 2600/76ms, FA = 90o, b-values = 0, 1000 s/mm2, NEX = 6, matrix 144×144) and PW-MRI (TR/TE 1500/20.1ms, FA = 40o, 60 dynamics, matrix 320×320). For PW-MRI, 0.2 mmol/kg of Magnevist was injected with an intravenous (IV) injection during the 2nd of 60 dynamic scans (scan time = 90 s). Once PW-MRI was completed, a prediction was made whether the dog would be a fast or slow evolver based on binning of relative TTP (rTTP) map histograms as previously described.2 Each dog was assigned to receive either the oxygen carrier drug or control treatment for each of the two infarct evolution pathways (Fig. 1). Oxygen carrier treatment involved an IV bolus at ~45 min post MCAO followed by slow infusion for ~2 h. Control dogs were treated in a similar timeline with saline instead of the oxygen carrier. Histology was performed post-mortem using triphenyltetrazolium chloride (TTC) to confirm the size of the brain infarct region. To calculate the true infarct volume, apparent diffusion coefficient (ADC) maps were generated from DW-MRI images and all voxels within the brain region of interest (ROI) below the threshold of 0.53×10⁻³ mm2/s were considered to be infarcted tissue. To assess the predicted infarct size, rTTP maps were generated from PW-MRI images and all voxels within the brain ROI with a delay greater than 4.5 s relative to the contralateral hemisphere were considered to be within the region of eventually infarcted tissue. This volume based on rTTP was then used to normalize the ADC derived infarct volumes. Prior to the normalization, since this study sought to examine drug effects, the ADC derived infarct volumes from all time points were subtracted from the 30 min infarct volume, effectively setting the initial infarct volume to zero just prior to drug administration. The infarct evolution curves were then fit using a Boltzmann sigmoid function to calculate the half-time constant (HTC), i.e. the time taken to reach 50% of the final infarct volume.Results and Discussion
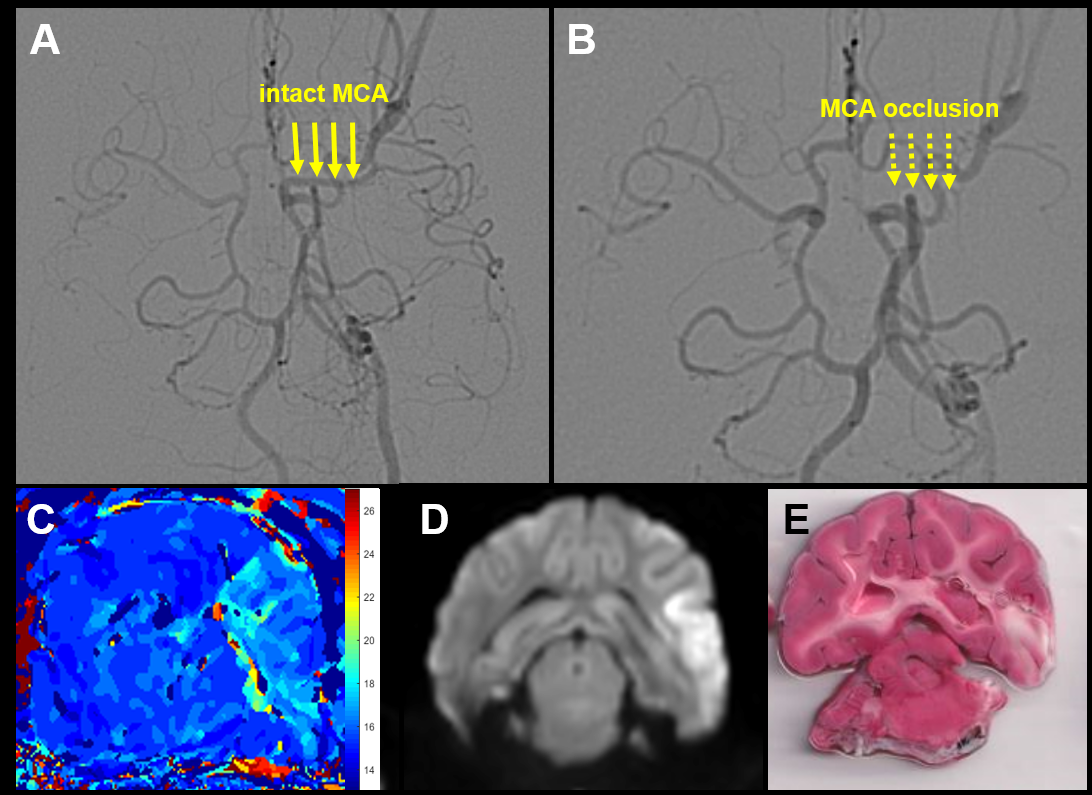
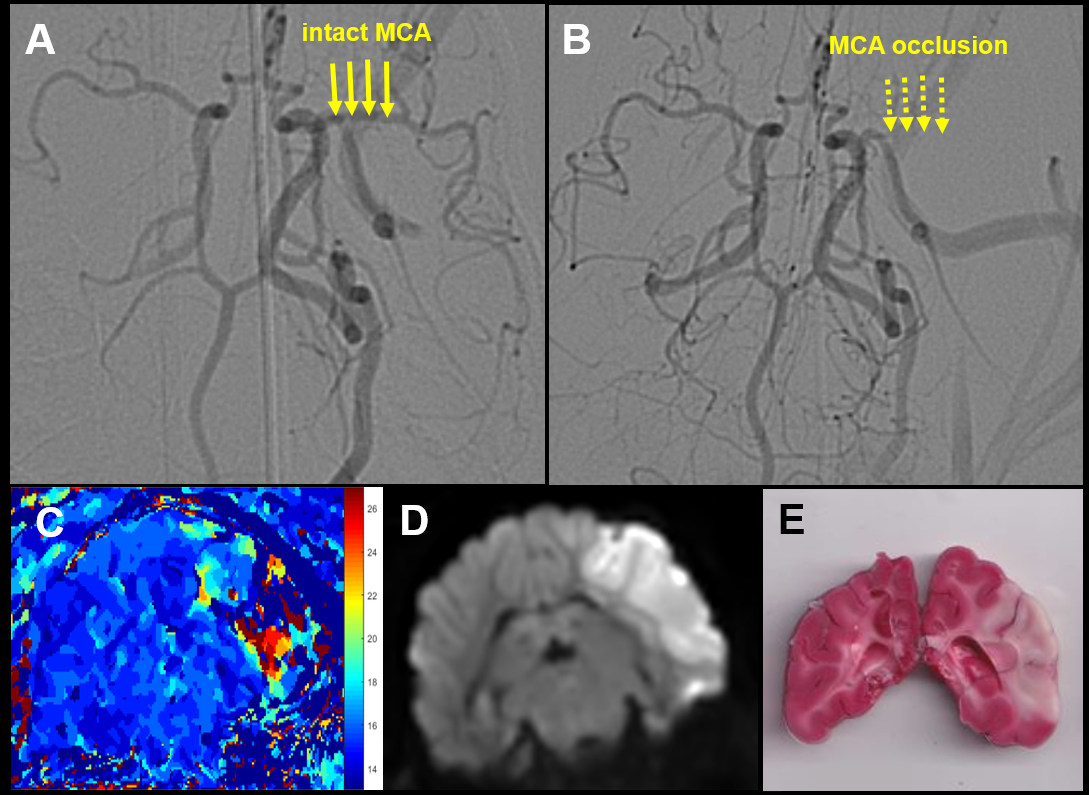
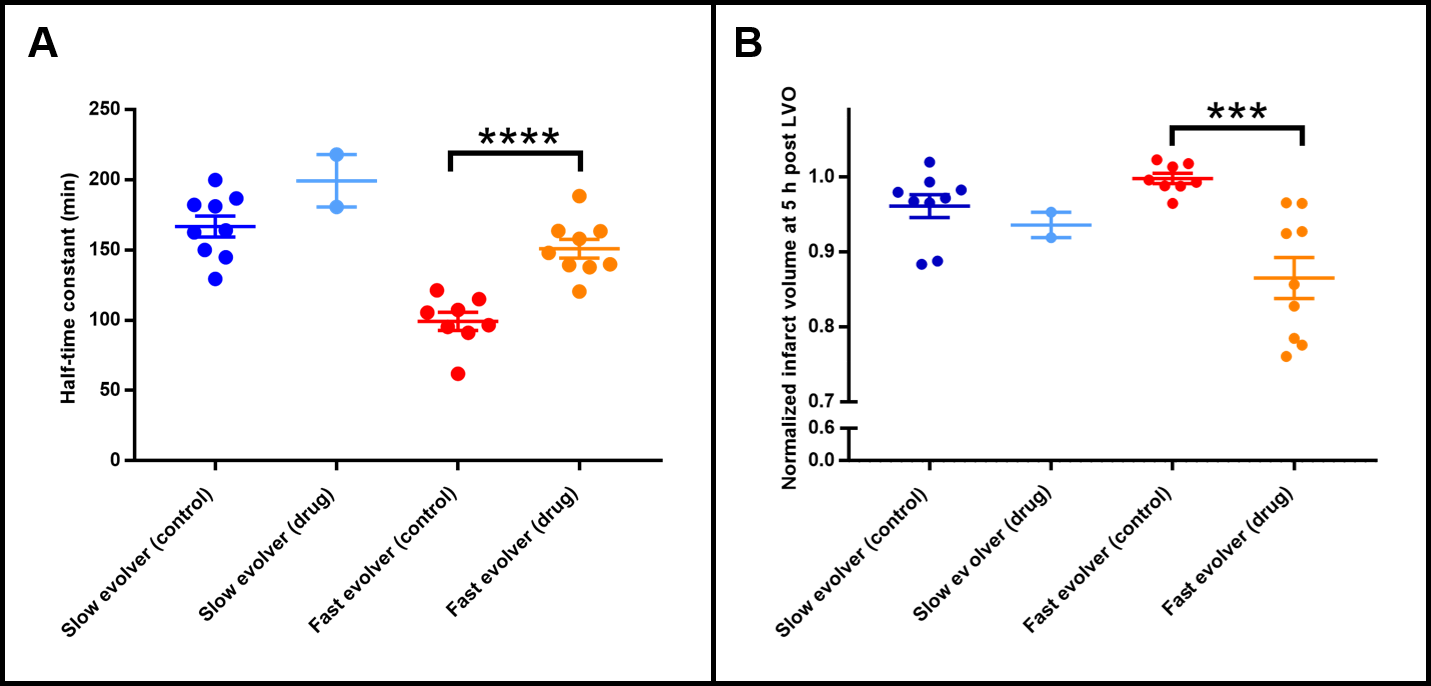
Of the 18 dogs in this study, 4 were excluded either due to a failure to maintain an LVO or an extremely small infarct volume. Of the 14 remaining dogs, 10 were fast evolvers and 4 were slow evolvers. Figures 2 and 3 show a representative animal from the slow and fast evolver groups, respectively. For both groups, the TTP map and the final DW image indicate the extent of the predicted infarct region and the final infarct region, respectively. Figure 4 shows the rate of infarct growth for all the groups where a significant delay in HTC is observed (Fig. 5A) in the treatment group compared to the control group (fast evolvers by ~50 min, slow evolvers by ~30 min). Without consideration of fast versus slow evolvers, the final infarct volume at 5 h post LVO (normalized to the predicted infarct volume) in the treatment group showed a significant reduction compared to that of the control group (0.88 vs. 0.98, drug vs. control, p = 0.001). A sub-group analysis (Figure 5B) showed a significant effect of the drug on the infarct size in fast evolvers and no significant effect in slow evolvers.Conclusion
The oxygen carrier treatment prolonged the HTC for both slow and fast evolvers. Furthermore, even 5 h post LVO the infarct size had not reached the predicted infarct volume for the treatment group indicating continued effects of the drug. A greater drug effect was observed in the fast evolver group which is consistent with the HTC measurements. This treatment strategy has the potential to salvage brain tissue in risk of infarction due the extended time window for a thrombectomy procedure.Acknowledgements
This work is funded by NINDS 5R44NS076272-03. The content is solely the responsibility of the authors and does not represent the official views of the NIH.References
1. Kang BT, Lee JH, Jung DI et al. Canine model of ischemic stroke with permanent middle cerebral artery occlusion: clinical and histopathological findings. J Vet Sci. 2007;8:369-376.
2. Shazeeb MS, King RM, Brooks OW et al. Infarct Evolution in a Large Animal Model of Middle Cerebral Artery Occlusion. Transl Stroke Res. 2019;doi: 10.1007/s12975-019-00732-9.
Figures