0903
Investigating cerebral energetics and neurotransmission using in vivo 1H MRS and [6,6′-2H2]glucose in a preclinical model1Department of Radiology, University of Pennsylvania, Philadelphia, PA, United States, 2Sidra Medicine, Doha, Qatar, 3LARC, Qatar University, Doha, Qatar, 4Department of Neurology, University of Pennsylvania, Philadelphia, PA, United States
Synopsis
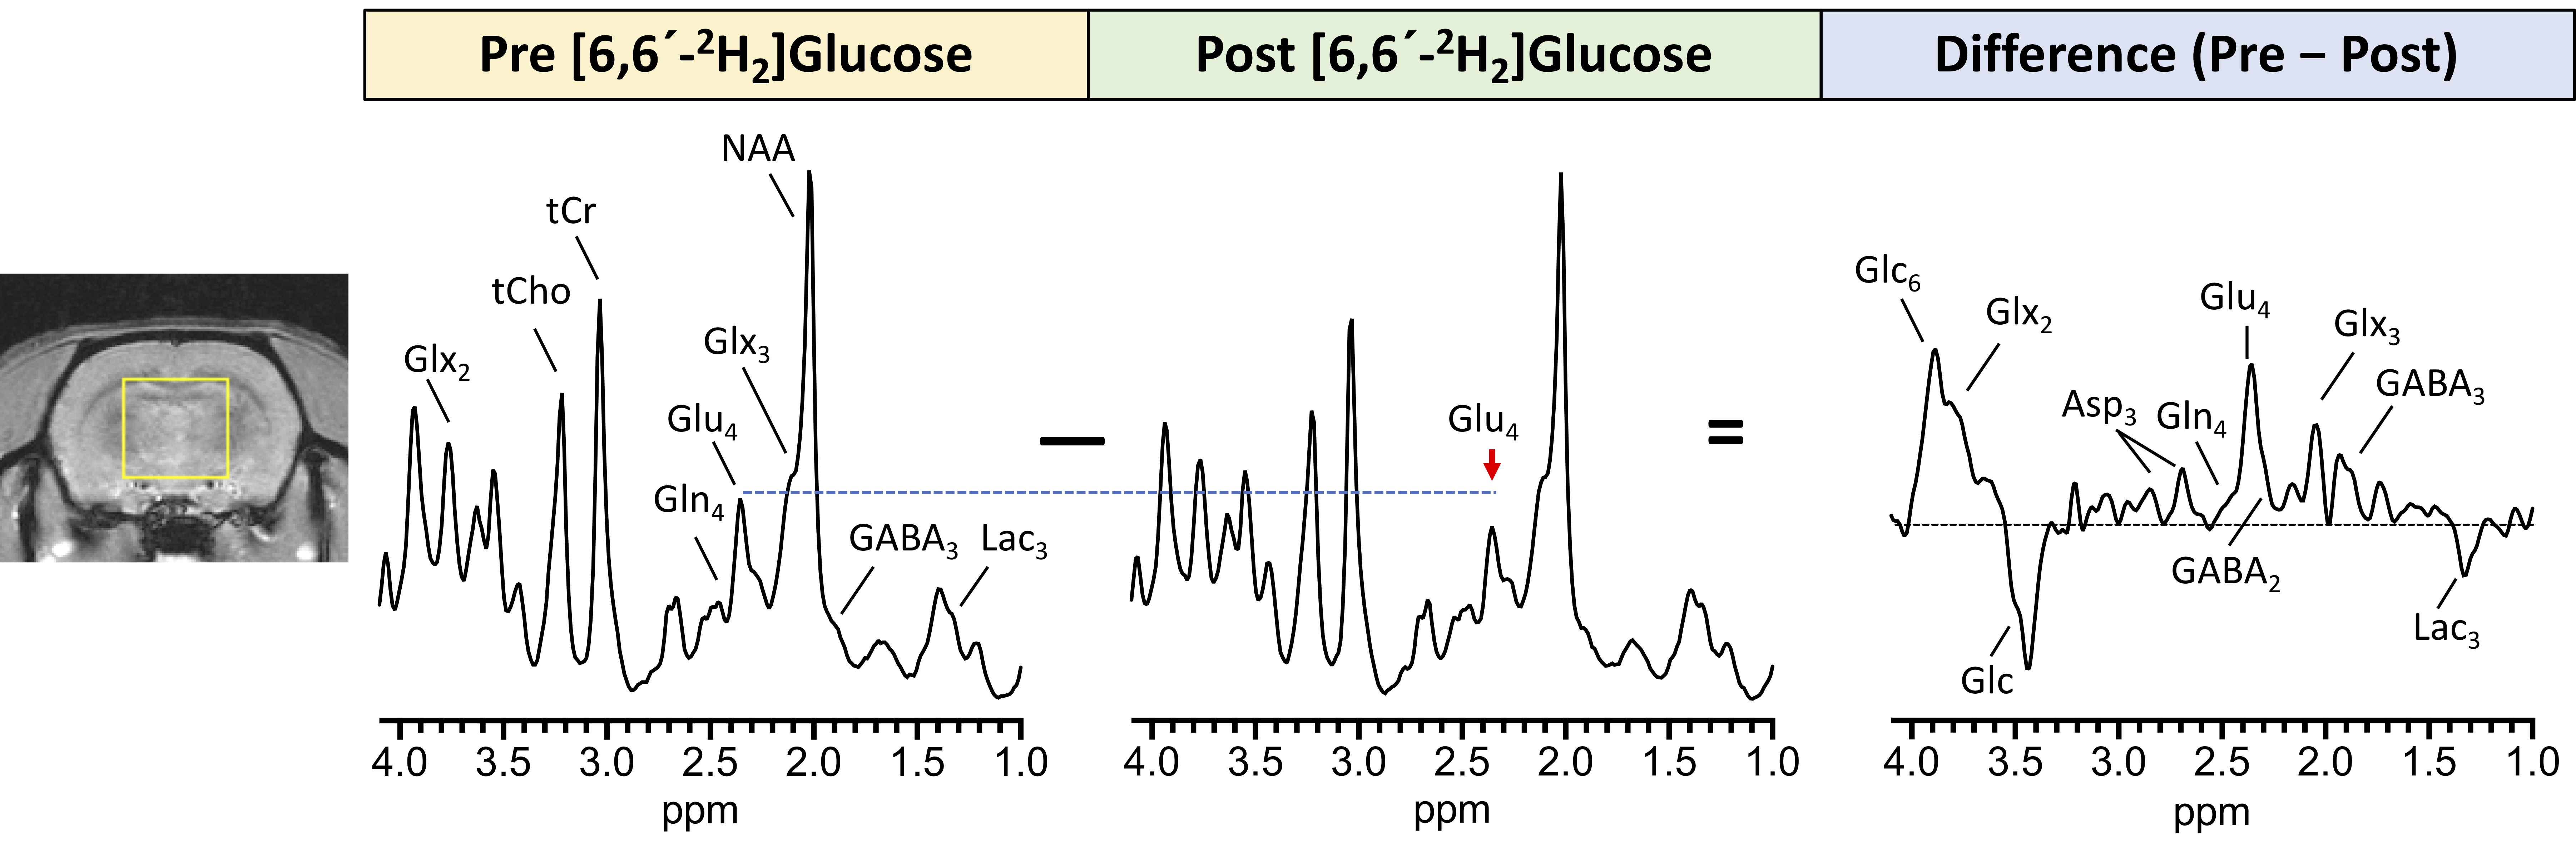
Energy metabolism and neurotransmission are two crucial processes affecting almost all aspects of cerebral function and 1H MRS allows the non-invasive detection and quantification of neurochemicals. In this study, we performed 1H MRS in conjuction with the administration of [6,6′-2H2]glucose to measure turnover kinetics of glutamate, glutamine and GABA in rat brain. As 2H is invisible on 1H MRS, the turnover of metabolites leads to a corresponding drop in their 1H MR signal visualized by subtraction of the Post-[6,6′-2H2]glucose administration from the Pre-administration 1H MR spectra. The fractional enrichment data can be fitted to evaluate the rates of cerebral energetics.
Introduction
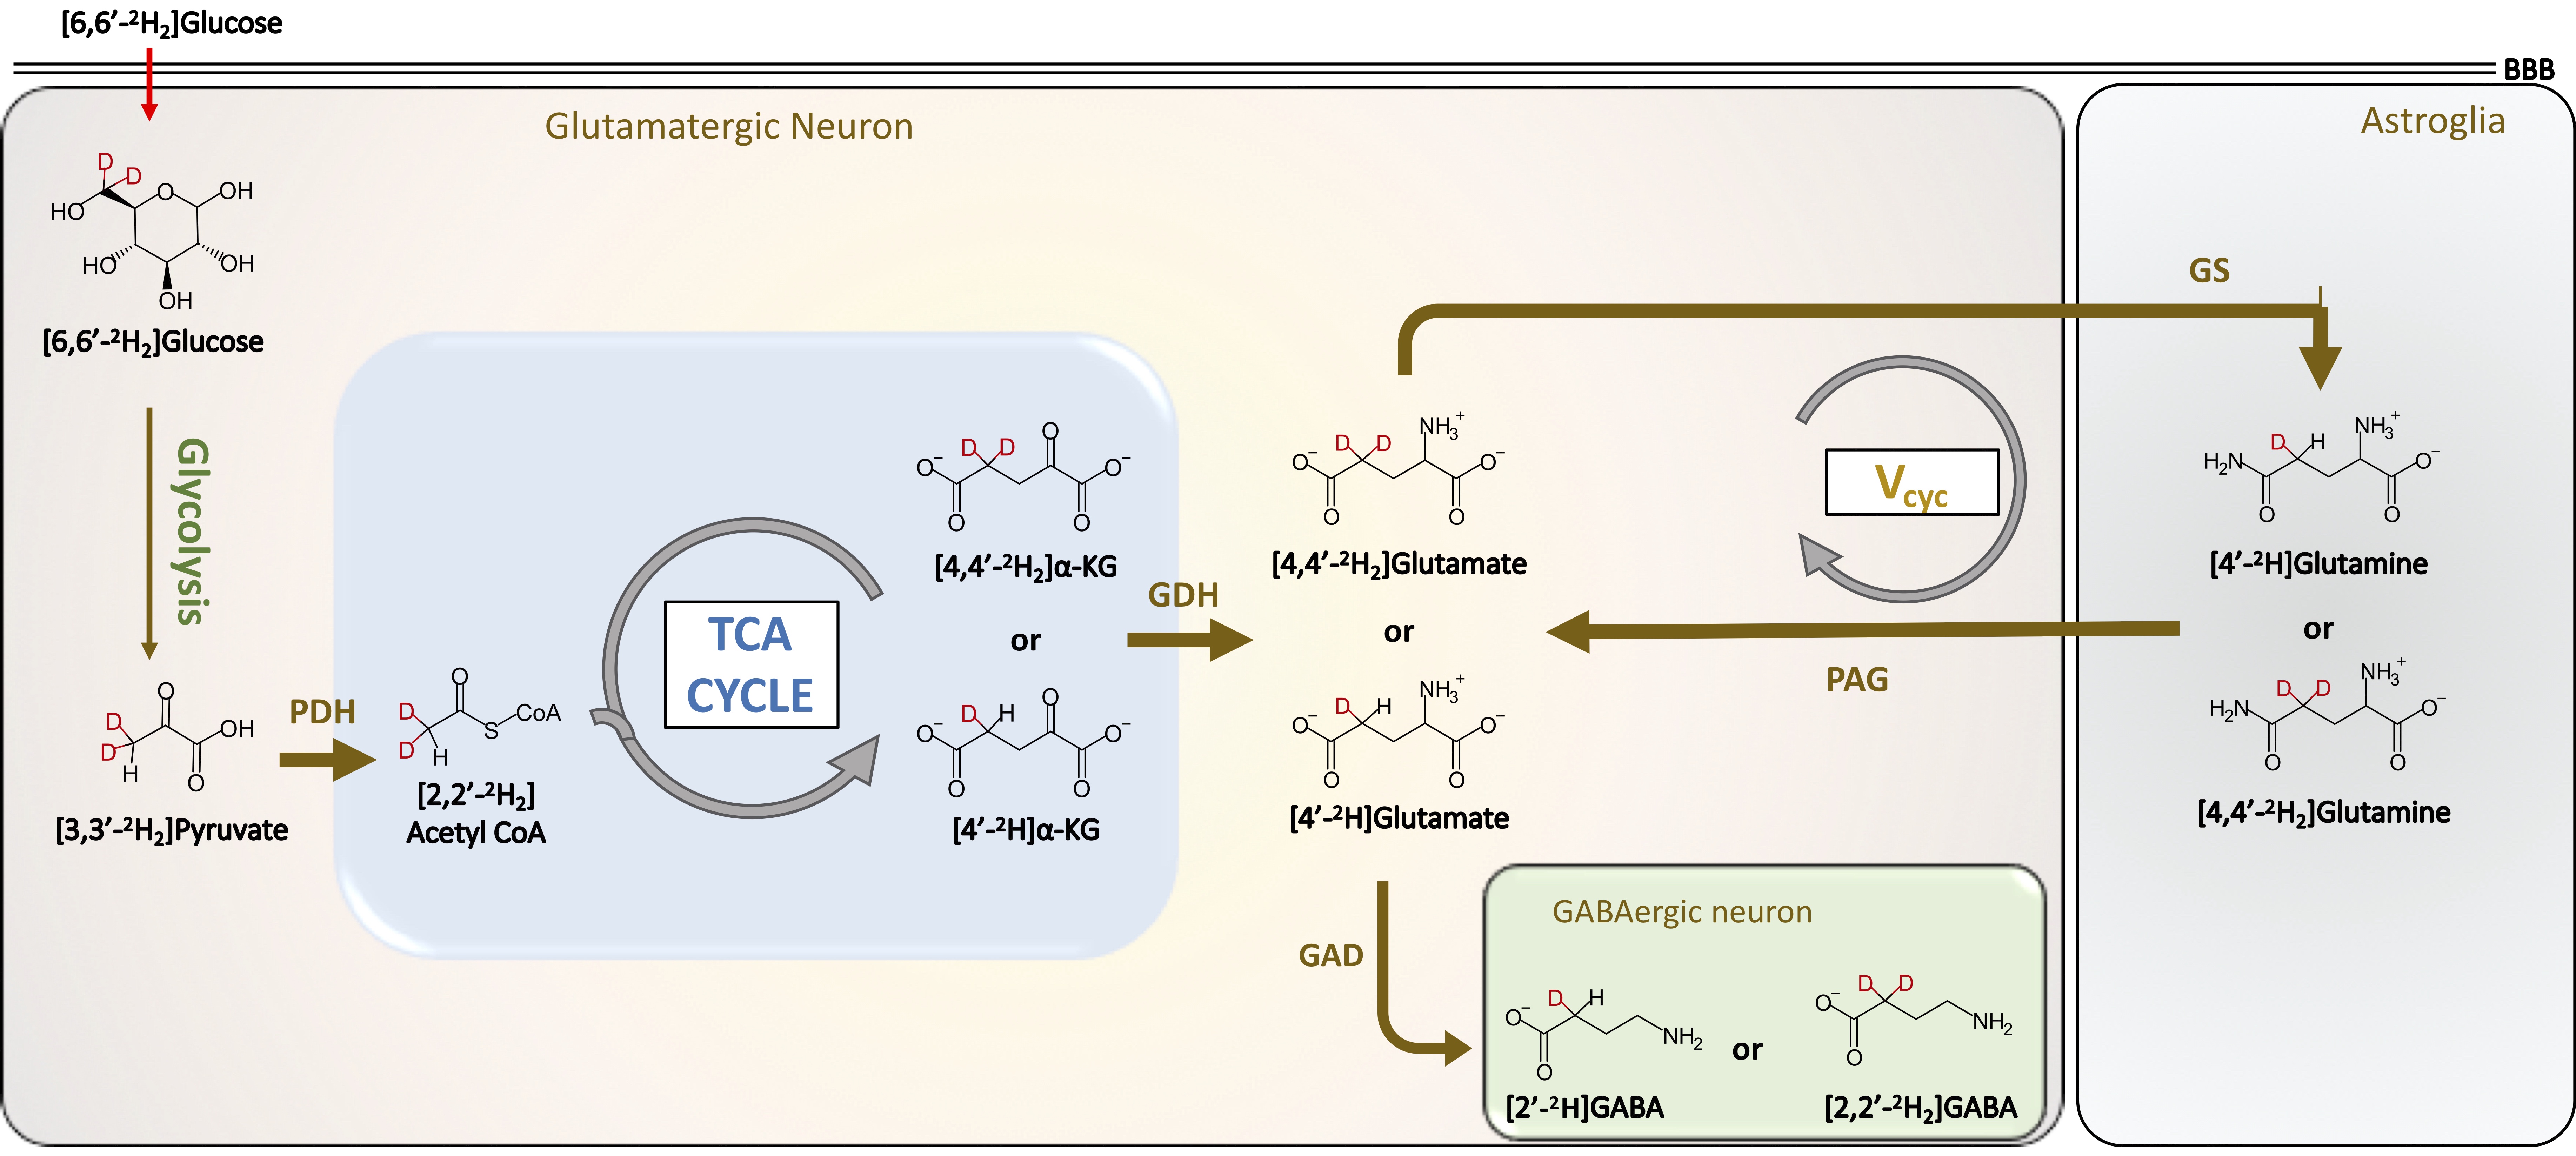
13C and 2H magnetic resonance spectroscopy (MRS) in conjunction with administration of 13C/2H-labeled substrates have provided great insights into cerebral energetics and neurotransmitter cycling1-4. Here we present a novel strategy, which combines the administration of [6,6′-2H2]glucose and 1H MRS to measure cerebral energetics. Glucose is majorly taken up by neuronal cells in the brain, where it is metabolized to pyruvate via glycolysis. Pyruvate is converted into acetyl-CoA by pyruvate dehydrogenase, acetyl-CoA combines with oxaloacetate to enter the TCA cycle to form a-ketoglutarate and glutamate (Figure 1). Following the neuronal action potential firing, extracellular glutamate is taken up by astroglial cells where it is converted into glutamine by glutamine synthetase (GS). Glutamine is transferred to neurons to replenish the neuronal glutamate pool by conversion of neuronal glutamine into glutamate by the action of phosphate-activated glutaminase (PAG) thereby completing the glutamate-glutamine neurotransmitter cycling. The administration of [6,6′-2H2]glucose into the bloodstream followed by the neuronal uptake leads to the transfer of 1H MR invisible 2H into downstream metabolites including glutamate, glutamine, GABA, and aspartate (Figure 1). The detection of exchanged label turnover quantitative measurement (ELOQUENT) by 1H MRS (eMRS) has given rise to a novel approach for measuring cellular energetics in vivo. The ability to quantify the metabolites and high spectral resolution offered by 1H MRS enables the monitoring of kinetics of label transfer into crucial metabolites. In the current abstract, we demonstrate the application of eMRS as a promising novel alternative approach to multinuclear MRS studies to determine cerebral energetics in vivo.Methods
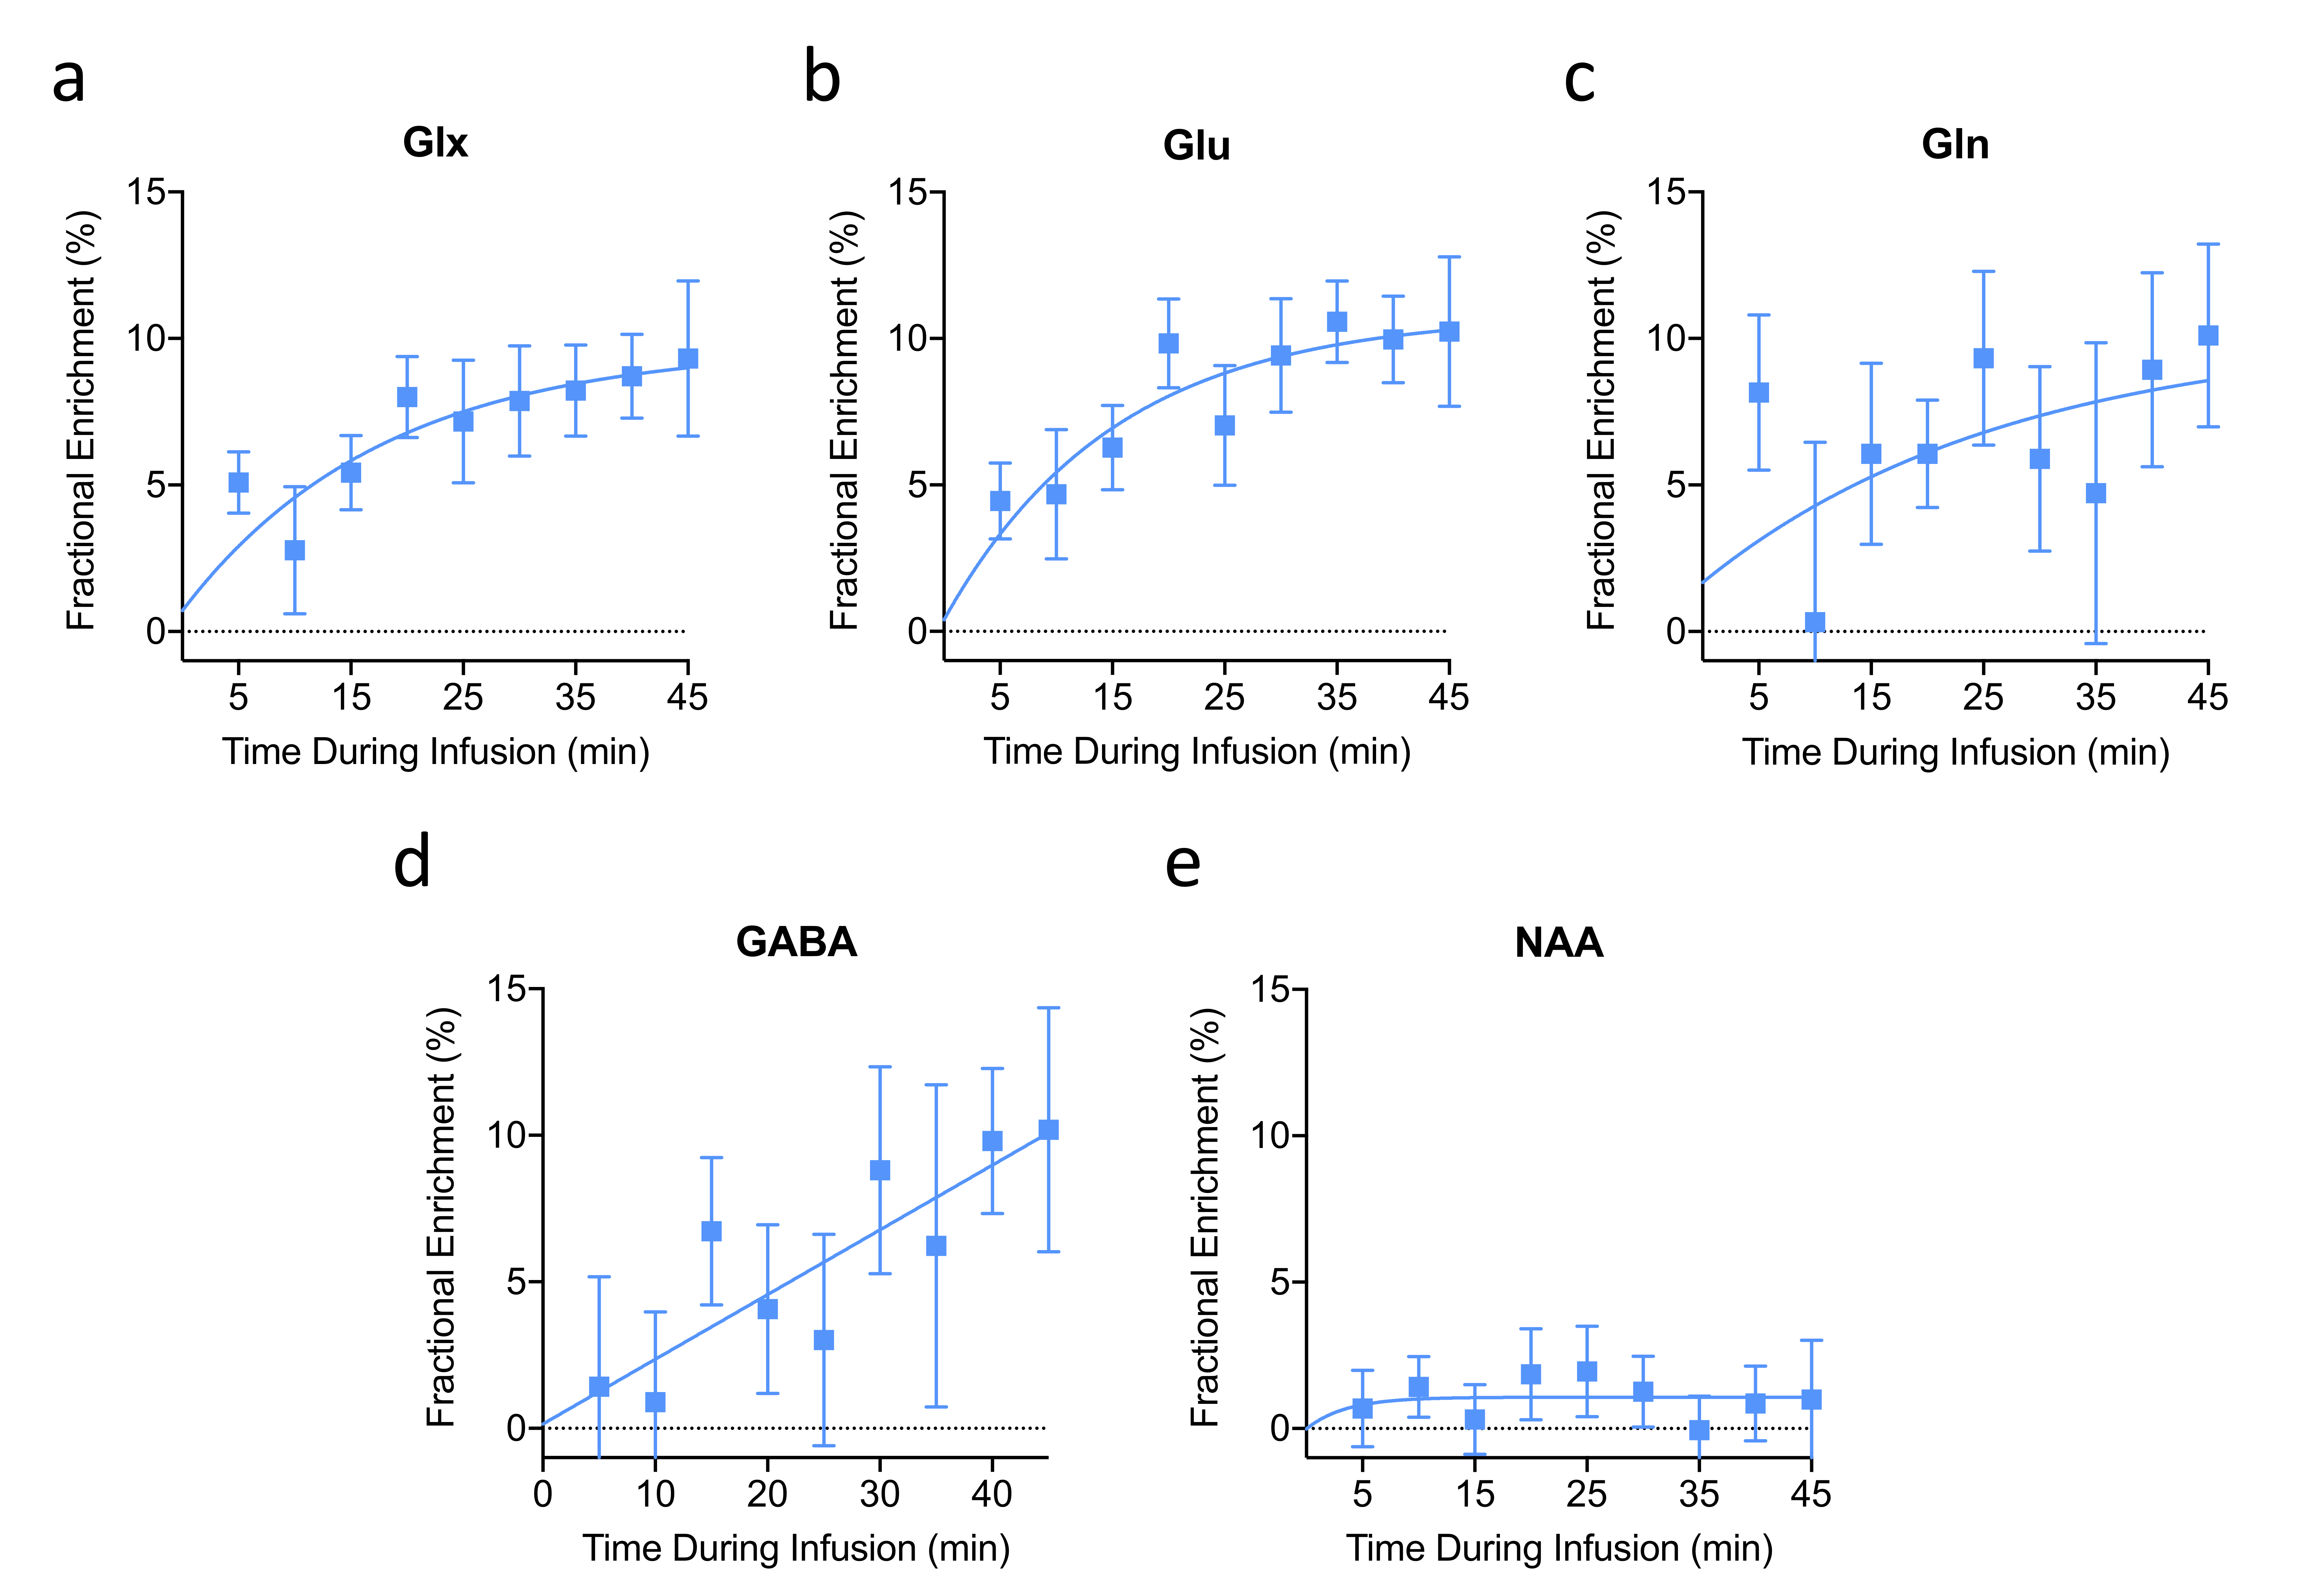
MR experiments on six 3-4-month old male CDF rats (220-250 g) were performed on a 9.4T Bruker scanner using a 35-mm diameter volume coil. Body temperature and respiration rates and monitored and maintained at 37 °C and 40-60 BPM, respectively. 1H MRS spectra were acquired from a voxel localized in the mid-brain using PRESS (TR/TE = 2500/16 ms, spectral width = 4 kHz, 90° pulse bandwidth = 5400 Hz, 180° pulse bandwidth = 2400 Hz, number of points = 4006, VAPOR water suppression, averages=128, scan time = 5.5 min). In addition to the water suppressed spectrum, another spectrum with 4 averages was acquired without water suppression to obtain the water reference signal for normalization. Following the pre-injection 1H MRS scan, the rats were intravenously injected with [6,6′-2H2]glucose for 10 min via infusion pump using an infusion protocol as described previously. During and post-[6,6′-2H2]glucose administration, a series of 1H MR spectra were gathered until 60 minutes. Metabolites were quantified using LCModel software5. Once metabolite concentration at each time point was estimated, the calculation of metabolite fractional enrichment (FE) was performed by subtracting post-infusion levels from pre-infusion levels. All FE plots report mean values with the standard error of the mean. Fitted curves for FE plots were generated to provide a visual aid of labeling using the following exponential plateau equation, Y = YM-(YM-Y0)exp(-kx), where Y0 is the starting population, YM is the maximum population, and k is the rate constant.Results and Discussion
Subtraction of the 90-minute post-infusion of [6,6′-2H2]glucose 1H MRS spectrum from the pre-infusion spectrum revealed a marked increase in the Glu-H4 resonance demonstrating the feasibility of eMRS (Figure 2). In addition, other resonances including Gln-H4, GABA-H2, Glx-H3, Asp-H3, and Lac-H3 were observed, all of which were well above background levels. Quantification of the Glx FE (Figure 3A) revealed a gradual increase and eventual plateau during infusion, with ~9% FE at 45 min post-infusion. Importantly, eMRS enabled individual quantification of changes in Glu (Figure 3B) and Gln (Figure 3C) levels, with an ~11% FE in Glu and ~8% FE in Gln observed 45 min post [6,6′-2H2]glucose infusion. FE of GABA (Figure 3D) at 45 min was estimated to be with ~10%. Further, N-acetyl aspartate (NAA) was found to be unaltered during the course of the infusion (Figure 3E). The turnover curves of Glu, Gln and GABA are similar in regards to cerebral neurotransmitter energetics and kinetics previously reported using 13C MRS6,7. The estimation of the rates of glutamatergic, GABAergic and glial TCA cycles in addition to neurotransmitter cycling (glutamatergic and GABAergic) via eMRS experiments is currently ongoing. We anticipate these results would compare well with the values already reported in the literature. This approach is expected to enable a wide range of studies probing metabolic derangements in vivo across medical disciplines.Acknowledgements
This project was supported by the National Institute of Biomedical Imaging and Bioengineering of the National Institute of Health under award number P41EB015893.References
1. Shulman, R. G., & Rothman, D. L. 13C NMR of intermediary metabolism: implications for systemic physiology. Ann. Rev. Phys. 63, 15-48 (2001)
2. Henry, P. G., et al. In vivo 13C NMR spectroscopy and metabolic modeling in the brain: a practical perspective. Magn. Reson. Imaging, 24, 527-539 (2006)
3. Lu, M., Zhu, X. H., Zhang, Y., Mateescu, G. & Chen, W. Quantitative assessment of brain glucose metabolic rates using in vivo deuterium magnetic resonance spectroscopy. J. Cereb. Blood Flow Metab. 37, 3518-3530 (2017)
4. De Feyter, H. M. et al. Deuterium metabolic imaging (DMI) for MRI-based 3D mapping of metabolism in vivo. Sci. Adv. 4, eaat7314 (2018)
5. Provencher, S. W. Automatic quantitation of localized in vivo 1H spectra with LCModel. NMR Biomed. 14, 260-264 (2001)
6. De Graaf, R. A., Mason, G. F., Patel, A. B., Behar, K. L. & Rothman, D. L. In vivo 1H-[13C]-NMR spectroscopy of cerebral metabolism. NMR Biomed. 16, 339-357 (2003)
7. van Eijsden, P., Behar, K. L., Mason, G. F., Braun, K. P., & De Graaf, R. A. In vivo neurochemical profiling of rat brain by 1H‐[13C] NMR spectroscopy: cerebral energetics and glutamatergic/GABAergic neurotransmission. J. Neurochem. 112, 24-33 (2010)
Figures