0901
3D Magnetic Resonance Fingerprinting with Quadratic Phase in Mouse Brain on Preclinical 7T System1Metrohealth Hospital, Cleveland, OH, United States, 2Case Western Reserve University, Cleveland, OH, United States, 3Cleveland Clinic, Cleveland, OH, United States
Synopsis
Magnetic Resonance Fingerprinting with Quadratic Phase (qRF-MRF) was previously validated in 2D clinical imaging for simultaneous off-resonance, T1, T2, and T2* mapping. Translation of qRF-MRF to high-field preclinical systems for small animal imaging is challenging due to the higher field inhomogeneity and the higher spatial resolution required. Here, a 3D qRF-MRF method was explored to address these challenges. High-resolution simultaneous mapping of off-resonance, T1, T2, and T2* on in vivo mouse brain at 7T was demonstrated. Computational limitations for large dictionary parameter space and reconstruction times were addressed using randomized SVD time compression and quadratic fitting methods.
Introduction
MRI has been widely used in preclinical investigations employing animal models to study human diseases. For example, iron nanoparticle labeled transgenic mouse models has been used to delineate the progression of multiple sclerosis1. Multi-parametric quantitative MR methods enables comprehensive characterization of these models. Magnetic resonance fingerprinting (MRF) has been developed to map multiple tissue properties and system properties rapidly. Previously, a 2D MRF with quadratic RF phase (qRF-MRF) method was developed and validated on clinical systems to map off-resonance (ΔB0), T1, T2, and T2* simultaneously2. Translating this method to high-field preclinical imaging is nontrivial due to additional challenges such as higher imaging resolution, lower SNR, larger field inhomogeneity, and physiological noise. In particular, the large field inhomogeneity at high-field can mask the subtle differences in intrinsic tissue T2*. To overcome these challenges, we aimed to develop a 3D approach for preclinical imaging of mouse brain at 7T. The computational challenge of extending the qRF-MRF method to 3D was explored previously3. In this work, time compression by randomized singular value decomposition (rSVD)4 and tissue property compression by quadratic fit5 were used to reduce computation time. Further, the qRF-MRF sequence parameters were tailored for improve sensitivity to tissue parameters at high-field. Quantitative T1, T2, ΔB0 and T2* maps were obtained from in vivo mouse brain and compared to literature values.Methods
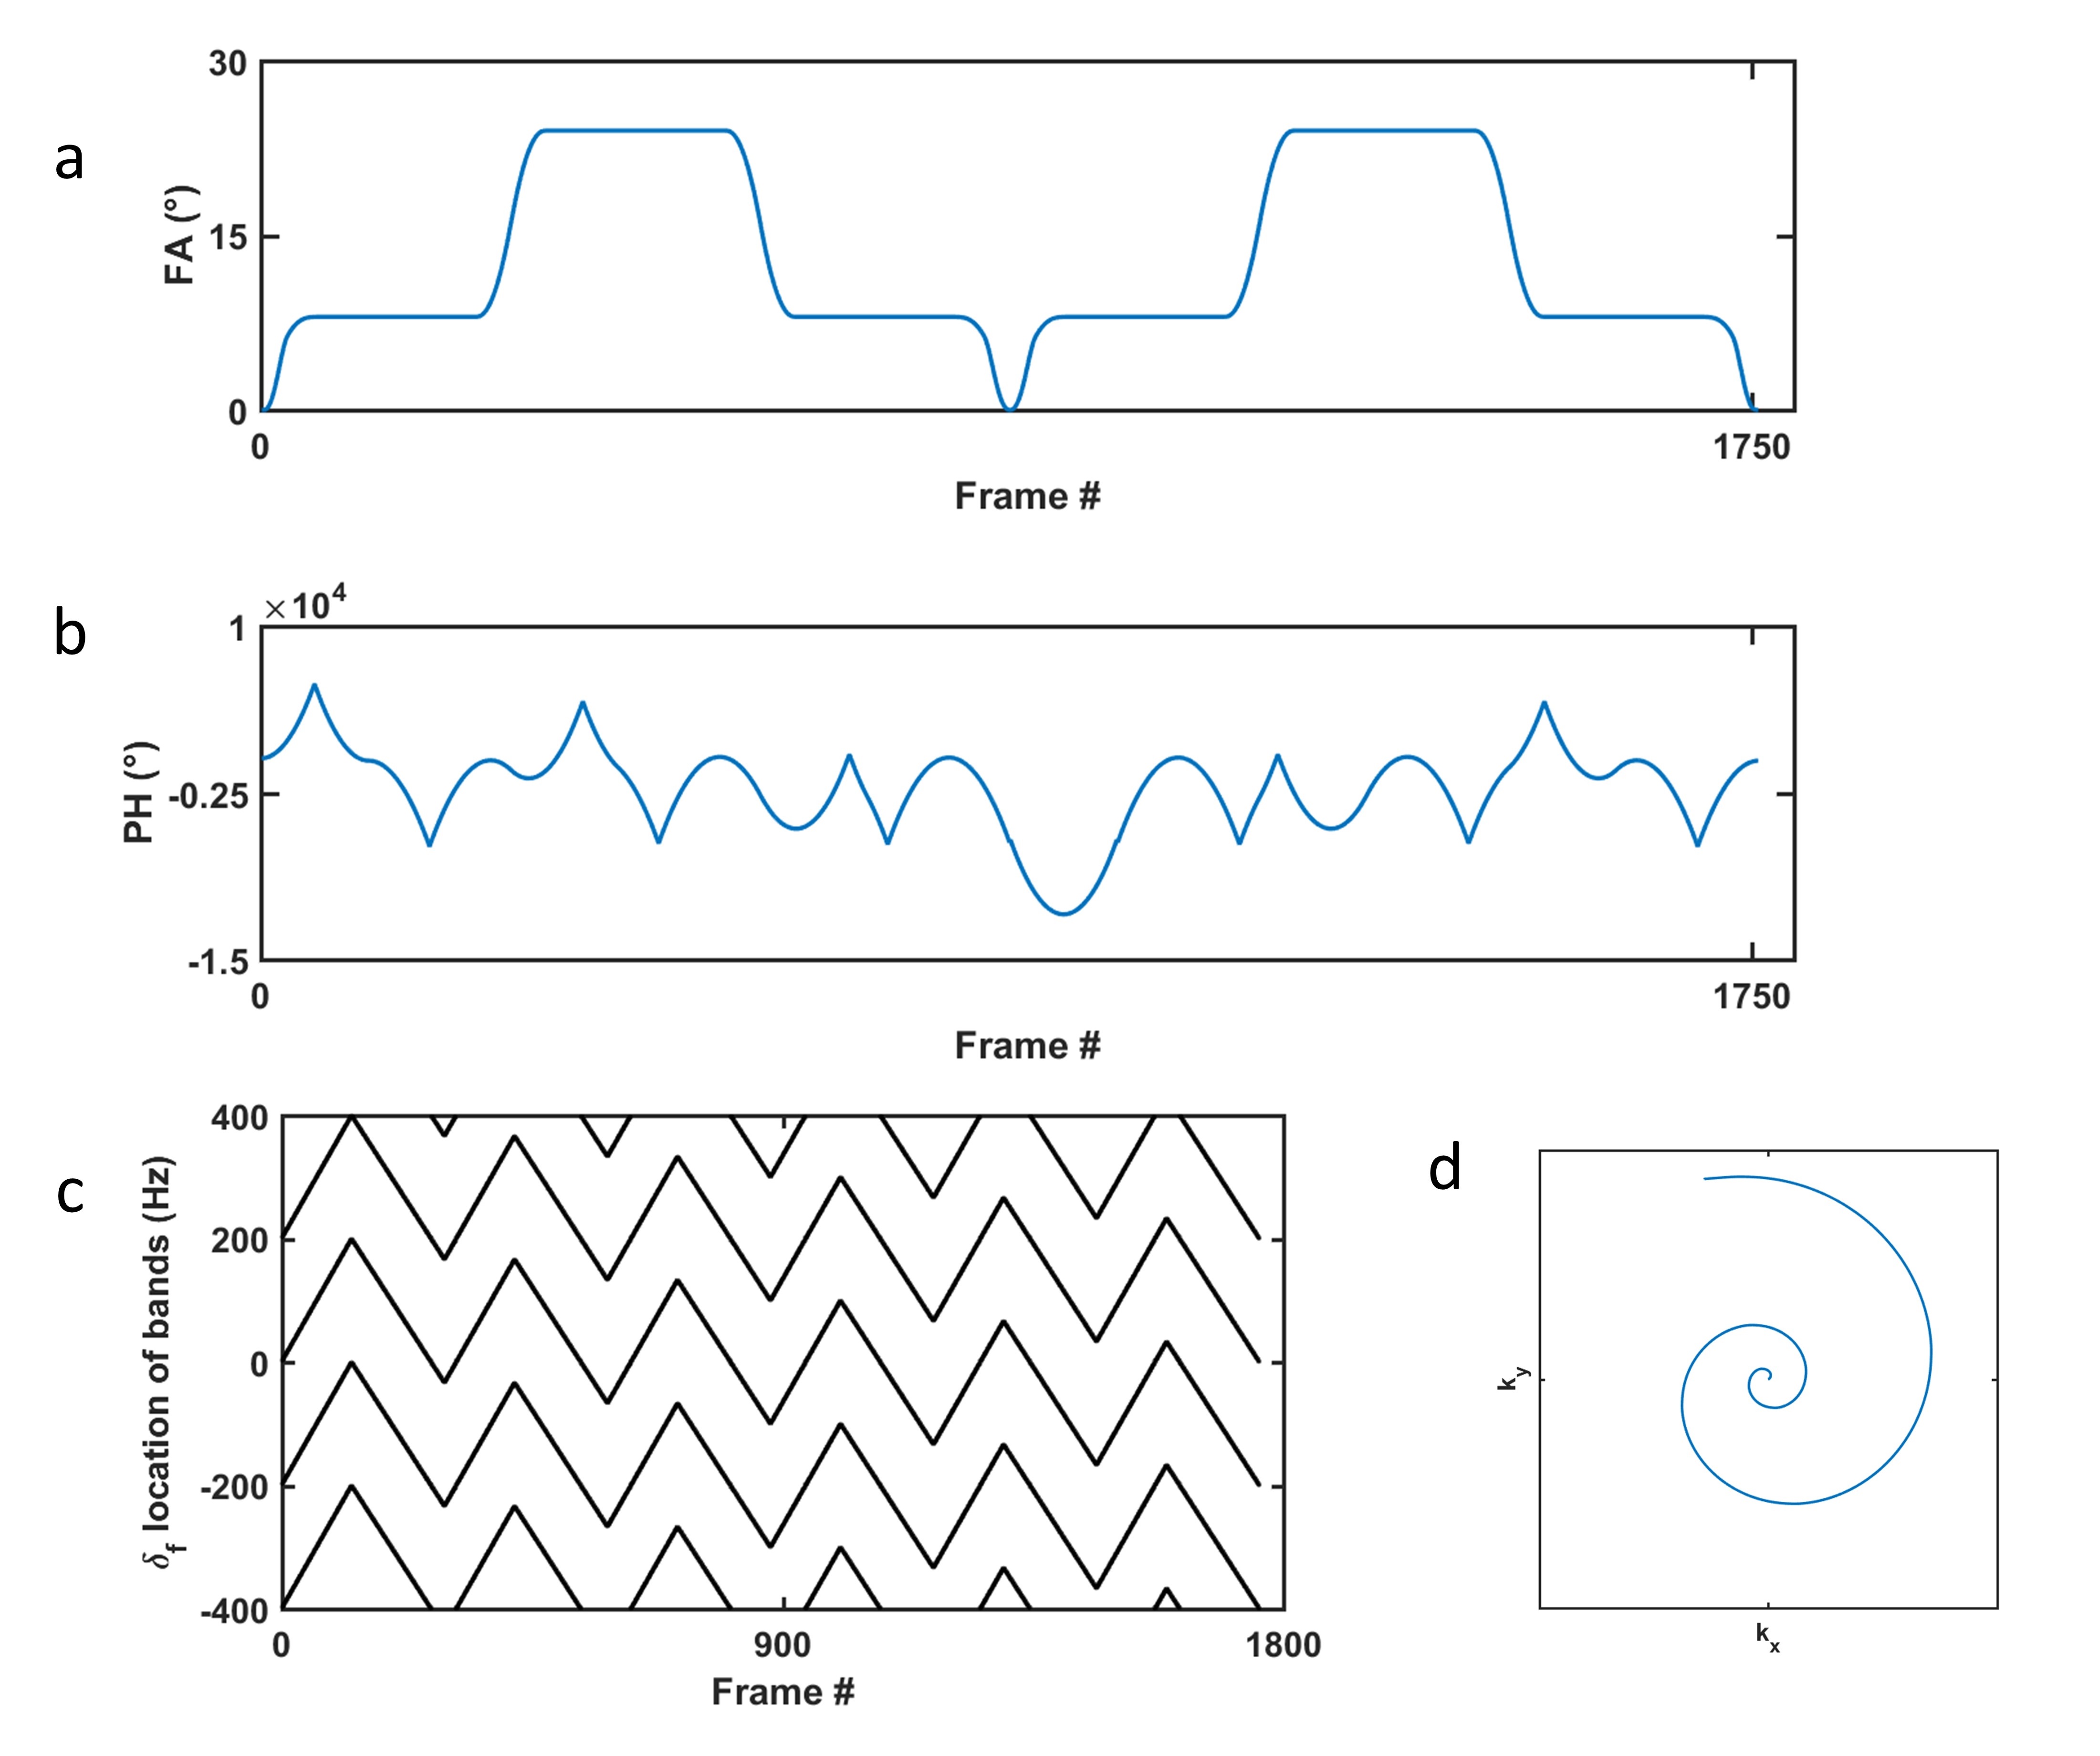
The 3D preclinical qRF-MRF pulse sequence and sequence parameters are shown in Figure 1. 1758 imaging frames were acquired. Two inversion pulses were implemented at the beginning and middle of the sequence for enhanced T1 sensitivity. A relatively low flip angle (FA) was used in each imaging frame to reduce SAR and improve excitation profile homogeneity (Fig. 1a). RF phase was continuously varied in a quadratic approach (Fig. 1b), resulting in the resonance band response shown in Figure 1c. A constant TR of 5 ms was used for all frames. 3D spatial encoding was performed using a stack-of-spirals sampling pattern6. In-plane spatial encoding used variable density spiral trajectories that required 48 and 12 interleaves to fully sample the peripheral and center of k-space, respectively (Fig. 1c). 192 repetitions were acquired, each with a different combination of rotated in-plane spiral trajectories and 16 phase-encoding steps, to cover an FOV of 20x20x8 mm3. This acquisition scheme achieved a nominal spatial resolution of 156x156x500 μm. Each repetition required 8.8 s, with a 2 s delay allowed for partial magnetization recovery. Total acquisition time was 35 min. Prior to reconstruction, both data and target dictionary were compressed to rank 200 from 1758 time points. As was shown previously3, the truncation matrix was calculated with rSVD of a coarse dictionary that spanned the expected range of physiologic ΔB0, T1, T2, and intravoxel field dispersion (Γ) values. Following tissue property matching with this coarse dictionary, high resolution dictionary tissue property (in the tissue property dimension) matches were recovered with interpolation with the previously proposed quadratic fit method. Here, the inner product values of the closest dictionary entries in the tissue property space with the set of correct tissue properties are known to form a quadratic curve. The neighboring entries in each of the four tissue property dimensions (81 combinations in total) were fit in a quadratic function and the maximum along the fitted curve was taken as the new match. The 3D qRF-MRF was tested on mouse brain, and ROIs were compared to literature values of mouse brain at 7T.Results
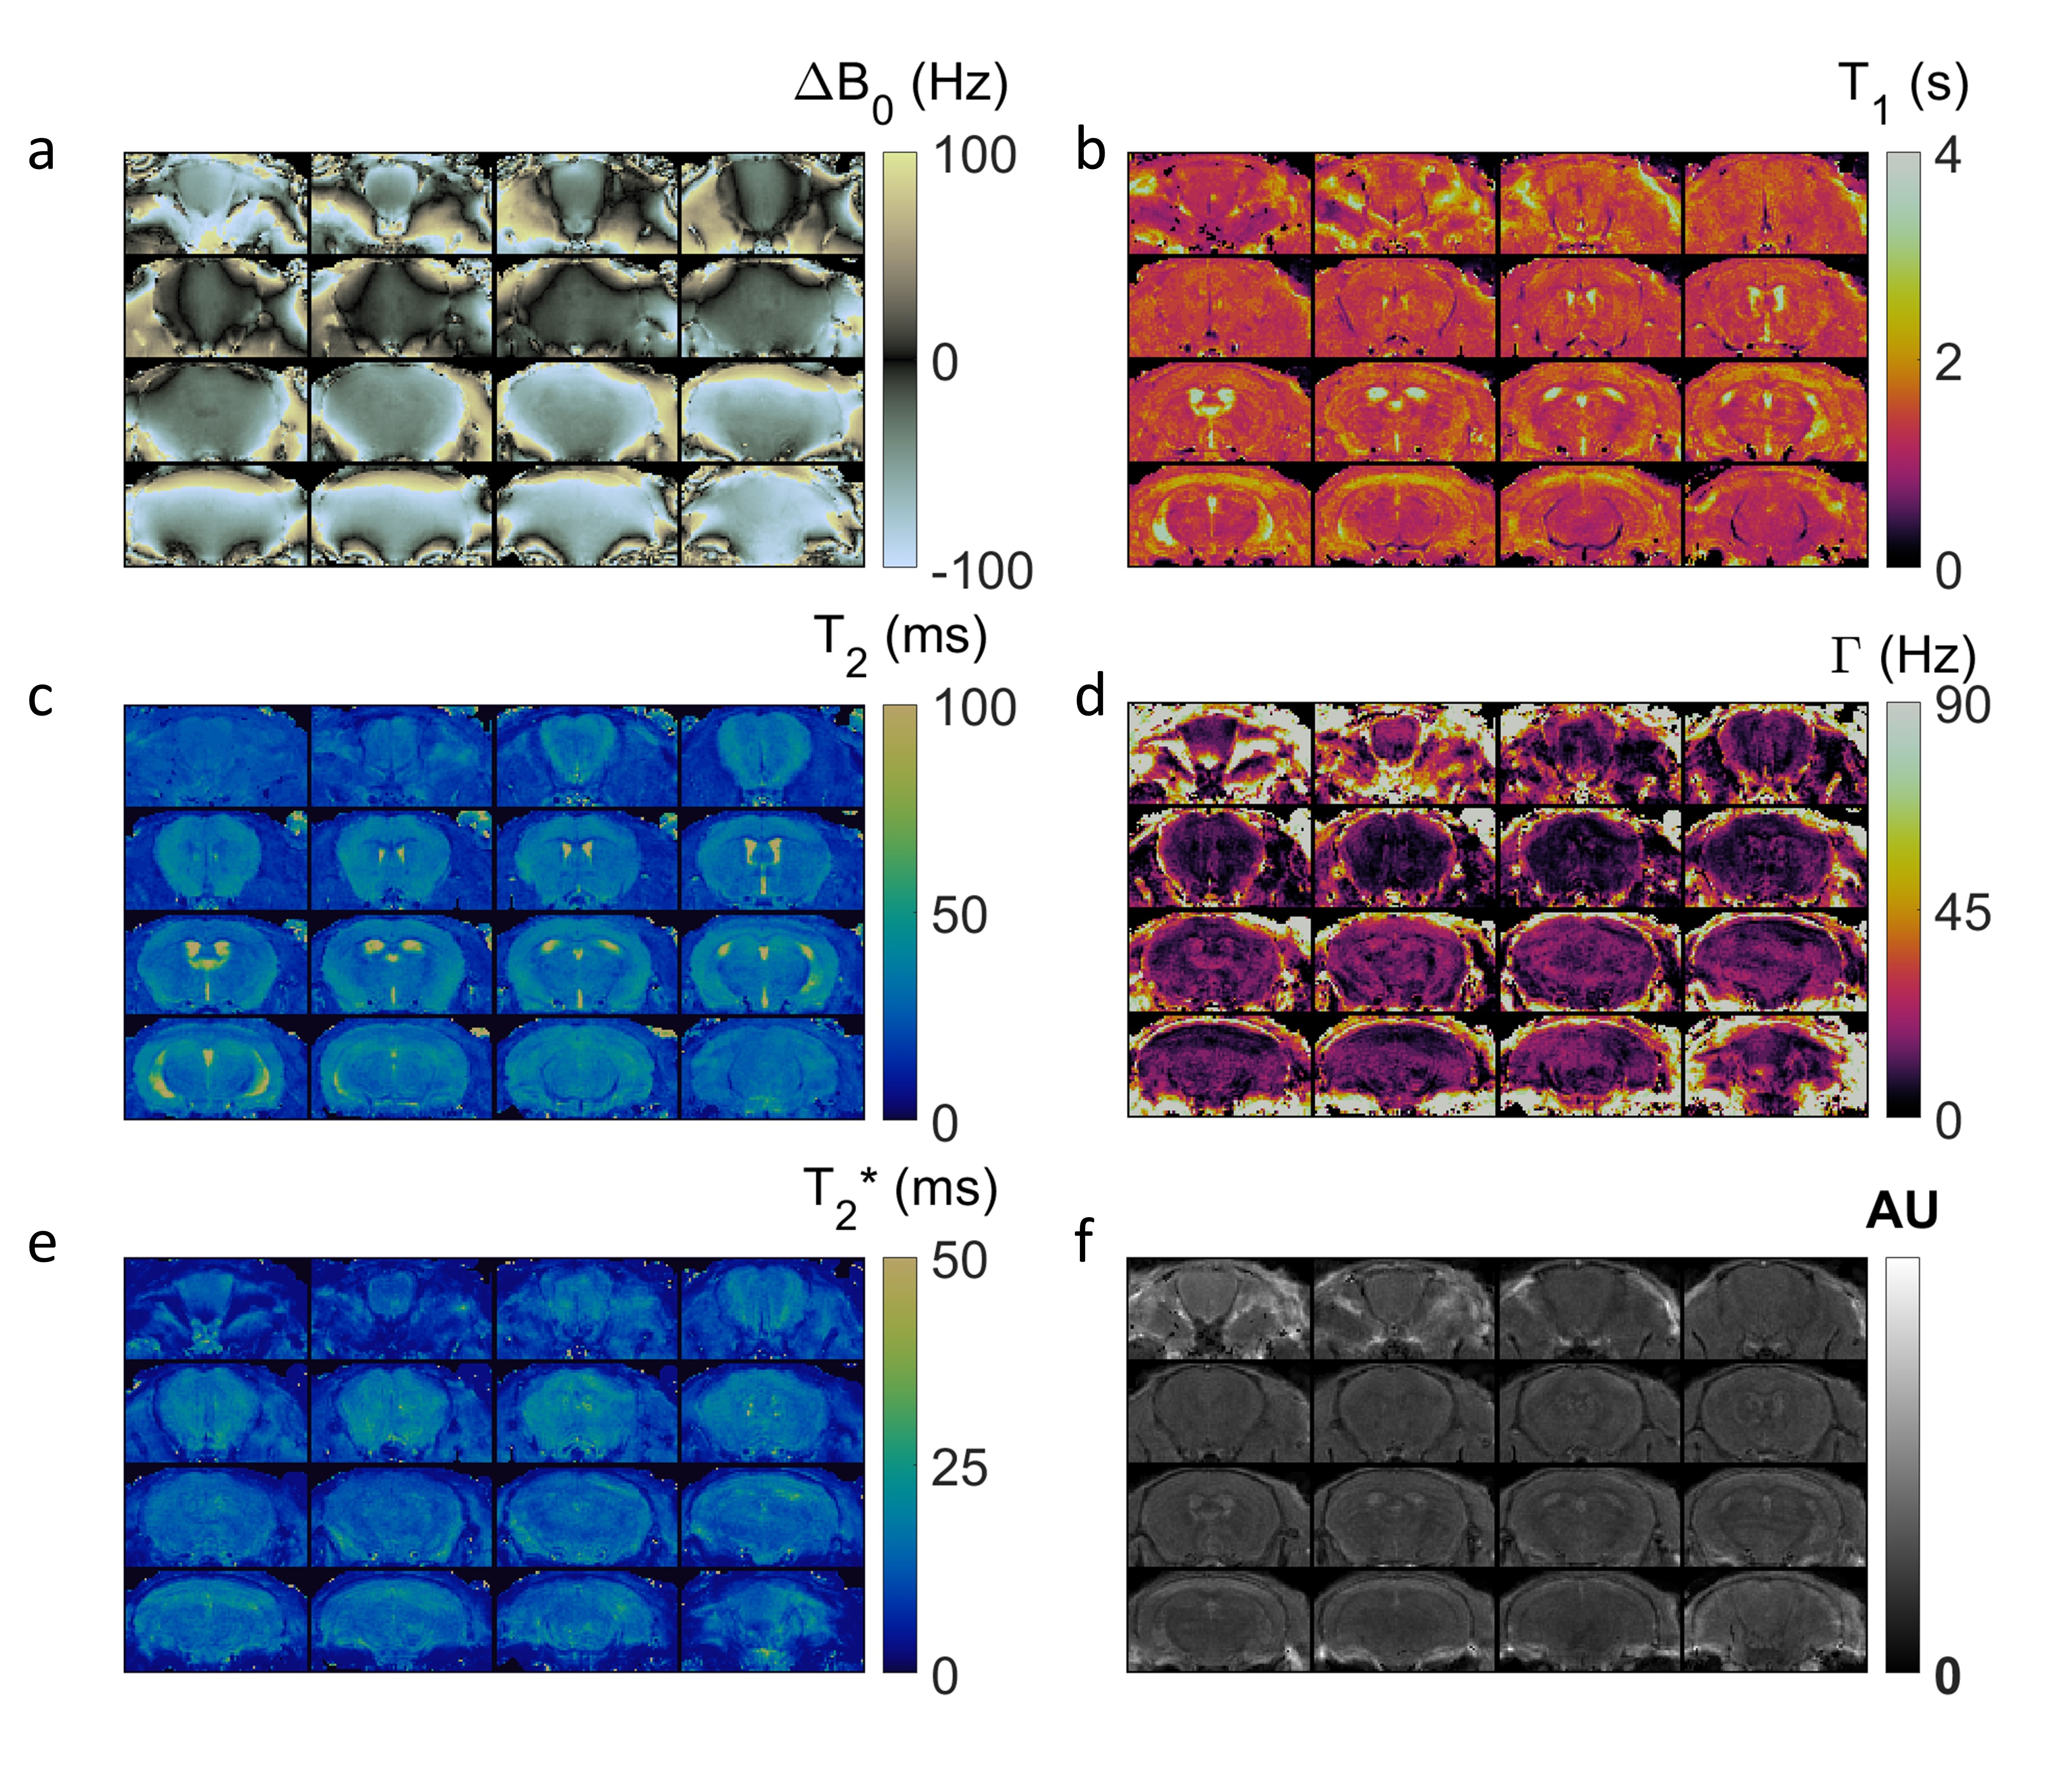
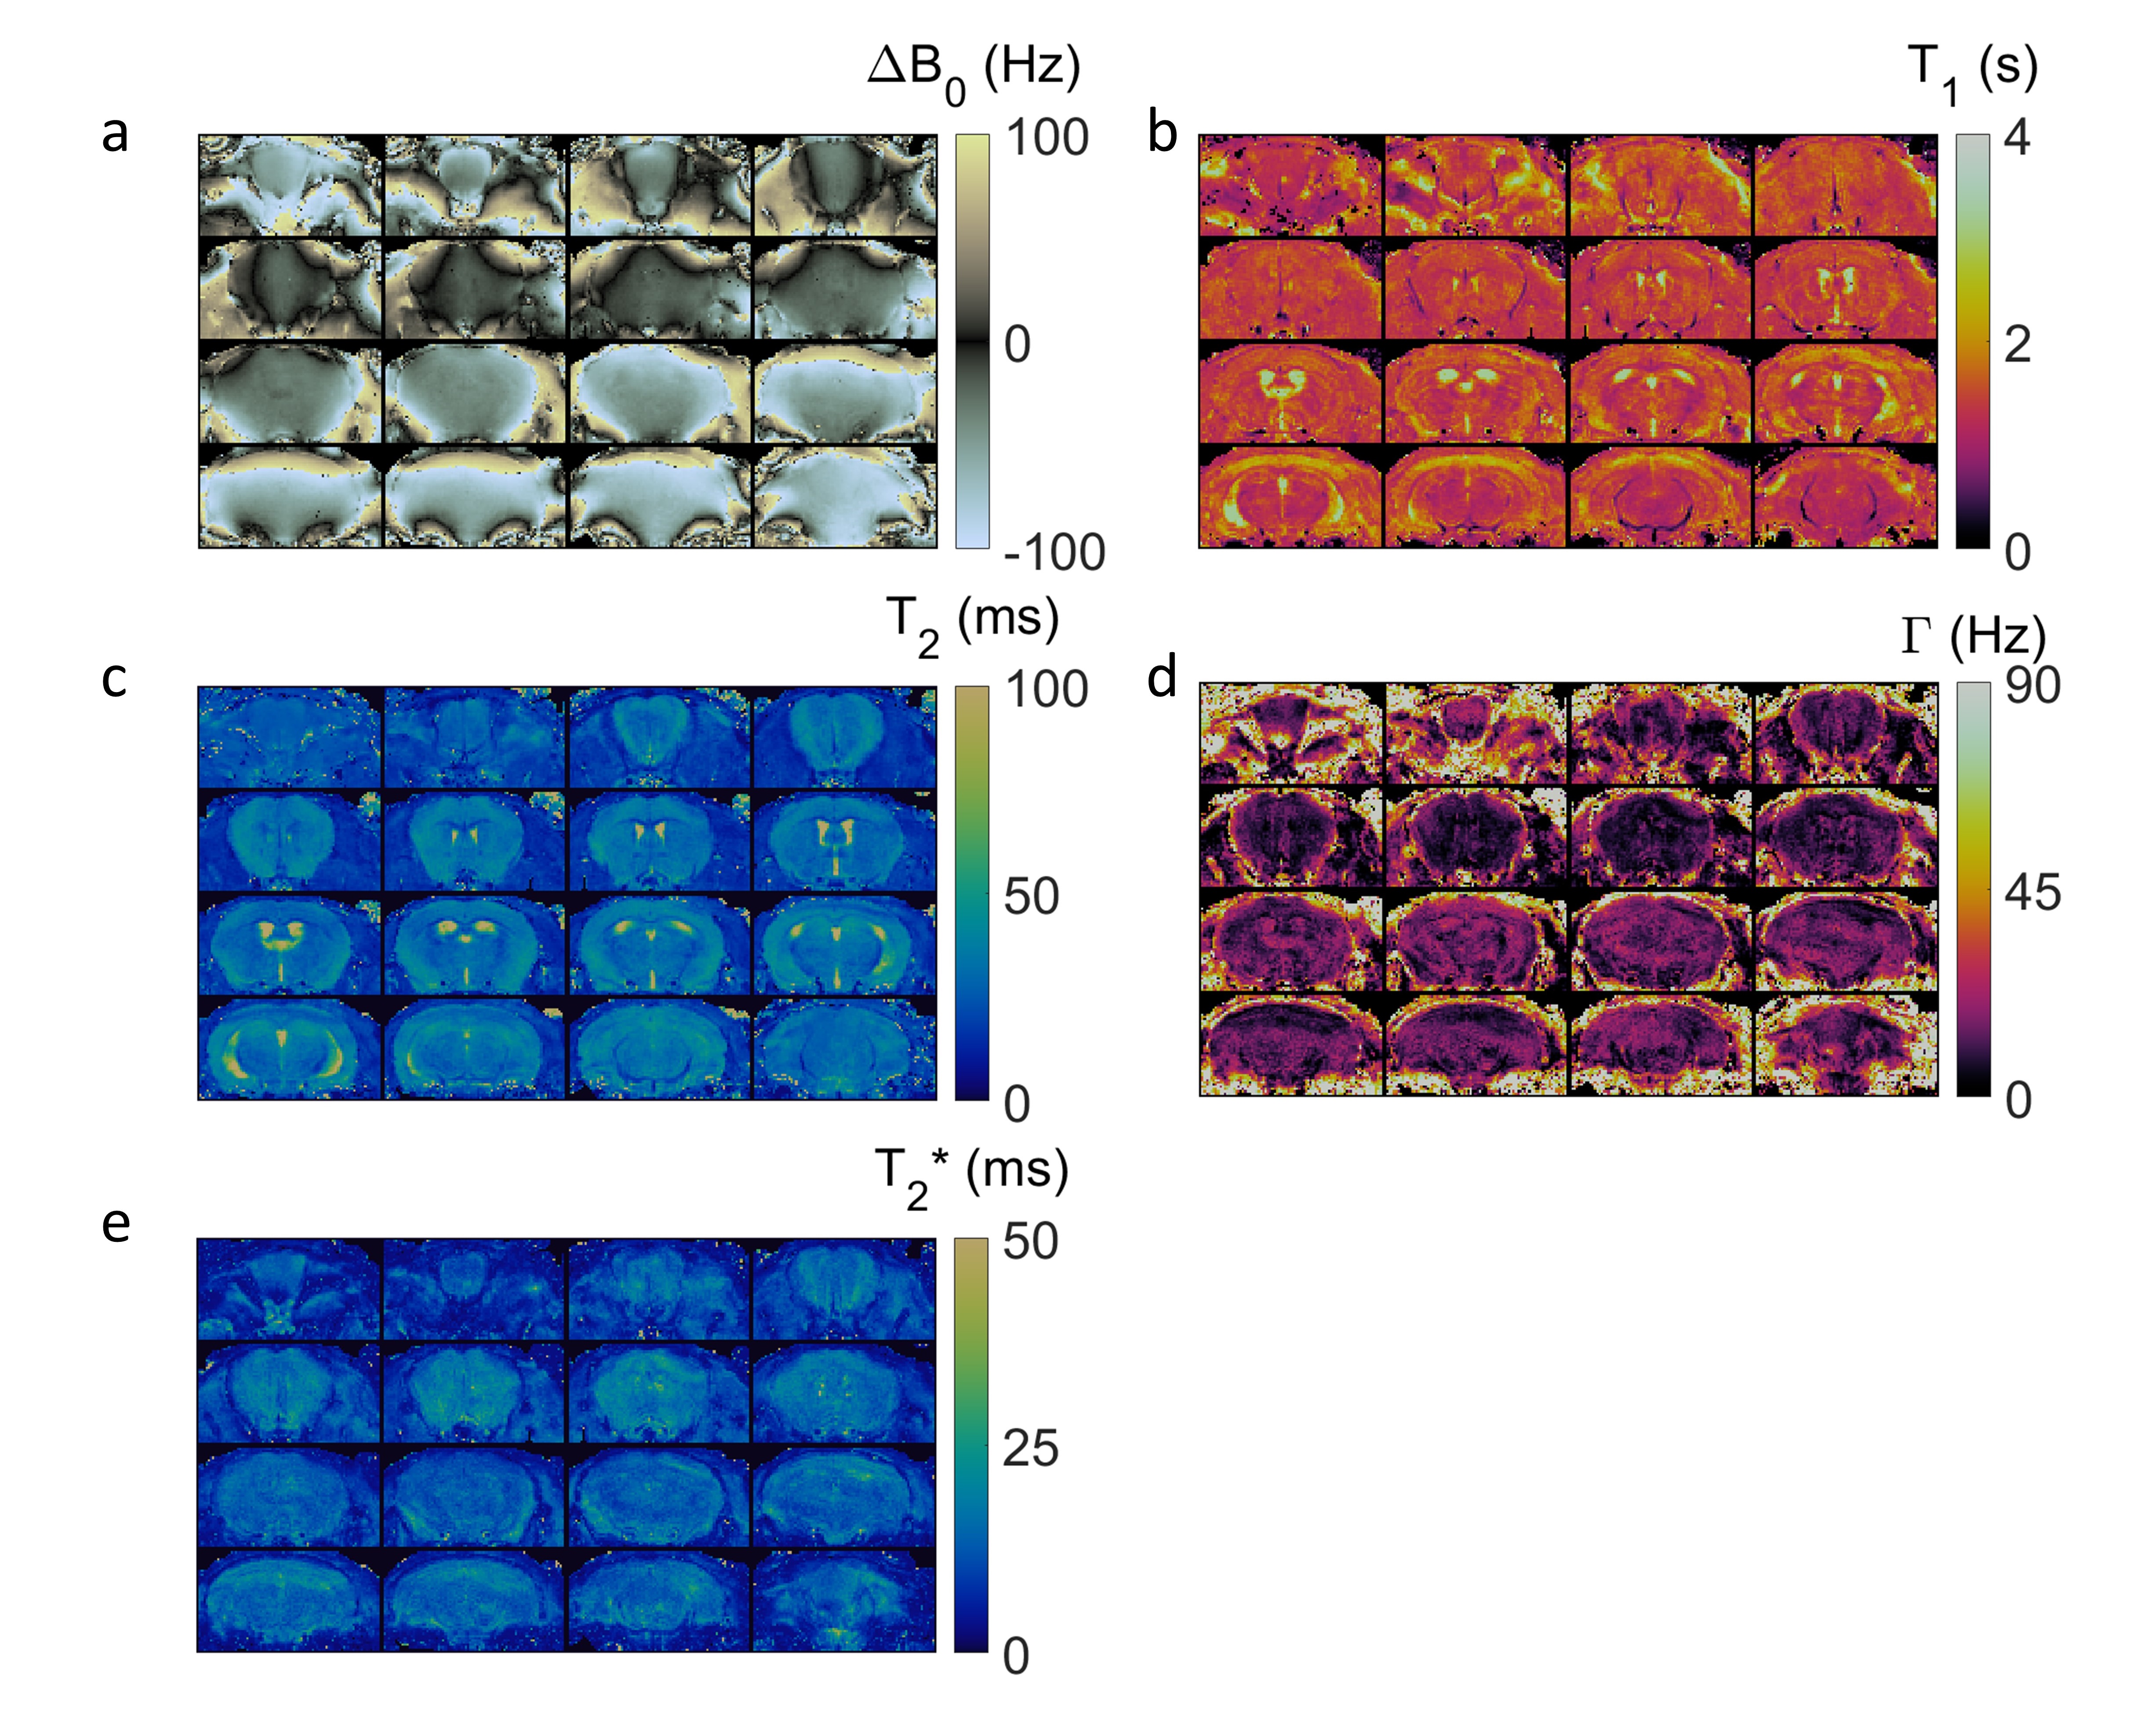
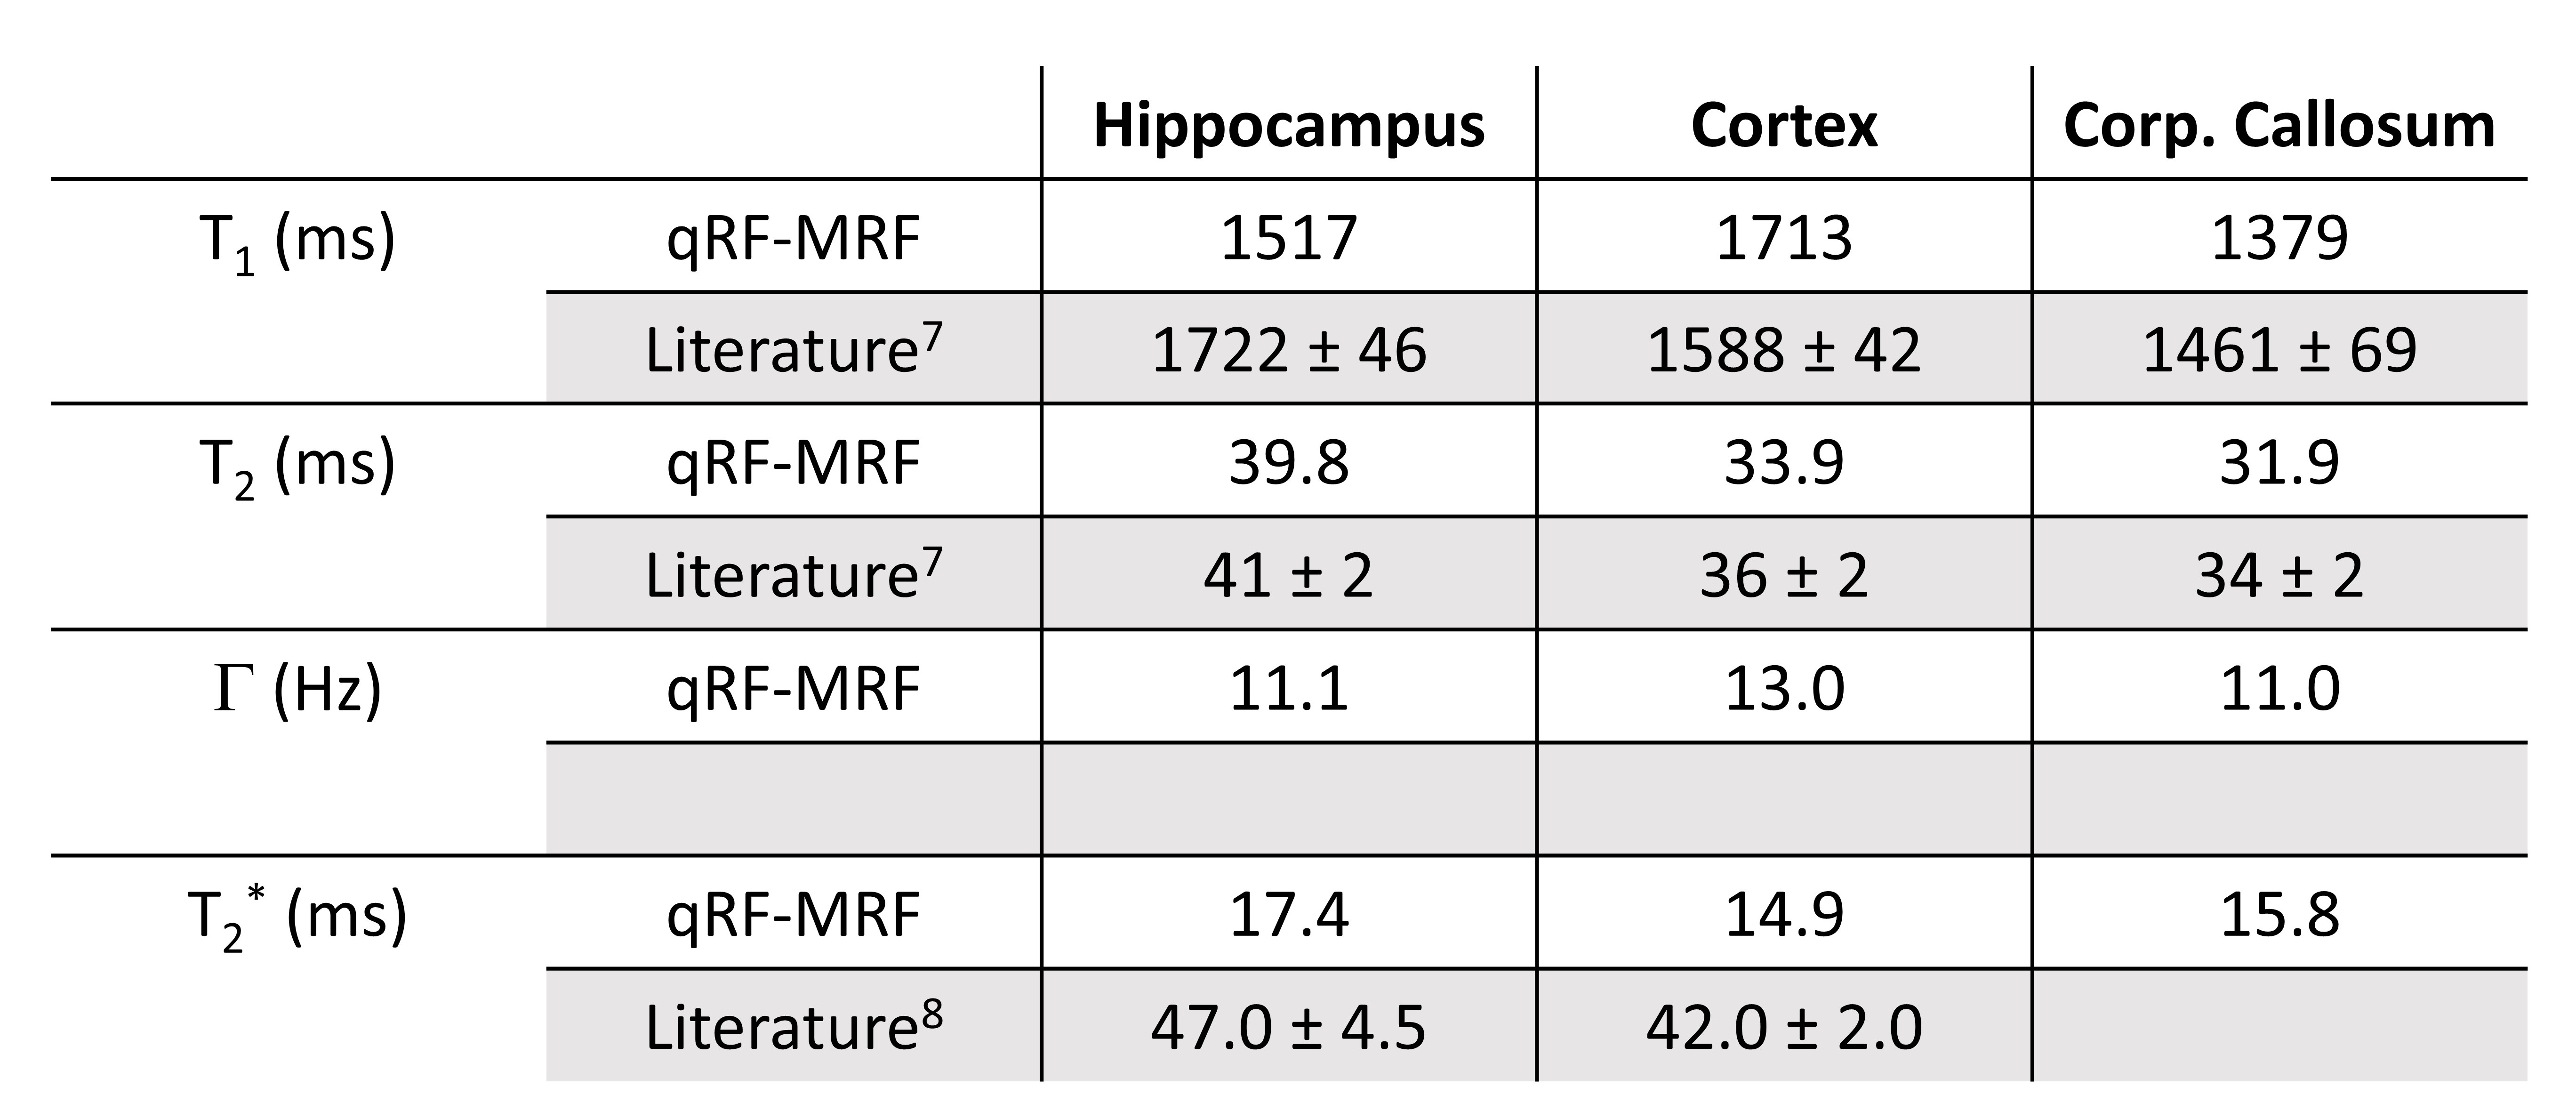
Coarse dictionary match generated in vivo ΔB0, T1, T2, Γ maps from 3D qRF-MRF are shown in Figure 2a-d. T2* calculated from matched T2 and Γ are shown in Figure 2e. Additionally, the relative M0 map from the coarse dictionary match is included (Fig. 2f). Corresponding matches with high parameter resolution after quadratic fit are shown in Fig. 3. Consistent with prior qRF-MRF implementations, parameter mapping in mouse brain using 3D qRF-MRF showed robust ΔB0 mapping. The increased field inhomogeneity at 7T is also evident, particularly near the auditory canals and sinuses due to the susceptibility effects at air-tissue boundaries. Average matching values from manually drawn ROIs are shown compared with literature values in Table 1. While T1 and T2 showed good agreement with the literature, T2* was significantly shorter. This discrepancy might be due to the 3-fold difference in voxel size between our current study and the study published in literature. Experimental conditions may have also contributed to this disagreement as the T2* values reported in literature were significantly longer than T2 values reported in other studies performed at the same field strength.Discussion and Conclusion
An initial implementation of a 3D qRF-MRF method for simultaneous mapping of T1, T2, off-resonance and T2* on preclinical high-field system was explored. The method can be further improved by increasing the spatial resolution to further reduce the effect of high background field inhomogeneity masking the underlying intrinsic T2*. Additionally, the current method requires long acquisition time as the substantial undersampling potential seen from prior 3D MRF methods (such as 144 fold6) have not yet been fully explored. High resolution 3D qRF-MRF mapping would be a valuable tool to study the vast array of preclinical animal models of human disease and their treatments.Acknowledgements
This work was supported in part by a grant from NIH (R01-EB023704).References
1. Nathoo N, Yong V, Dunn J. Understanding disease processes in multiple sclerosis through magnetic resonance imaging studies in animal models. NeuroImage Clin. 2014 4:743-756.
2. Wang C, Coppo S, Mehta B, et al. Magnetic resonance fingerprinting with quadratic RF phase for measurement of T2* simultaneously with δf, T1, and T2. Magn. Reson. Med. 2019 81: 1849– 1862.
3. Boyacioglu R, Wang C, Ma D, et al. 3D Magnetic Resonance Fingerprinting with Quadratic RF Phase. 27th annual ISMRM Proceedings, Montreal (2019).
4. Yang M, Ma D, Jiang Y, et al. Low rank approximation methods for MR fingerprinting with large scale dictionaries. Magn Reson Med. 2018 79(4):2392-2400.
5. McGivney D, Boyacioglu R, Jiang Y, et al. Towards Continuous Tissue Property Resolution in MR Fingerprinting using a Quadratic Inner Product Model. 27th annual ISMRM Proceedings, Montreal (2019).
6. Ma D, Jiang Y, Chen Y, et al. Fast 3D magnetic resonance fingerprinting for a whole-brain coverage. Magn Reson Med. 2018 79(4):2190-2197.
7. Guilfoyle D, Dyakin V, O'Shea J, et al. Quantitative measurements of proton spin‐lattice (T1) and spin–spin (T2) relaxation times in the mouse brain at 7.0 T. Magn. Reson. Med. 2003 49: 576-580.
8. Cong L, Muir E, Chen C, et al. Multimodal MRI Evaluation of the MitoPark Mouse Model of Parkinson’s Disease. PLoS One. 2016 11(3):e0151884.
Figures