0900
Multi-tissue constrained spherical deconvolution in a murine brain1Lab for Equilibrium Investigations and Aerospace, Dept. of Physics, University of Antwerp, Antwerp, Belgium, 2imec-Vision Lab, Dept. of Physics, University of Antwerp, Antwerp, Belgium, 3Bio Imaging Lab, Dept. of Biomedical Sciences, University of Antwerp, Antwerp, Belgium
Synopsis
Multi-tissue constrained spherical deconvolution (MT-CSD) leverages the unique b-value dependency of each brain tissue type to estimate the full white matter (WM) fiber orientation density function (fODF) as well as the apparent densities of gray matter (GM) and cerebrospinal fluid (CSF), directly from multi-shell diffusion MRI (dMRI) data. Currently, its adoption is focussed almost entirely on imaging of the human brain. In this work, we demonstrate that the sequence, the pipeline and the advantages that are now well established for human brains, can be transferred to murine brains, bringing the technique into the preclinical realm.
Introduction
Multi-tissue constrained spherical deconvolution (MT-CSD) leverages the unique b-value dependency of each brain tissue type to estimate the full white matter (WM) fiber orientation density function (fODF) as well as the apparent densities of gray matter (GM) and cerebrospinal fluid (CSF), directly from multi-shell diffusion MRI (dMRI) data [1]. Compared to conventional single-tissue CSD, which operates on single-shell data and solely estimates the WM fODF [2], MT-CSD has been shown to significantly improve precision and accuracy of the fODF estimates in voxels (partially) containing non-WM tissue, directly benefitting downstream applications such as apparent fiber density studies and fiber tracking. These benefits, as well as its availability in popular neuroimaging toolboxes, have lead to widespread adoption of MT-CSD for clinical and neuroscientific studies. However, this adoption is focussed almost entirely on imaging of the human brain. In this work, we demonstrate that the sequence, the pipeline and the advantages that are now well established for human brains, can be transferred to murine brains, bringing the technique into the preclinical realm.Methods
Acquisition: We adopted a dMRI scheme proposed for use in a clinical setting [1] and ported it to the preclinical setting (7T Pharmascan Bruker). We acquired in vivo dMRI from a mouse brain using a two-shot spin-echo EPI sequence with the following parameters: TE 20 ms, TR 7000 ms, FOV (21.6×20) mm2, acquisition matrix (108×100), in-plane resolution (0.2×0.2) mm2, 16 horizontal slices with slice thickness 0.5 mm, diffusion gradient duration 3 ms, diffusion gradient separation 10 ms. Multi-shell dMRI data was acquired in 3 separate scans comprising 3 b = 0 ms/μm2 scans and 20, 45 and 75 diffusion gradient directions with b = 0.7, 1.2 and 2.8 ms/μm2, respectively.Pre-processing: Raw dMRI images were corrected for motion and eddy-current induced distortions using FSL [3] and for bias fields using ANTs [4].
Subsequent modelling and fiber-tracking was performed using MRtrix3 [5].
Modelling: Multi-shell dMRI responses for WM (anisotropic, maximum spherical harmonic order 8), GM (isotropic) and CSF (isotropic) were estimated directly from the dMRI data [6]. Apparent densities of CSF and GM and the full WM-fODF were obtained using MT-CSD with the above responses [1]. For reference, a single-shell WM-only response was used to perform single-tissue CSD using only the dMRI data from the outermost-shell.
Fiber-tracking: Whole-brain probabilistic fiber tracking was performed directly on both the CSD and MT-CSD fODFs using fixed tracking parameters (iFOD2 algorithm [7], 100000 tracks, cutoff 0.07, dynamic seeding [8], defaults otherwise).
Results
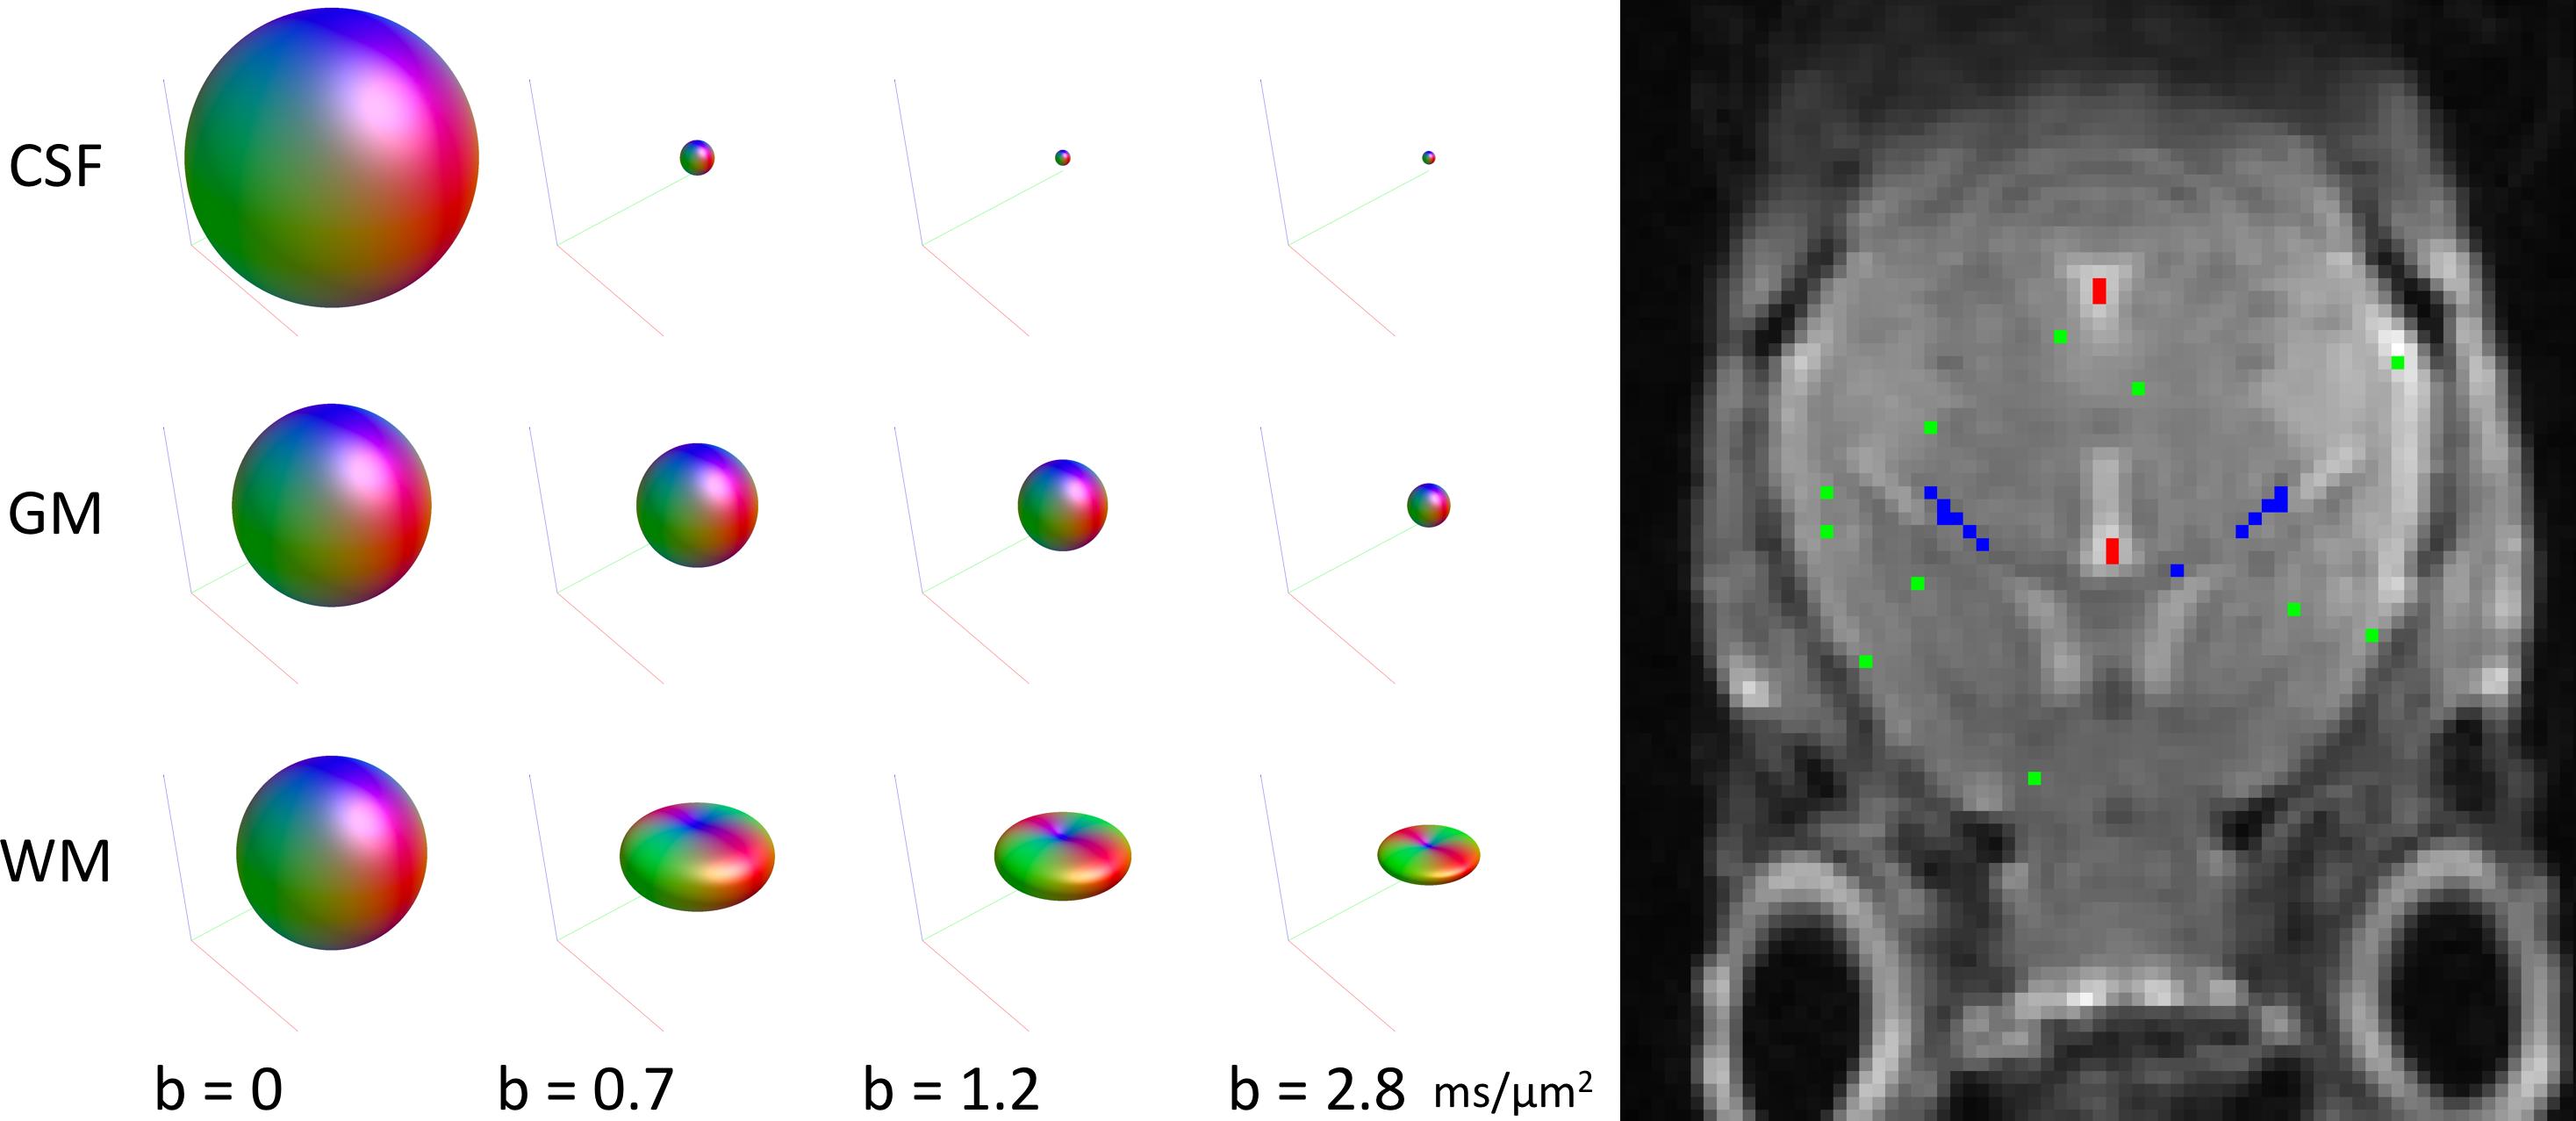
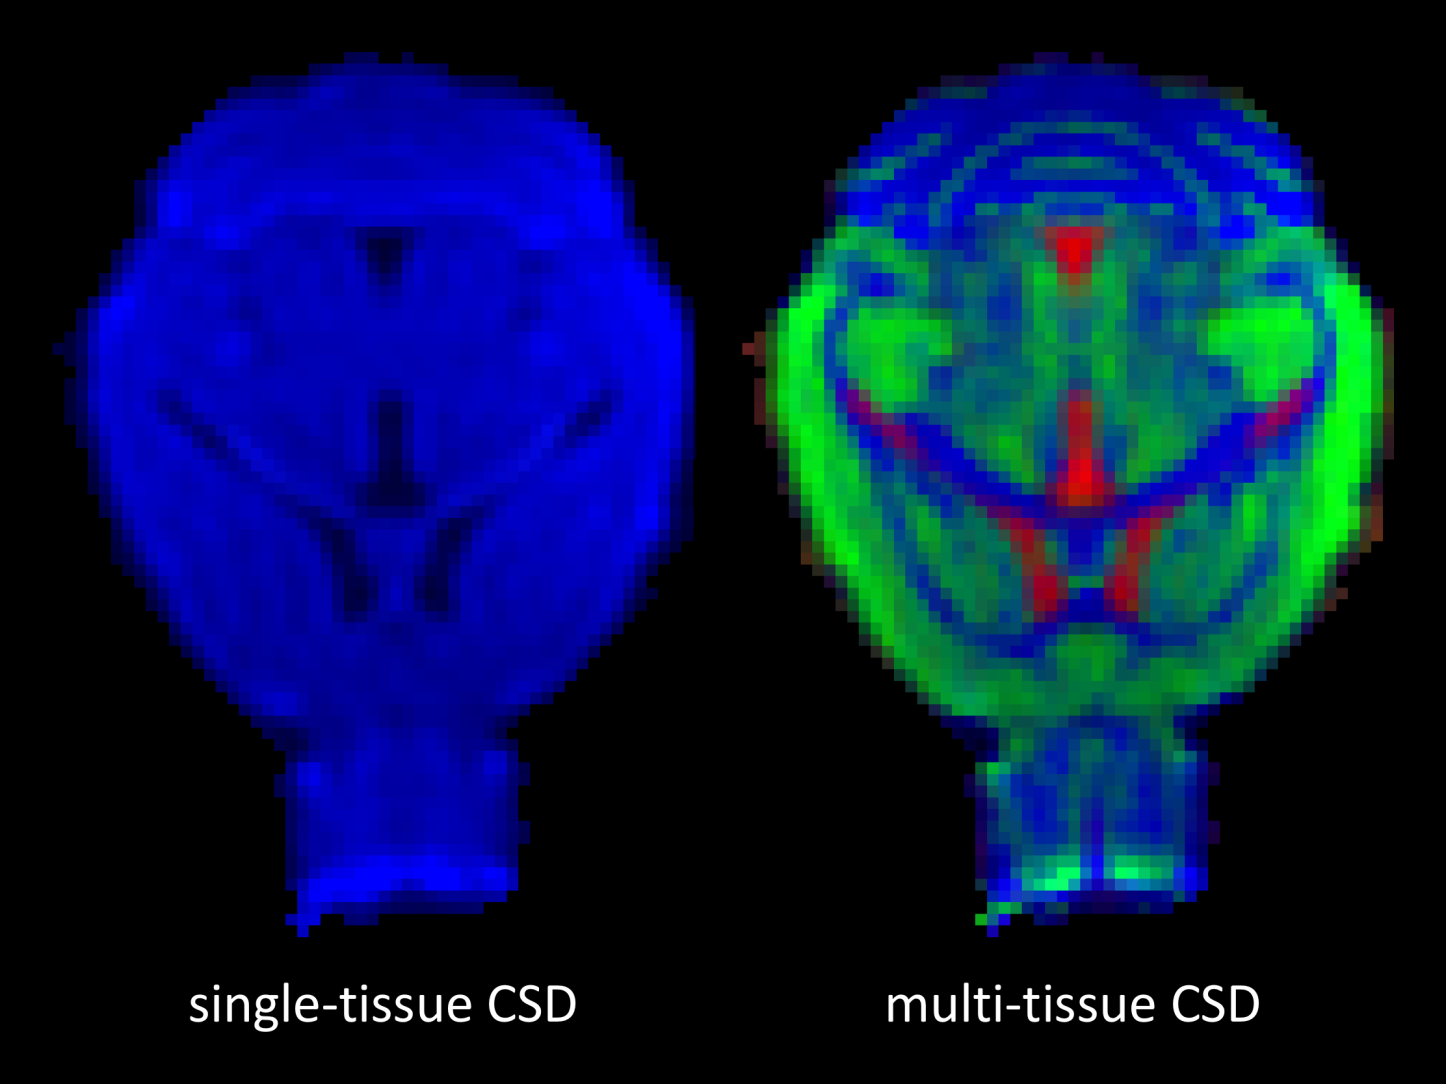
Fig. 1 shows the dMRI responses for WM, GM and CSF as a function of b-value (left) as well as the exemplar voxels from which these responses were obtained (right). Interestingly, the tissue-responses for the mouse-brain were tantamount to those observed in humans.Fig. 2 shows the total apparent tissue densities of WM, GM and CSF obtained with MT-CSD (right) as well as the total apparent density of WM obtained with traditional CSD (left). As observed already in humans, CSD overestimates the amount of WM tissue in voxels containing WM or CSF, whereas MT-CSD produces a clean segmentation of the three tissue types directly from the dMRI data.
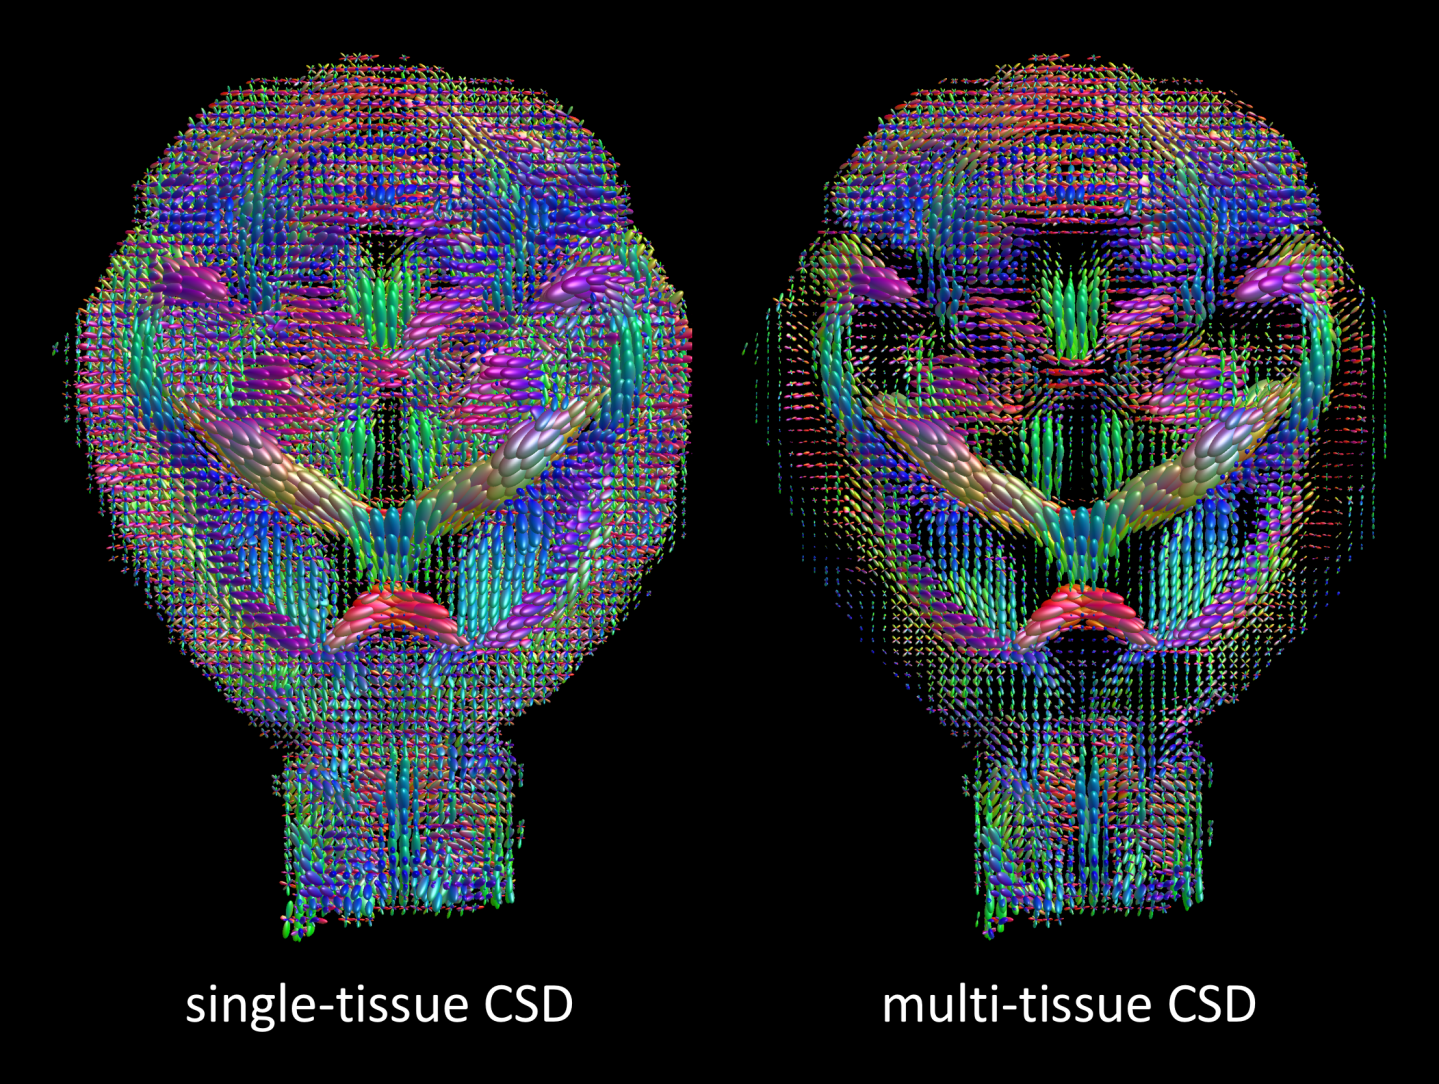
Fig. 3 shows the WM fODfs obtained with CSD (left) and MT-CSD (right). Notice the spurious fiber orientations in CSF-contaminated voxels when using CSD, as well as chaotic fiber orientations as one approaches the cortex (left). As in human brains, MT-CSD addresses these issues, resulting in clean and spatially consistent field of fODfs (right).
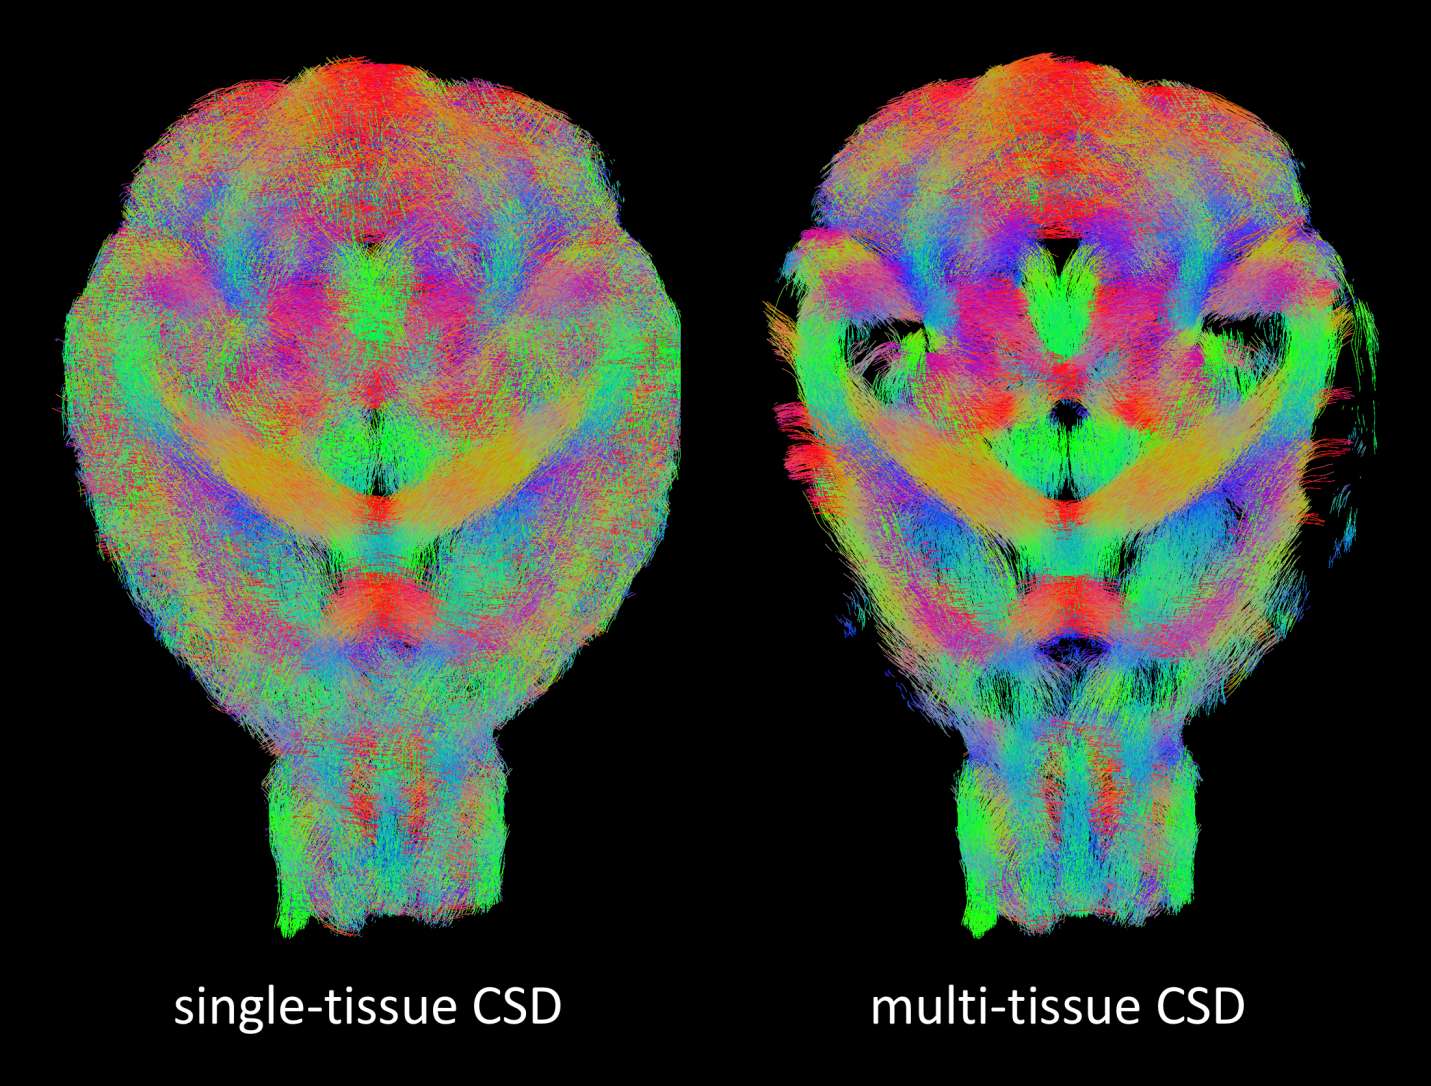
The effect of spurious fiber orientations as well as overestimation of WM densities is directly reflected in the fiber tracking results (Fig. 4). Indeed, the tractogram obtained with CSD fills almost the entire brain mask, with WM fibers disregarding the underlying anatomy, e.g. by traversing the ventricles and in general lacks definition of the actual WM structures (left). MT-CSD on the other hand avoids such anatomically implausible fiber tracks and the resulting tractogram exhibits well-defined WM structures (right).
Discussion and conclusion
Using a dMRI scheme and processing-pipeline optimized for human brains, we successfully analyzed a mouse brain using MT-CSD. Note that this required modifications to neither the dMRI scheme, nor the preprocessing, nor the multi-tissue modelling. The benefits of using MT-CSD in mouse-brains were shown to be tantamount to those observed in human brains: 1) tissue-type segmentation / tissue density quantification directly from the dMRI images; 2) reduced overestimation of WM in voxels containing non-WM tissue; 3) improved precision of WM fiber orientations in voxels containing non-WM tissue; 4) improved WM fiber tracking resulting in better defined whole brain tractograms. Our results demonstrate the flexibility and generalizability of the MT-CSD framework and bring the technique into the preclinical realm, furthering its adoption outside the traditional clinical setting.Acknowledgements
References
1. Jeurissen B, Tournier J-D, Dhollander T, Connelly A, Sijbers J. Multi-tissue constrained spherical deconvolution for improved analysis of multi-shell diffusion MRI data. Neuroimage. 2014;103: 411–426.
2. Tournier J-D, Calamante F, Connelly A. Robust determination of the fibre orientation distribution in diffusion MRI: non-negativity constrained super-resolved spherical deconvolution. Neuroimage. 2007;35: 1459–1472.
3. Andersson JLR, Sotiropoulos SN. An integrated approach to correction for off-resonance effects and subject movement in diffusion MR imaging. Neuroimage. 2016;125: 1063–1078.
4. Tustison NJ, Avants BB, Cook PA, Zheng Y, Egan A, Yushkevich PA, Gee JC. N4ITK: improved N3 bias correction. IEEE Trans Med Imaging. 2010;29: 1310–1320.
5. Tournier J-D, Smith R, Raffelt D, Tabbara R, Dhollander T, Pietsch M, Christiaens D, Jeurissen B, Yeh C-H, Connelly A. MRtrix3: A fast, flexible and open software framework for medical image processing and visualisation. Neuroimage. 2019; 116137.
6. Dhollander T, Raffelt D, Connelly A. Unsupervised 3-tissue response function estimation from single-shell or multi-shell diffusion MR data without a co-registered T1 image, ISMRM Workshop on Breaking the Barriers of Diffusion MRI. 2016. p. 5.
7. Tournier JD, Calamante F, Connelly A. Improved probabilistic streamlines tractography by 2nd order integration over fibre orientation distributions. Proceedings of the international society for magnetic resonance in medicine. 2010. p. 1670.
8. Smith RE, Tournier J-D, Calamante F, Connelly A. SIFT2: Enabling dense quantitative assessment of brain white matter connectivity using streamlines tractography. Neuroimage. 2015;119: 338–351.
Figures