0898
A quantitative approach to validate the mouse thalamo-cortical structural network reconstructed using diffusion MRI tractography1Radiology, NYU School of Medicine, New York, NY, United States
Synopsis
In this work, we used our previously reported high-resolution dMRI-based mouse brain atlas8 to trace node-to-node thalamo-cortical structural connectivity in the mouse brain. Taking advantage of the rich viral tracer data from the Allen Mouse Brain Connectivity Atlas (AMBCA)4, the tractography results were examined using the tracer data as ground truth. Our findings pinpoint the potentiality of mapping reliable structural connectivity in gray matter structures using tractography and at the same time, highlight the necessity of further investigation on determining the imaging and tractography parameters for accurate estimation of such connectivity.
Introduction:
Mapping complex neural connections across a range of spatial scales and in a number of species has yielded intriguing insights into brain circuits in health and diseases, and their relationship to behavior1,2. Despite the use of chemical and viral tracers has allowed direct visualization of neural connections with high sensitivity and specificity3,4, the technique remained limited due to its invasiveness and inability to examine multiple circuitries within a single brain. Diffusion MRI (dMRI) tractography, in contrast, permits non-invasive mapping of multiple pathways in the entire brain, but often contains false positives or negatives5-7. Although major white matter pathways can be reliably reconstructed using dMRI tractography, whether we can extend it to seek neural connections within largely gray matter structures remaining to be investigated.In this work, we used our previously reported high-resolution dMRI-based mouse brain atlas8 to trace node-to-node thalamo-cortical structural connectivity in the mouse brain. Taking advantage of the rich viral tracer data from the Allen Mouse Brain Connectivity Atlas (AMBCA)4, the tractography results were examined using the tracer data as ground truth. Our main aim is to find thalamo-cortical connections that can be reliably traced and lay the ground work for systematic optimization of dMRI tractography.
Methods:
MRI data: High-resolution dMRI of ex-vivo adult mouse brains (n=7) were acquired using a 7T MR scanner equipped with a receive-only four-channel cryogenic coil and a modified 3D diffusion-weighted GRASE sequence9,10 with the following parameters: TE/TR=33/500 ms; NA=2; 0.1x0.1x0.1 mm3; 60 diffusion-directions; and b=5,000 s/mm2 and one with b=2,000/5,000/8,000 s/mm2.Probabilistic fiber tractography mapping: Mouse whole brain fiber tractogram (WBFT) was generated from the fiber orientation distribution maps (FOD11, lmax = 6) by placing seeds randomly within the individual brain mask using second-order integration over FOD algorithm12. 5 million streamlines were generated for each subject using the following tractography parameters: FOD amplitude threshold=0.05, minimum fiber length=3 mm, step size=0.025 mm, angle between successive steps=45°. Using the spherical deconvolution (SD) informed filtering of tractograms algorithm13, we corrected the number of streamlines. Then we extracted 14 cortical and 11 thalamic ROIs using our mouse brain atlas8 to estimate thalamo-cortical tractograms from the filtered WBFT of each subject and further generated tract density images (TDI)14 for individual trajectory.
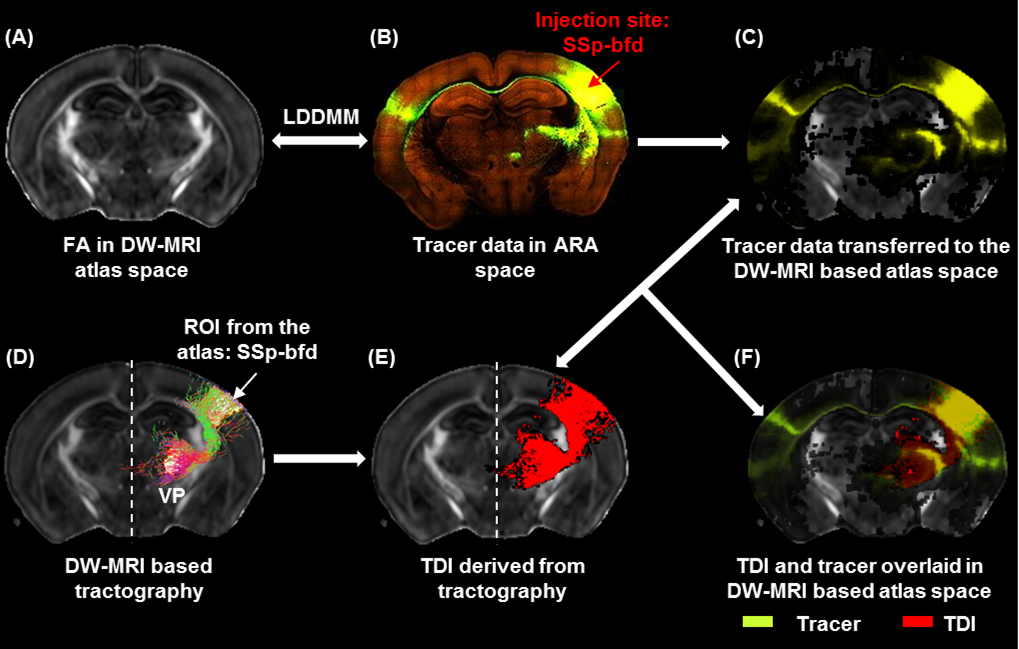
TDI and tracer data co-registration in the atlas space: Estimated TDIs and the tracer data from the AMBCA4 were co-registered into the atlas space (Fig.1A-C) following image registration pipeline described earlier8. Thus we were able to map TDIs and the tracer data (ground truth) into a common atlas space (Fig.1D-F) and examine the similarity index by computing DICE15 score into 3 categories: similarity level–good (>0.8), moderate (0.6–0.8) and poor (<0.6).
Results and discussion:
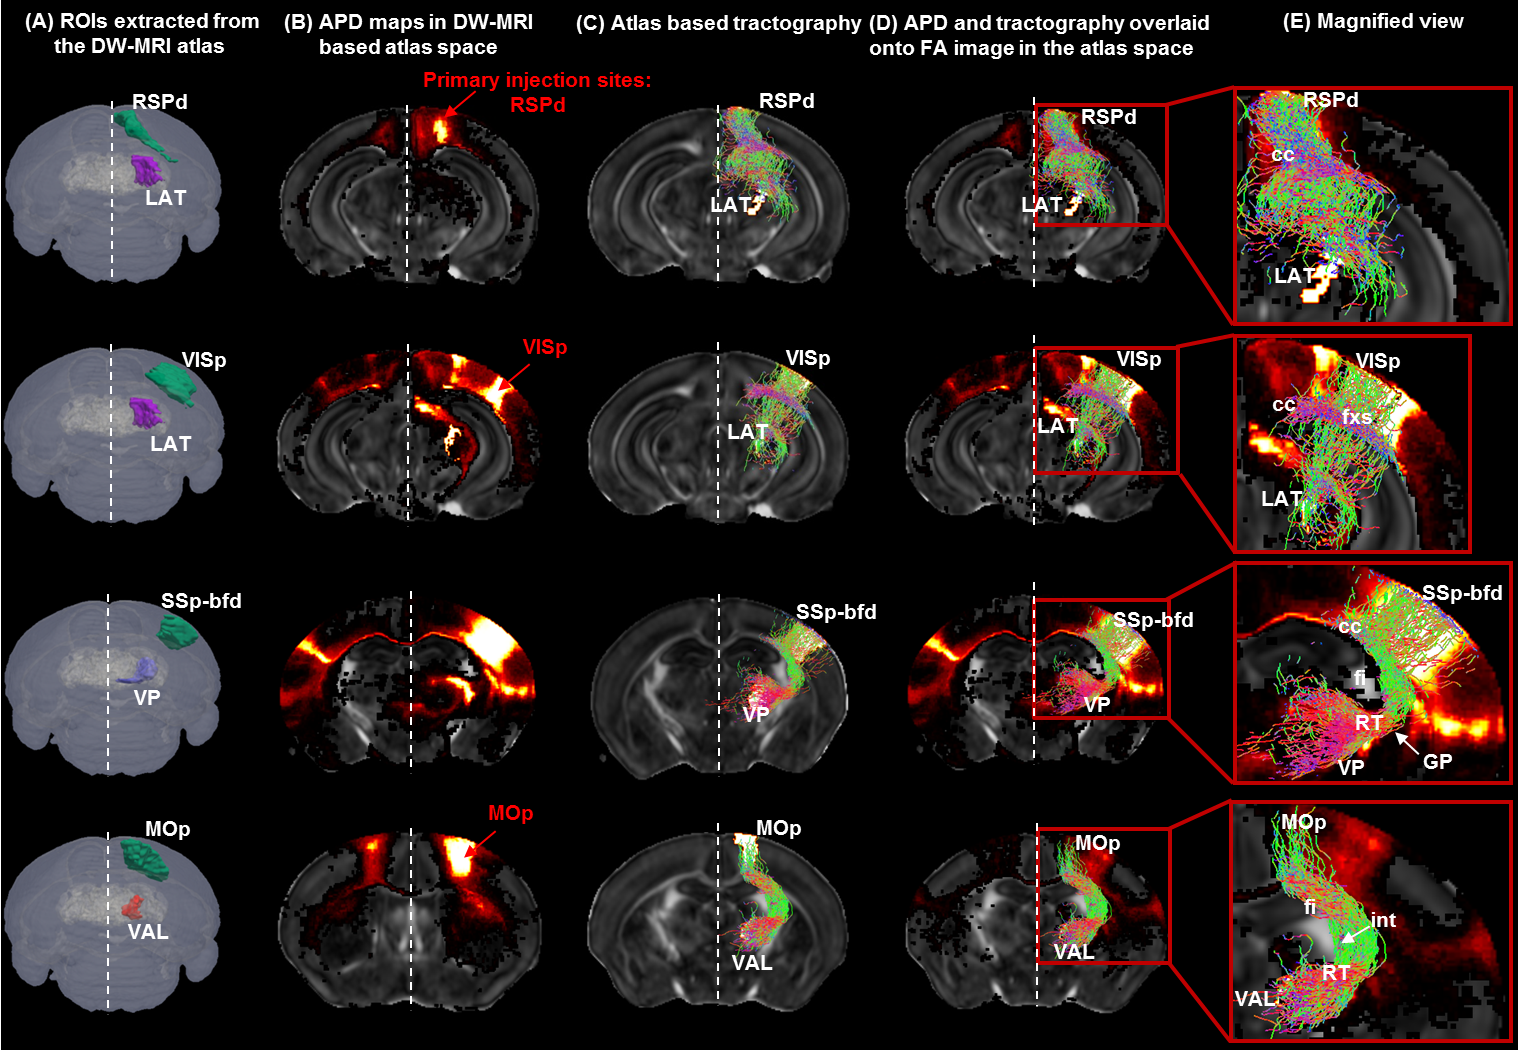
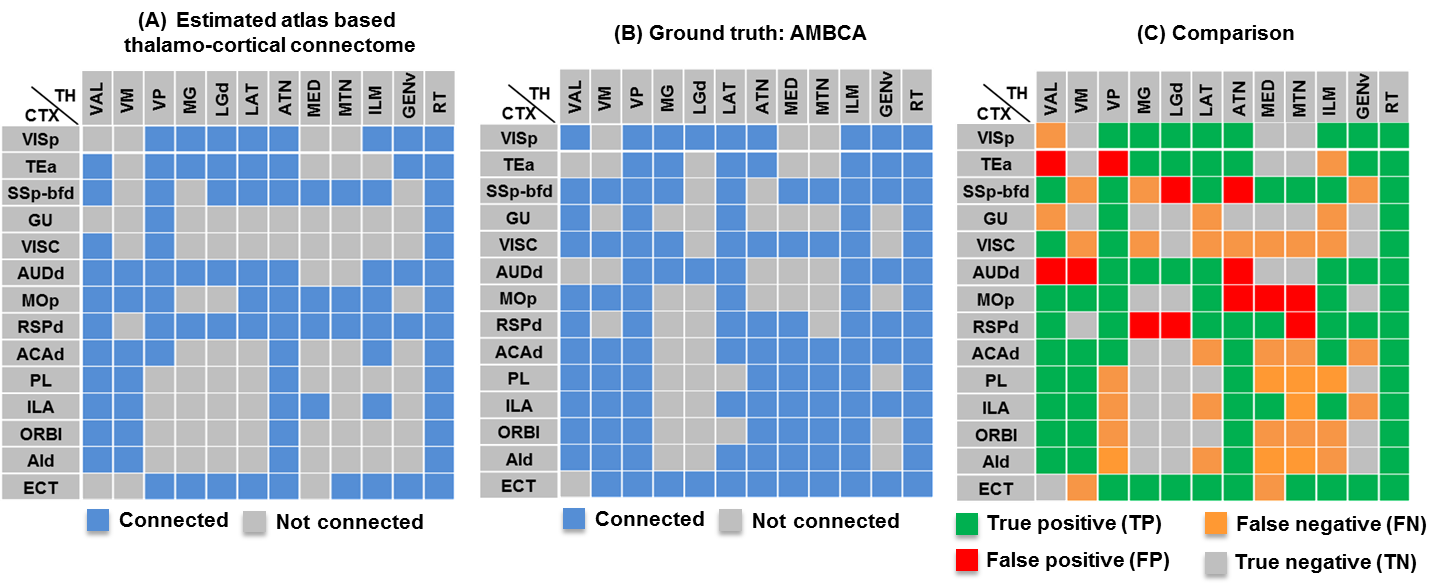
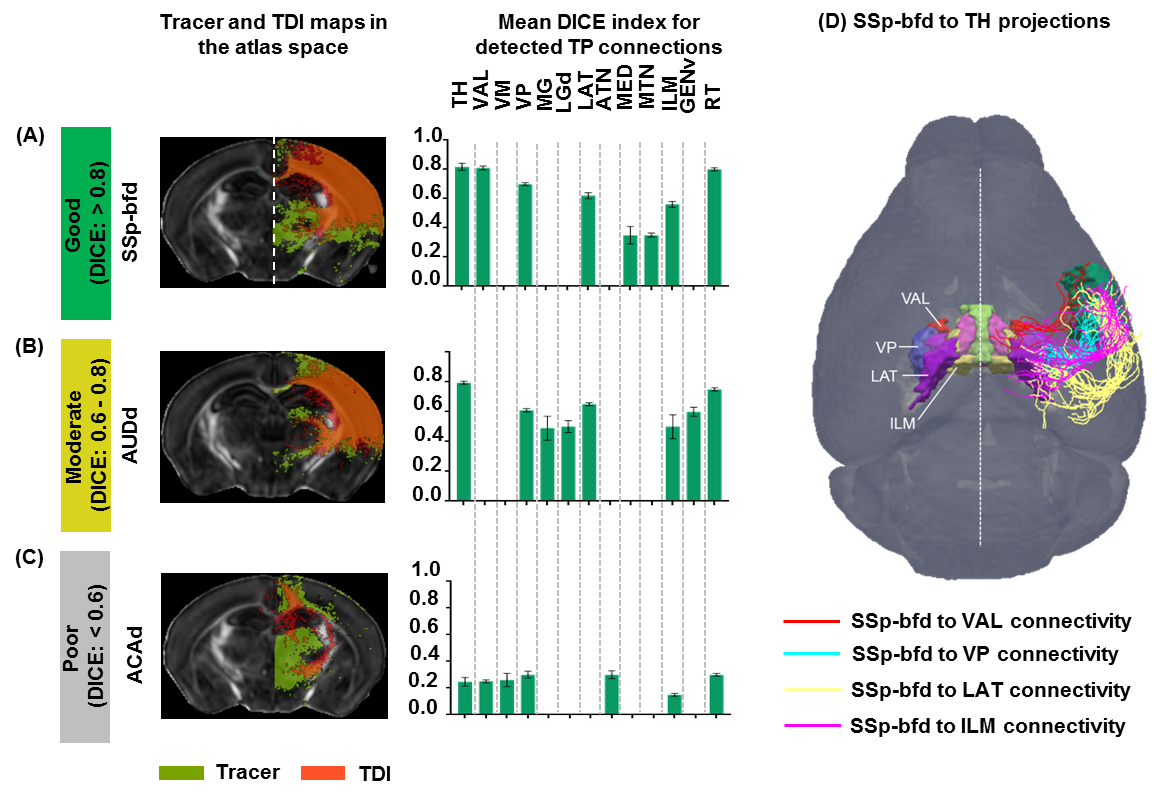
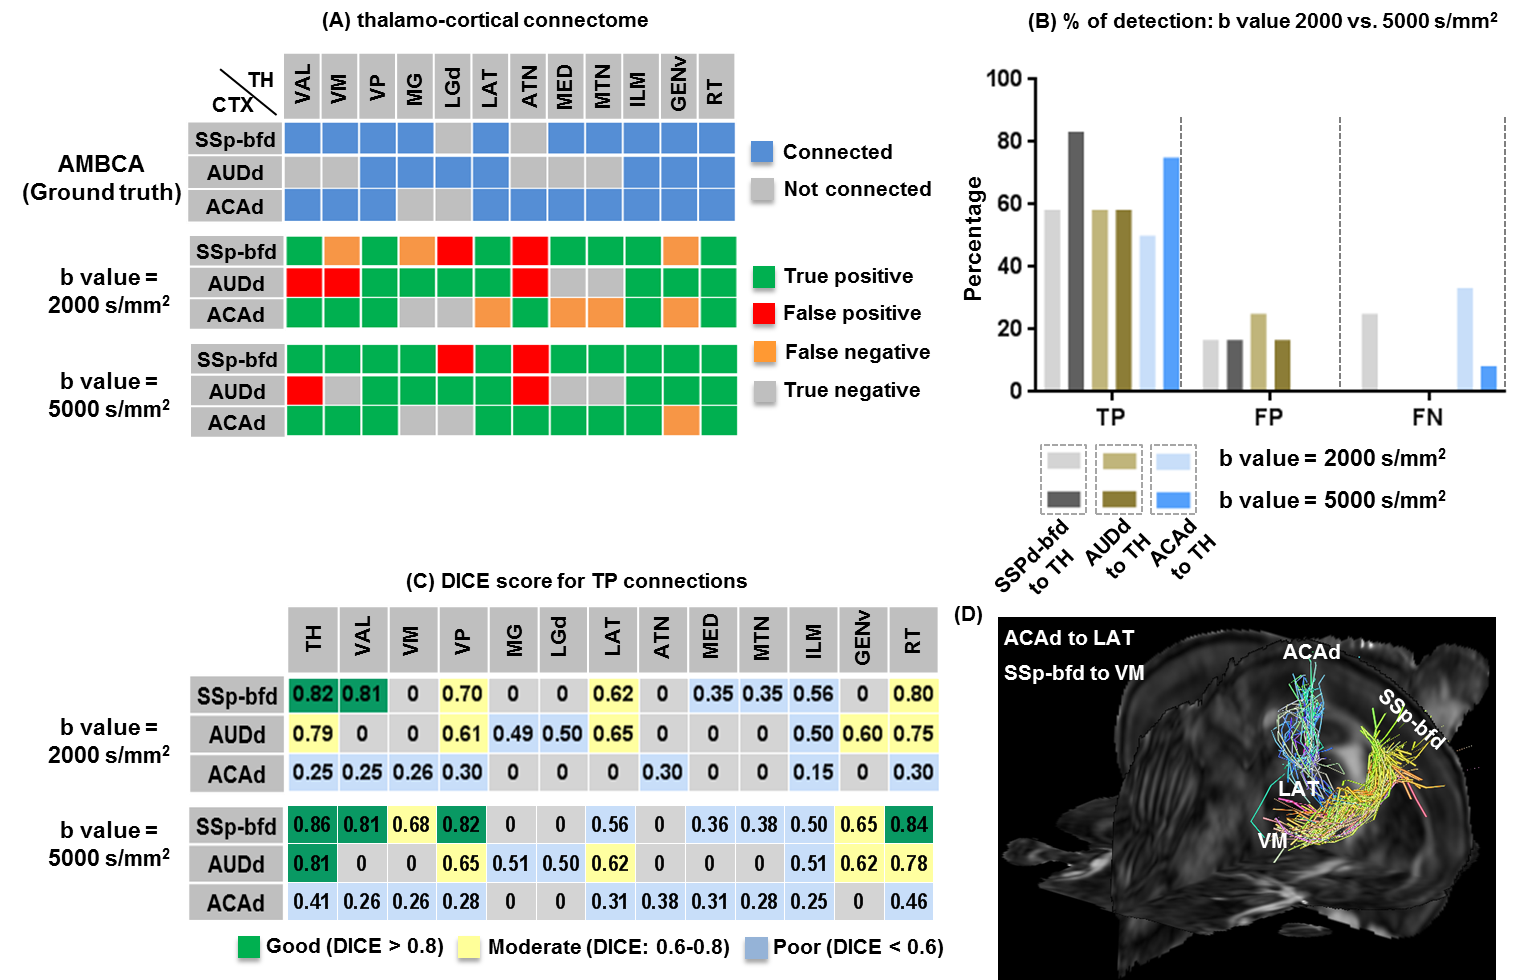
Patterns of thalamo-cortical fiber projections: Most thalamo-cortical connections, except the connection to the retrosplenial/visual area, passed through the fiber tracts in the striatum, narrowing through the globus pallidus region of the pallidum before spreading throughout the thalamus (TH) via thalamic reticular nucleus (RT) (Fig.2A-E).Quantitative analysis of the detected tracts: The consistency between the estimated thalamo-cortical connectome (Fig.3A) and the ground truth (Fig.3B) was in general high, albeit, differences were observed in several cortical nodes to thalamic network projection pathways. False positive (FP) connections were detected in five out of fourteen cortical nodes, namely temporal association (TEa), somatosensory barrel-field (SSP-bfd), primary motor (MOp), dorsal auditory (AUDd), and dorsal retrosplenial area (RSPd) to the TH (Fig.3C). Prefrontal (PFC: ACAd/PL/ILA/ORBl/AId), gustatory/visceral (GU/VISC) and the ectorhinal area (ECT) on the other hand did not show any FP projections, yet, several false negative (FN) connections were identified predominantly toward the ventral group of the dorsal TH (Fig.3C). One of the reasons behind these discrepancies might be related to partial volume effect in the GM–WM interface, which often appears at the edge of a nucleus due to the concoction of high diffusion anisotropy from WM with low anisotropy from the GM in the nucleus and thus resulting uncertainty in the detection of terminating fiber tracts. Based on DICE scores, we found that the tractography results from VISp, SSp-bfd, and MOp showed strong spatial agreement (DICE>0.8) with the AMBCA results (Fig.4A), whereas tractography results from the AUDd, RSPd and TEa showed moderate agreements (0.6<DICE<0.8) (Fig.4B) and results from other cortical nodes only showed poor agreements (DICE<0.6) (Fig.4C). However, the DICE scores varied from good-poor when we further dissected the results for different thalamic nuclei (Fig.4A-C).
High b-value dMRI improved tract reconstruction: Fig.5A-C illustrates reconstruction results and DICE scores for 3 representative tracts based on dMRI data acquired with b=2,000 and 5,000 s/mm2 respectively. The results from dMRI data with b=5,000 s/mm2 showed better agreement with ground truth than the results with b=2,000 s/mm2. Fig.5D visualizes the tracts that showed improved DICE scores at b=5,000 s/mm2.
Conclusion:
In conclusion, our DW-MRI based adult C57BL/6J mouse brain atlas can be used to locate anatomical structures and investigate macroscopic structural connectivity in the mouse brain with high throughput. The framework reported in this study will serve as a ground for cross-examination of potential disrupted connections in genetically modified mouse strains.Acknowledgements
NIH R01 NS 102904References
1. Bassett DS, Bullmore ET. Human brain networks in health and disease. Curr Opin Neurol. 2009;22(4):340–347. doi:10.1097/WCO.0b013e32832d93dd
2. Ye C, Mori S, Chan P, Ma T. Connectome-wide network analysis of white matter connectivity in Alzheimer's disease. Neuroimage Clin. 2019;22:101690. doi:10.1016/j.nicl.2019.101690
3. Harris, J. A., Oh, S. W. & Zeng, H. Adeno-associated viral vectors for anterograde axonal tracing with fluorescent proteins in nontransgenic and Cre driver mice. Curr. Protoc. Neurosci. 2012; 59, 1.20.1–1.20.18. doi:10.1002/0471142301.ns0120s59
4. Oh SW, Harris JA, Ng L, et al. A mesoscale connectome of the mouse brain. Nature. 2014;508(7495):207–214. doi:10.1038/nature13186
5. Aydogan DB, Jacobs R, Dulawa S, et al. When tractography meets tracer injections: a systematic study of trends and variation sources of diffusion-based connectivity. Brain Struct Funct. 2018;223(6):2841–2858. doi:10.1007/s00429-018-1663-8
6. Thomas C, Ye FQ, Irfanoglu MO, et al. Anatomical accuracy of brain connections derived from diffusion MRI tractography is inherently limited. Proc Natl Acad Sci U S A. 2014;111(46):16574–16579. doi:10.1073/pnas.1405672111
7. Calabrese E, Badea A, Cofer G, Qi Y, Johnson GA. A Diffusion MRI Tractography Connectome of the Mouse Brain and Comparison with Neuronal Tracer Data. Cereb Cortex. 2015;25(11):4628–4637. doi:10.1093/cercor/bhv121
8. Arefin T, Lee C, Aristizabal O, et al. High resolution diffusion magnetic resonance imaging based atlas of the C57BL/6J adult mouse brain: a tool for examining mouse brain structures. ISMRM, Montreal, 2019. Proc. Intl. Soc. Mag. Reson. Med. 27.
9. Aggarwal M, Mori S, Shimogori T, Blackshaw S, Zhang J. Three-dimensional diffusion tensor microimaging for anatomical characterization of the mouse brain. Magn Reson Med. 2010;64(1):249–261. doi:10.1002/mrm.22426
10. Wu D, Reisinger D, Xu J, et al. Localized diffusion magnetic resonance micro-imaging of the live mouse brain. Neuroimage. 2014;91:12–20. doi:10.1016/j.neuroimage.2014.01.014
11. Tournier J, Calamante F, Gadian G, Connelly A. Direct estimation of the fiber orientation density function from diffusion-weighted MRI data using spherical deconvolution. NeuroImage. 2004;23 (3), 1176–1185. doi.org/10.1016/j.neuroimage.2004.07.037
12. Tournier J, Calamante F, Connelly A. Improved probabilistic streamlines tractography by 2nd order integration over fibre orientation distributions. Proceedings of the International Society for Magnetic Resonance in Medicine, 2010, 1670.
13. Smith R, Tournier J, Calamante F, Connelly A. SIFT: Spherical-deconvolution informed filtering of tractograms. NeuroImage. 2013; 67:298-312. doi: 10.1016/j.neuroimage.2012.11.049.
14. Calamante F, Tournier J, Jackson G, Connelly A. Track-density imaging (TDI): super-resolution white matter imaging using whole-brain track-density mapping. NeuroImage. 2010;53(4):1233-43. doi: 10.1016/j.neuroimage.2010.07.024.
15. Dice, L.R. Measures of the Amount of Ecologic Association between Species. Ecology. 1945; 26(3):297–302.
Figures