0897
Toward high spatial resolution functional MRI: In vivo 50-micron cerebral blood volume mapping of the mouse brain
Akira Sumiyoshi1, Keigo Hikishima2, and Ichio Aoki1
1National Institutes for Quantum and Radiological Science and Technology (QST), Chiba, Japan, 2Okinawa Institute of Science and Technology Graduate University (OIST), Okinawa, Japan
1National Institutes for Quantum and Radiological Science and Technology (QST), Chiba, Japan, 2Okinawa Institute of Science and Technology Graduate University (OIST), Okinawa, Japan
Synopsis
We report here in vivo 50-micron cerebral blood volume (CBV) mapping of the mouse brain using intraperitoneal injection protocol of gadolinium-based contrast agent. Based on k-means clustering we identified different vascular clusters that separately range from macro- to micro-vasculature. The CBV map demonstrated layer-dependent macro- and micro-vascular densities in the cortex where different cortical regions exhibited different vascular patterns. The CBV map also identified different vascular densities and patterns in the hippocampus. These results suggest that CBV map would be a useful and alternative tool that assesses brain function and metabolism at extremely high spatial resolution.
Introduction
Cerebral blood volume (CBV) mapping with intraperitoneal injection of gadolinium-based contrast agent has been developed to infer brain function and metabolism1. By comparing image intensity before and after injection of contrast agent, one can noninvasively map vessel density of the whole brain, i.e., ΔR2 map, which results in similar map of glucose metabolism2. This method has several advantages than typical functional MRI: 1) i.p. injection, but not i.v. injection3, delays distribution and metabolism of contrast agent and hence allows longer scanning time; 2) i.p. injection of higher dose of contrast agent (> 1 mM in blood) converts from R1 to R2 enhancement; and 3) the use of T2-weighted imaging, but not EPI sequence, suppresses geometric distortion and allows image segmentation into subregions of brain structure4. Although temporal resolution of CBV mapping is limited (i.e., on the order of minutes), this method has been widely used for several mouse models of neurological and psychiatric disorders5,6. On the other hand, the recent emergence of higher magnet field with cryogenic coil in the preclinical MRI should improve image quality of mouse CBV mapping. In particular spin-echo typed CBV mapping in higher field would be more reflected by the contribution of microvessel density7 (i.e., 5 μm in the diameter), implying that CBV mapping could be more correlated with underlying neuronal activity. In this study, to develop higher spatial resolution and more “precise” functional MRI, we pursued in vivo 50 μm CBV mapping in the mouse brain using 11.7-T magnet with cryogenic probe.Methods
A total of 15 male C57BL/6J mice (22-28 g) was used. Each mouse was anesthetized with isoflurane (1.0-1.5% during scanning) and placed in the prone position with head fixation apparatus. Both body temperature and respiration rate were regulated within the physiological range. MRI data were acquired using 11.7-T Bruker BioSpec system with cryogenic surface coil that was designed to serve as both transmitter and receiver for the mouse brain. T2-weighted images were obtained using spin-echo 2D-RARE sequence with the following parameters: TR = 9000 ms, TEeff = 30 ms, in-plane resolution = 50 x 50 μm2, and slice thickness = 150 μm. The scanning time for single brain volume was approximately 6 min and the number of repetitions was 35. First 10 volumes (60 min) were used for Pre-injection, second 5 volumes (30 min) were used for distribution period, and final 20 volumes (120 min) were used for Post-injection. Omniscan (10 mmol/kg, i.p.) was used for the contrast agent1. The CBV map was computed by ΔR2 = ln(Spre/Spost)/TE where Spre and Spost are signal intensity before and after injection, respectively. After skull-stripping, moving artifact correction, and resampling into isotropic 50 μm voxel, the CBV maps were normalized to AMBMC atlas where cortical and hippocampal ROIs are available8,9. The study protocol was reviewed by the OIST Animal Care and Use Committee and approved by the institute.Results
The T2-weighted images of the mouse brain were obtained at 50 μm spatial resolution (Fig. 1). The SNRs of Pre- and Post-injection were 42 ± 4 and 52 ± 9, respectively. To segment CBV map into different intensity clusters, k-means clustering without any prior was applied10. The CBV map was segmented into 6 different intensity clusters (Fig. 2A) where the top intensity cluster (c1) corresponded to macro-vasculature, and the second to fourth clusters corresponded to micro-vasculature. The layer differences in the cortex were observed where the middle layer showed c2-enriched while the deep layer showed c3-enriched. The subcortical regions showed c4-enriched distribution. The bottom c5 and c6 clusters were located outside the parenchyma or in the cerebrospinal fluid. The time-course of each cluster showed long-lasting steady-state period after 30 min of injection (Fig. 2B). To quantify the regional differences of each cluster, the percent volume was computed based on AMBMC atlas (Fig. 3). Cingulate, frontal, occipital, and parietal regions showed higher micro-vasculature density (from c2 to c4) compared with other cortical regions (Fig. 3A). In the hippocampus, the molecular layer showed higher micro-vasculature density (from c2 to c4) compared with other hippocampal subregions (Fig. 3B).Discussion
By increasing the spatial resolution of CBV map, we were able to identify macro- and micro-vasculature clusters in the mouse brain, which implies that, while avoiding the partial volume effects of macro-vascular components, we were able to provide the micro-vasculature density map that should be more linked to underlying neuronal activity. Although typical functional MRI allows scans on the order of seconds, it relies on neurovascular coupling. The previous studies reported neurovascular “uncoupling” in the frontal cortex11 and during resting-state12, indicating that neurovascular coupling does not holds for certain brain regions and conditions. In addition, the signal source of gradient-echo typed functional MRI at lower field (such as 3.0-T) are dominated by the macro-vasculature contribution7. Higher resolution CBV map acquired with spin-echo sequence at higher magnetic field should reflect more neuronal origin in principle and would be considered as “direct” tool for functional MRI. Further technical advancements such as development of novel contrast agent (safer and longer half-life), improvements in coil sensitivity, faster imaging sequence, and higher magnetic field are expected in the future study to seek for “ultimate” functional MRI tool.Acknowledgements
This work was supported by JSPS KAKENHI Grant Number 19K07797 and the Intramural Research Program of QST, Chiba, Japan.References
- Moreno et al., 2006. NMR Biomed 19, 535–543.
- Small et al., 2011. Nat. Rev. Neurosci. 12, 585–601.
- Lin et al., 2009. NeuroImage 45, 824–831.
- Pereira et al., 2007. Proc. Natl. Acad. Sci. U.S.A. 104, 5638–5643.
- Schobel et al., 2013. Neuron 78, 81–93.
- Khan et al., 2014. Nat. Neurosci. 17, 304–311.
- Uludag et al., 2009. NeuroImage 48, 150–165.
- Ullmann et al., 2013. NeuroImage. 78, 196–203.
- Richards et al., 2011. NeuroImage 58, 732–740.
- Avants et al., 2011. Neuroinformatics 9, 381–400.
- Huo et al., 2014. J. Neurosci. 34, 10975–10981.
- Winder et al., 2017. Nat. Neurosci. 20, 1761–1769.
Figures
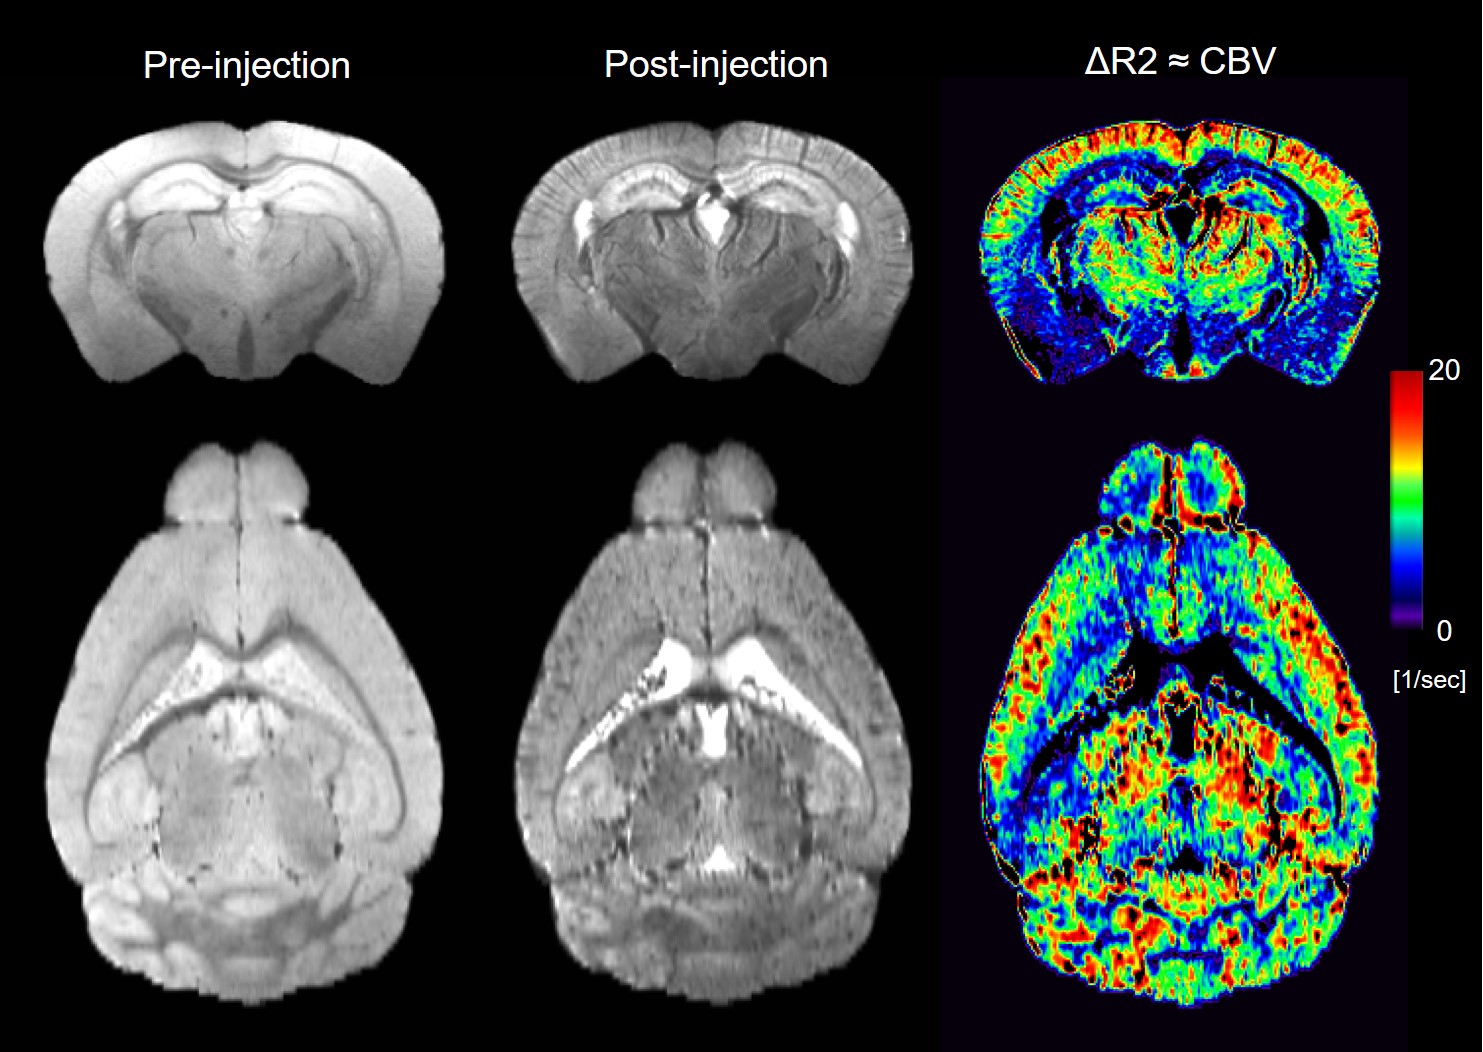
Fig 1. The Pre- and Post-injection T2-weighted images as well as CBV map
at 50 μm spatial resolution. The
regional differences of vessel density were observed where the middle layer of
cortex, the molecular layer of dentate gyrus, and several thalamic nuclei were observed
with enriched vessels.
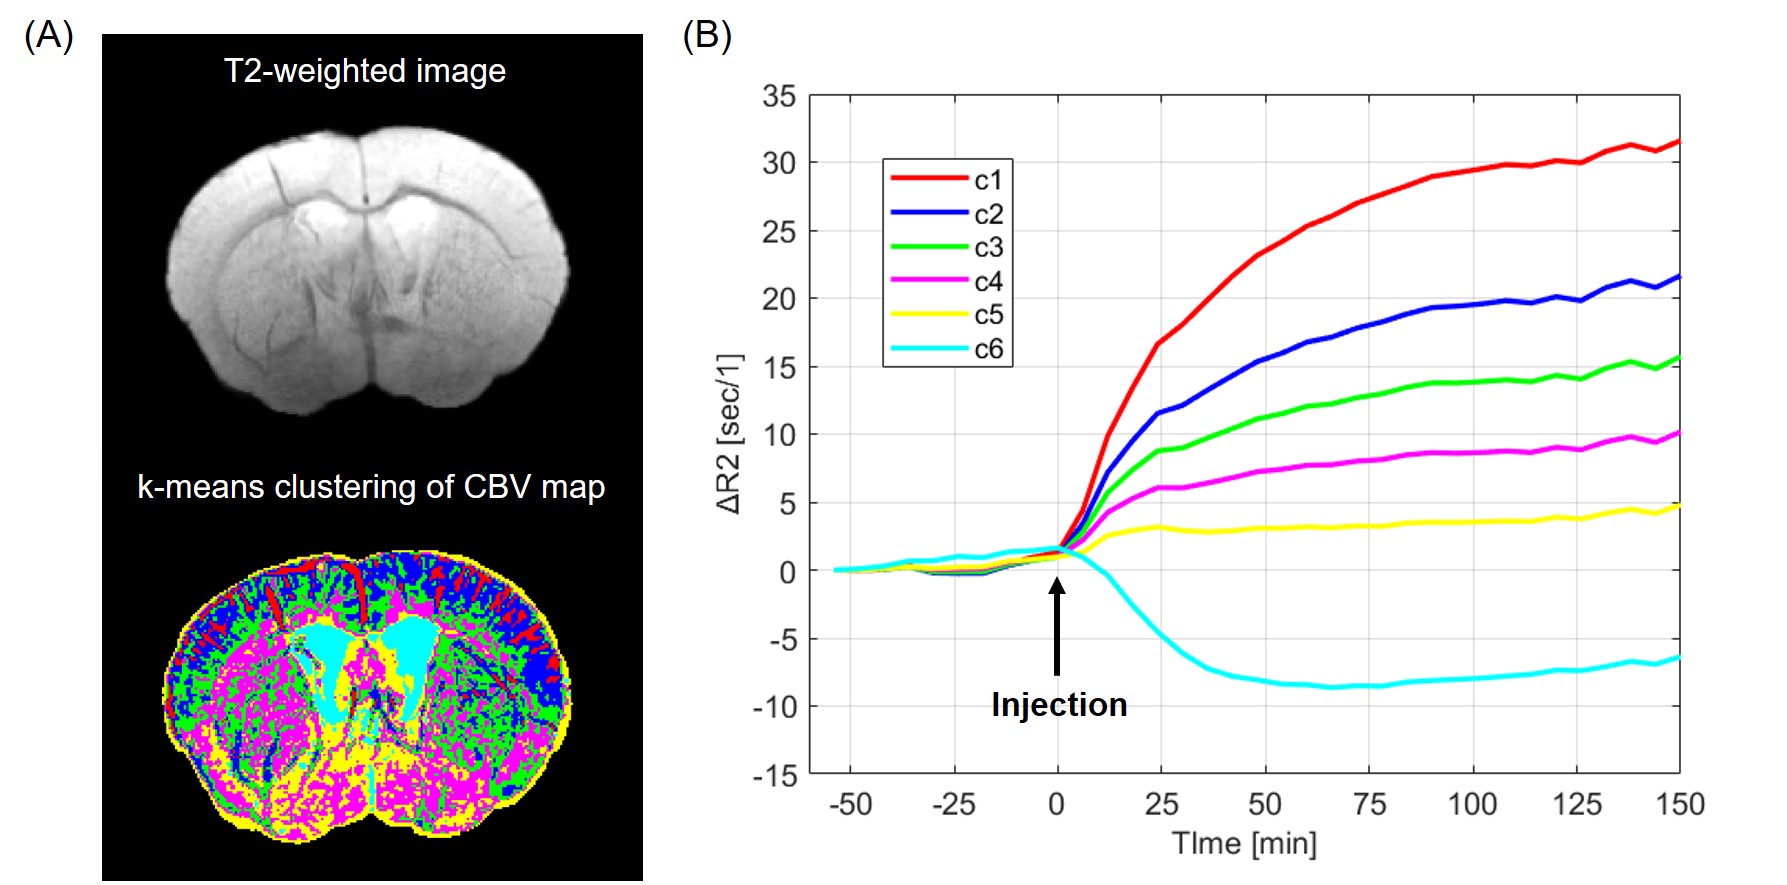
Fig 2. (A) K-means clustering of CBV map into 6 different intensity clusters.
(B) The different intensity clusters showed long-lasting steady-state period
after 30 min of contrast agent injection.
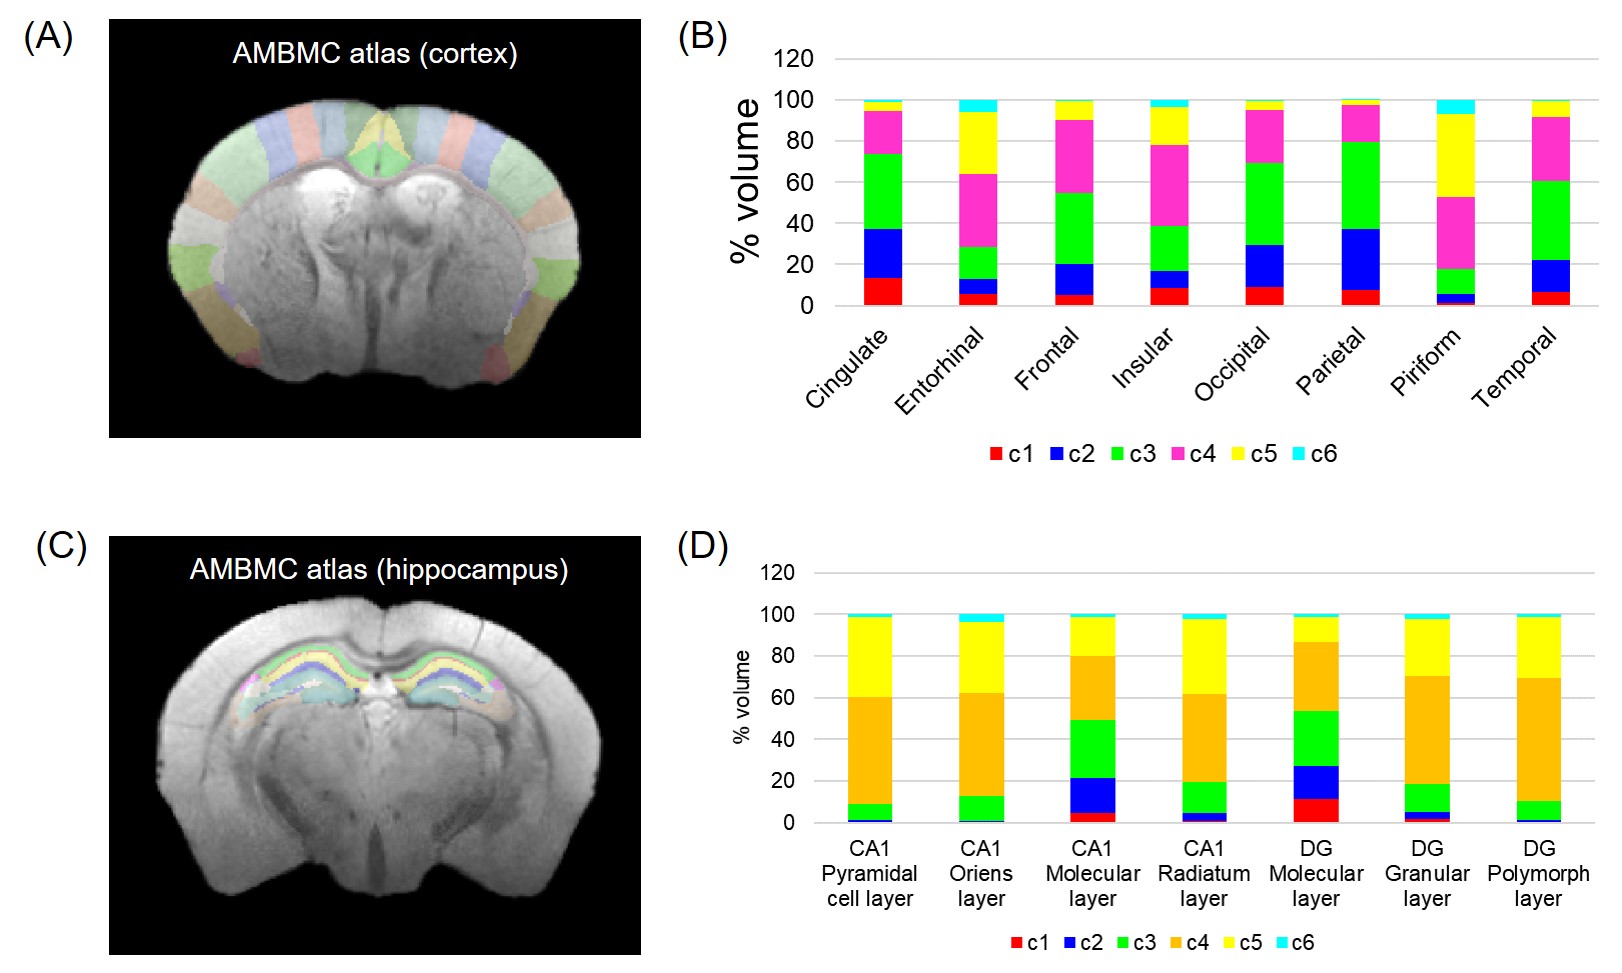
Fig. 3. (A) The atlas of cortex. (B) The percent volume of each cluster
in the different region of the cortex. (C) The atlas of hippocampus. (D) The
percent volume of each cluster in the different subregion of hippocampus.