0896
Simultaneous measurements of blood flow and blood water T2: a general-purpose sequence for T2-based measurement of whole-organ O2 consumption
Cheng-Chieh Cheng1, Pei-Hsin Wu1, Michael C. Langham1, and Felix W. Wehrli1
1University of Pennsylvania, Philadelphia, PA, United States
1University of Pennsylvania, Philadelphia, PA, United States
Synopsis
A T2-based oximetry method for quantifying whole-organ metabolic rate of oxygen (MRO2): A velocity-encoded acquisition module with golden-angle radial sampling was inserted into a background-suppressed T2-prepared sequence specifically for blood water T2 quantification. Parallel imaging and compressed-sensing techniques were applied to the reconstruction of the sparsely-sampled velocity-encoded k-space data to generate velocity maps. Whole-organ oxygen metabolic rate was estimated by converting T2 to blood oxygenation level via a calibration curve. A pilot study in the superior sagittal sinus showed the method’s ability to estimate whole-brain CMRO2 (136±23 μmol/minute/100g, mean±S.D.) in a single pass.
INTRODUCTION
Organ metabolic rate of O2 (MRO2) is of significant clinical interest as it is an important indicator of organ health 1. As MR-based oximetry often employs multiple pulse sequences for measurements of blood flow rate and oxygen saturation level (%HbO2) in vessels, an integrated protocol would be desirable as it reduces the workflow and increases temporal fidelity between measurements. Susceptometry-based oximetry (SBO) 2, 3 achieves this goal but the method is not universally applicable, for instance in situations where the draining vein is oriented perpendicular to B0 or no reference tissue is available for intravascular phase measurement 4. In such circumstances T2-based %HbO2 quantification 5, 6 may be preferable. However, there currently exists no such method that incorporates a measurement of flow velocity, which is required for computing MRO2 via Fick’s principle. Here, we interleaved a velocity-encoded golden-angle radial acquisition module preceding a T2-prepared balanced steady-state sequence.METHODS
To evaluate the applicability of the proposed method for MRO2 measurement we chose the brain where literature values exist from prior work based on TRUST 6 and SBO 2, 3. Superior sagittal sinus (SSS) was imaged, with its blood flow rate (SSSBF) and %HbO2 evaluated. Cerebral metabolic rate of oxygen (CMRO2) was estimated using Fick’s principle 7: $$$CMRO_2=C_{RBC}{\times}Hct{\times}tCBF{\times}(S_aO_2-S_vO_2)$$$, where CRBC is the oxygen carrying capacity of red blood cell (RBC). Hct and tCBF represent hematocrit and total cerebral blood flow rate normalized by brain weight. SaO2 and SvO2 represent fraction of oxygenated Hb in arterial and venous blood, respectively. CRBC is 22.02 μmol O2/mL RBC 8, and SaO2 was assumed to be 0.98. Hct was measured with blood sampled via finger prick (Hb 201+, Hemocue, Sweden), leaving only two variables to be measured: tCBF and SvO2. A ratio of 2 was found 9 between tCBF and SSSBF, and adopted in this study. Blood water T2 was quantified from T2-weighted images, and converted into SvO2 with a T2 calibration curve 10.Five healthy subjects (35±8 y-o, 1 female) were recruited after informed consent was obtained, and imaged at 1.5 T (Siemens Avanto) with a standard 12-channel head coil. MPRAGE was used for brain volume estimation, and brain weight was computed with tissue density of 1.05 g/cm3. The proposed T2-based oximetry (T2O) sequence (Fig. 1a) was developed using SequenceTree 11. The MLEV-4 scheme 12 was meant to induce T2 weighting, and 5 TEs were deployed. Balanced SSFP was employed for image acquisition, and a 3-parameter model 13 was adopted for T2 quantification. For better fitting robustness 13, an additional image with saturated magnetization (SAT) was acquired, leading to 6 images for a complete T2 measurement. The entire sequence was repeated six times resulting total scan time of 2.5 mins. SSSBF was measured using vendor-provided flow quantification sequence as reference for comparison.
Velocity encoding (VENC) was achieved by alternating two velocity-sensitive encoding gradients of equal gradient polarity (Fig. 1b). K-space was sparsely sampled with 6 segments (one segment per T2-preparation) of 204 spokes in total for one velocity map. A variable flip-angle scheme was used to minimize signal fluctuations since the acquisition takes place during saturation recovery. T2 preparation follows the background suppression 14 module (Fig. 1c) for attenuating static tissue signal over a wide T1 range (0.5~4 s). Scan parameters of each module are listed in Table 1.
Figure 2 shows the reconstruction process for flow velocity quantification. All radial spokes were included for coil sensitivity mapping, and sorted according to VENC states and repetitions. BART 15 (Berkley advanced Reconstruction Toolbox) was used for integrated reconstruction of parallel-imaging and compressed-sensing. Phase difference was calculated from the complex images and converted to velocity.
RESULTS
Representative flow velocity images are shown in Fig. 2 (right panel). Averaged velocity as well as flow rate of SSS were found using manually-drawn ROIs on the complex difference of the paired VENC images. Comparable blood flow rates were found as compared with reference results (Table 2). One set (out of 6 repetitions) of six background-suppressed T2-prepared images are shown in Fig. 3a. T2 values were found and converted to %HbO2. Combined with blood flow rates measured on SSS, CMRO2 was then computed (136±23 μmol/minute/100g, mean±S.D.). Quantitative results are summarized in Table 2.DISCUSSION AND CONCLUSION
The proposed approach jointly measured blood flow rate as well as blood water T2, and resolved the MRO2 of the target organ. The use of golden-angle radial acquisition, as compared with Cartesian sampling, provided an averaged measurement of flow velocity as all spokes passed through k-space center. For the same reason, motion correction can be applied to each segment for better tolerance of in-plane rigid-body motion. Where motion is complex and unpredictable (e.g. fetus motion), k-space sharing strategies 16 and dedicated regularized reconstruction techniques 17 can be employed on more sparsely-sampled segmented k-space data, such that corrupted data due to severe motion can be excluded. This acquisition scheme can be further employed for multi-directional velocity measurement, especially for other organs where the feeding/draining vessels are more tortuous (e.g. umbilical vein).In conclusion, our preliminary results suggested feasibility of combined measurements of flow velocity and T2 measurement as an efficient T2O method, which may be used for measurement of whole-organ MRO2.
Acknowledgements
NIH grant R21 EB022687References
- Hansell P, Welch WJ, Blantz RC and Palm F. Determinants of kidney oxygen consumption and their relationship to tissue oxygen tension in diabetes and hypertension. Clin Exp Pharmacol Physiol. 2013;40:123-37.
- Haacke EM, Lai S, Reichenbach JR, Kuppusamy K, Hoogenraad FG, Takeichi H and Lin W. In vivo measurement of blood oxygen saturation using magnetic resonance imaging: a direct validation of the blood oxygen level-dependent concept in functional brain imaging. Hum Brain Mapp. 1997;5:341-6.
- Fernandez-Seara MA, Techawiboonwong A, Detre JA and Wehrli FW. MR susceptometry for measuring global brain oxygen extraction. Magn Reson Med. 2006;55:967-73.
- Li C, Langham MC, Epstein CL, Magland JF, Wu J, Gee J and Wehrli FW. Accuracy of the cylinder approximation for susceptometric measurement of intravascular oxygen saturation. Magn Reson Med. 2012;67:808-13.
- Wright GA, Hu BS and Macovski A. 1991 I.I. Rabi Award. Estimating oxygen saturation of blood in vivo with MR imaging at 1.5 T. J Magn Reson Imaging. 1991;1:275-83.
- Lu H and Ge Y. Quantitative evaluation of oxygenation in venous vessels using T2-Relaxation-Under-Spin-Tagging MRI. Magn Reson Med. 2008;60:357-63.
- Kety SS and Schmidt CF. The Effects of Altered Arterial Tensions of Carbon Dioxide and Oxygen on Cerebral Blood Flow and Cerebral Oxygen Consumption of Normal Young Men. J Clin Invest. 1948;27:484-92.
- Yablonskiy DA, Sukstanskii AL and He X. Blood oxygenation level-dependent (BOLD)-based techniques for the quantification of brain hemodynamic and metabolic properties - theoretical models and experimental approaches. NMR Biomed. 2013;26:963-86.
- Rodgers ZB, Jain V, Englund EK, Langham MC and Wehrli FW. High temporal resolution MRI quantification of global cerebral metabolic rate of oxygen consumption in response to apneic challenge. J Cereb Blood Flow Metab. 2013;33:1514-22.
- Langham MC, Rodriguez-Soto AE, Schwartz N and Wehrli FW. In vivo whole-blood T-2 versus HbO(2) calibration by modulating blood oxygenation level in the femoral vein through intermittent cuff occlusion. Magnetic Resonance in Medicine. 2018;79:2290-2296.
- Magland JF, Li C, Langham MC and Wehrli FW. Pulse sequence programming in a dynamic visual environment: SequenceTree. Magn Reson Med. 2016;75:257-65.
- Levitt MH and Freeman R. Composite Pulse Decoupling. Journal of Magnetic Resonance. 1981;43:502-507.
- Akcakaya M, Basha TA, Weingartner S, Roujol S, Berg S and Nezafat R. Improved quantitative myocardial T-2 mapping: Impact of the fitting model. Magnetic Resonance in Medicine. 2015;74:93-105.
- Maleki N, Dai WY and Alsop DC. Optimization of background suppression for arterial spin labeling perfusion imaging. Magn Reson Mater Phy. 2012;25:127-133.
- Uecker M. mrirecon/bart: version 0.4.03. 2018. doi: 10.5281/zenodo.1215477.
- Song HK and Dougherty L. k-space weighted image contrast (KWIC) for contrast manipulation in projection reconstruction MRI. Magn Reson Med. 2000;44:825-32.
- Feng L, Grimm R, Block KT, Chandarana H, Kim S, Xu J, Axel L, Sodickson DK and Otazo R. Golden-angle radial sparse parallel MRI: combination of compressed sensing, parallel imaging, and golden-angle radial sampling for fast and flexible dynamic volumetric MRI. Magn Reson Med. 2014;72:707-17.
Figures

Fig. 1 Interleaved T2-based MR oximetry sequence (a), along with velocity-encoded radial acquisition (b), and background suppression (c). In (a), a non-selective saturation pulse ‘resets’ the magnetization history before background suppression and T2-preparation. In (b), the gradient configuration in Gz alternates VENC states. Note that the radial-encoding scheme was the same for both VENC states (dark green line in Gx and Gy). Background suppression (c) reduces signal contamination from static tissues due to partial volume effect.

Table 1. Scan parameters for each module in T2O sequence.
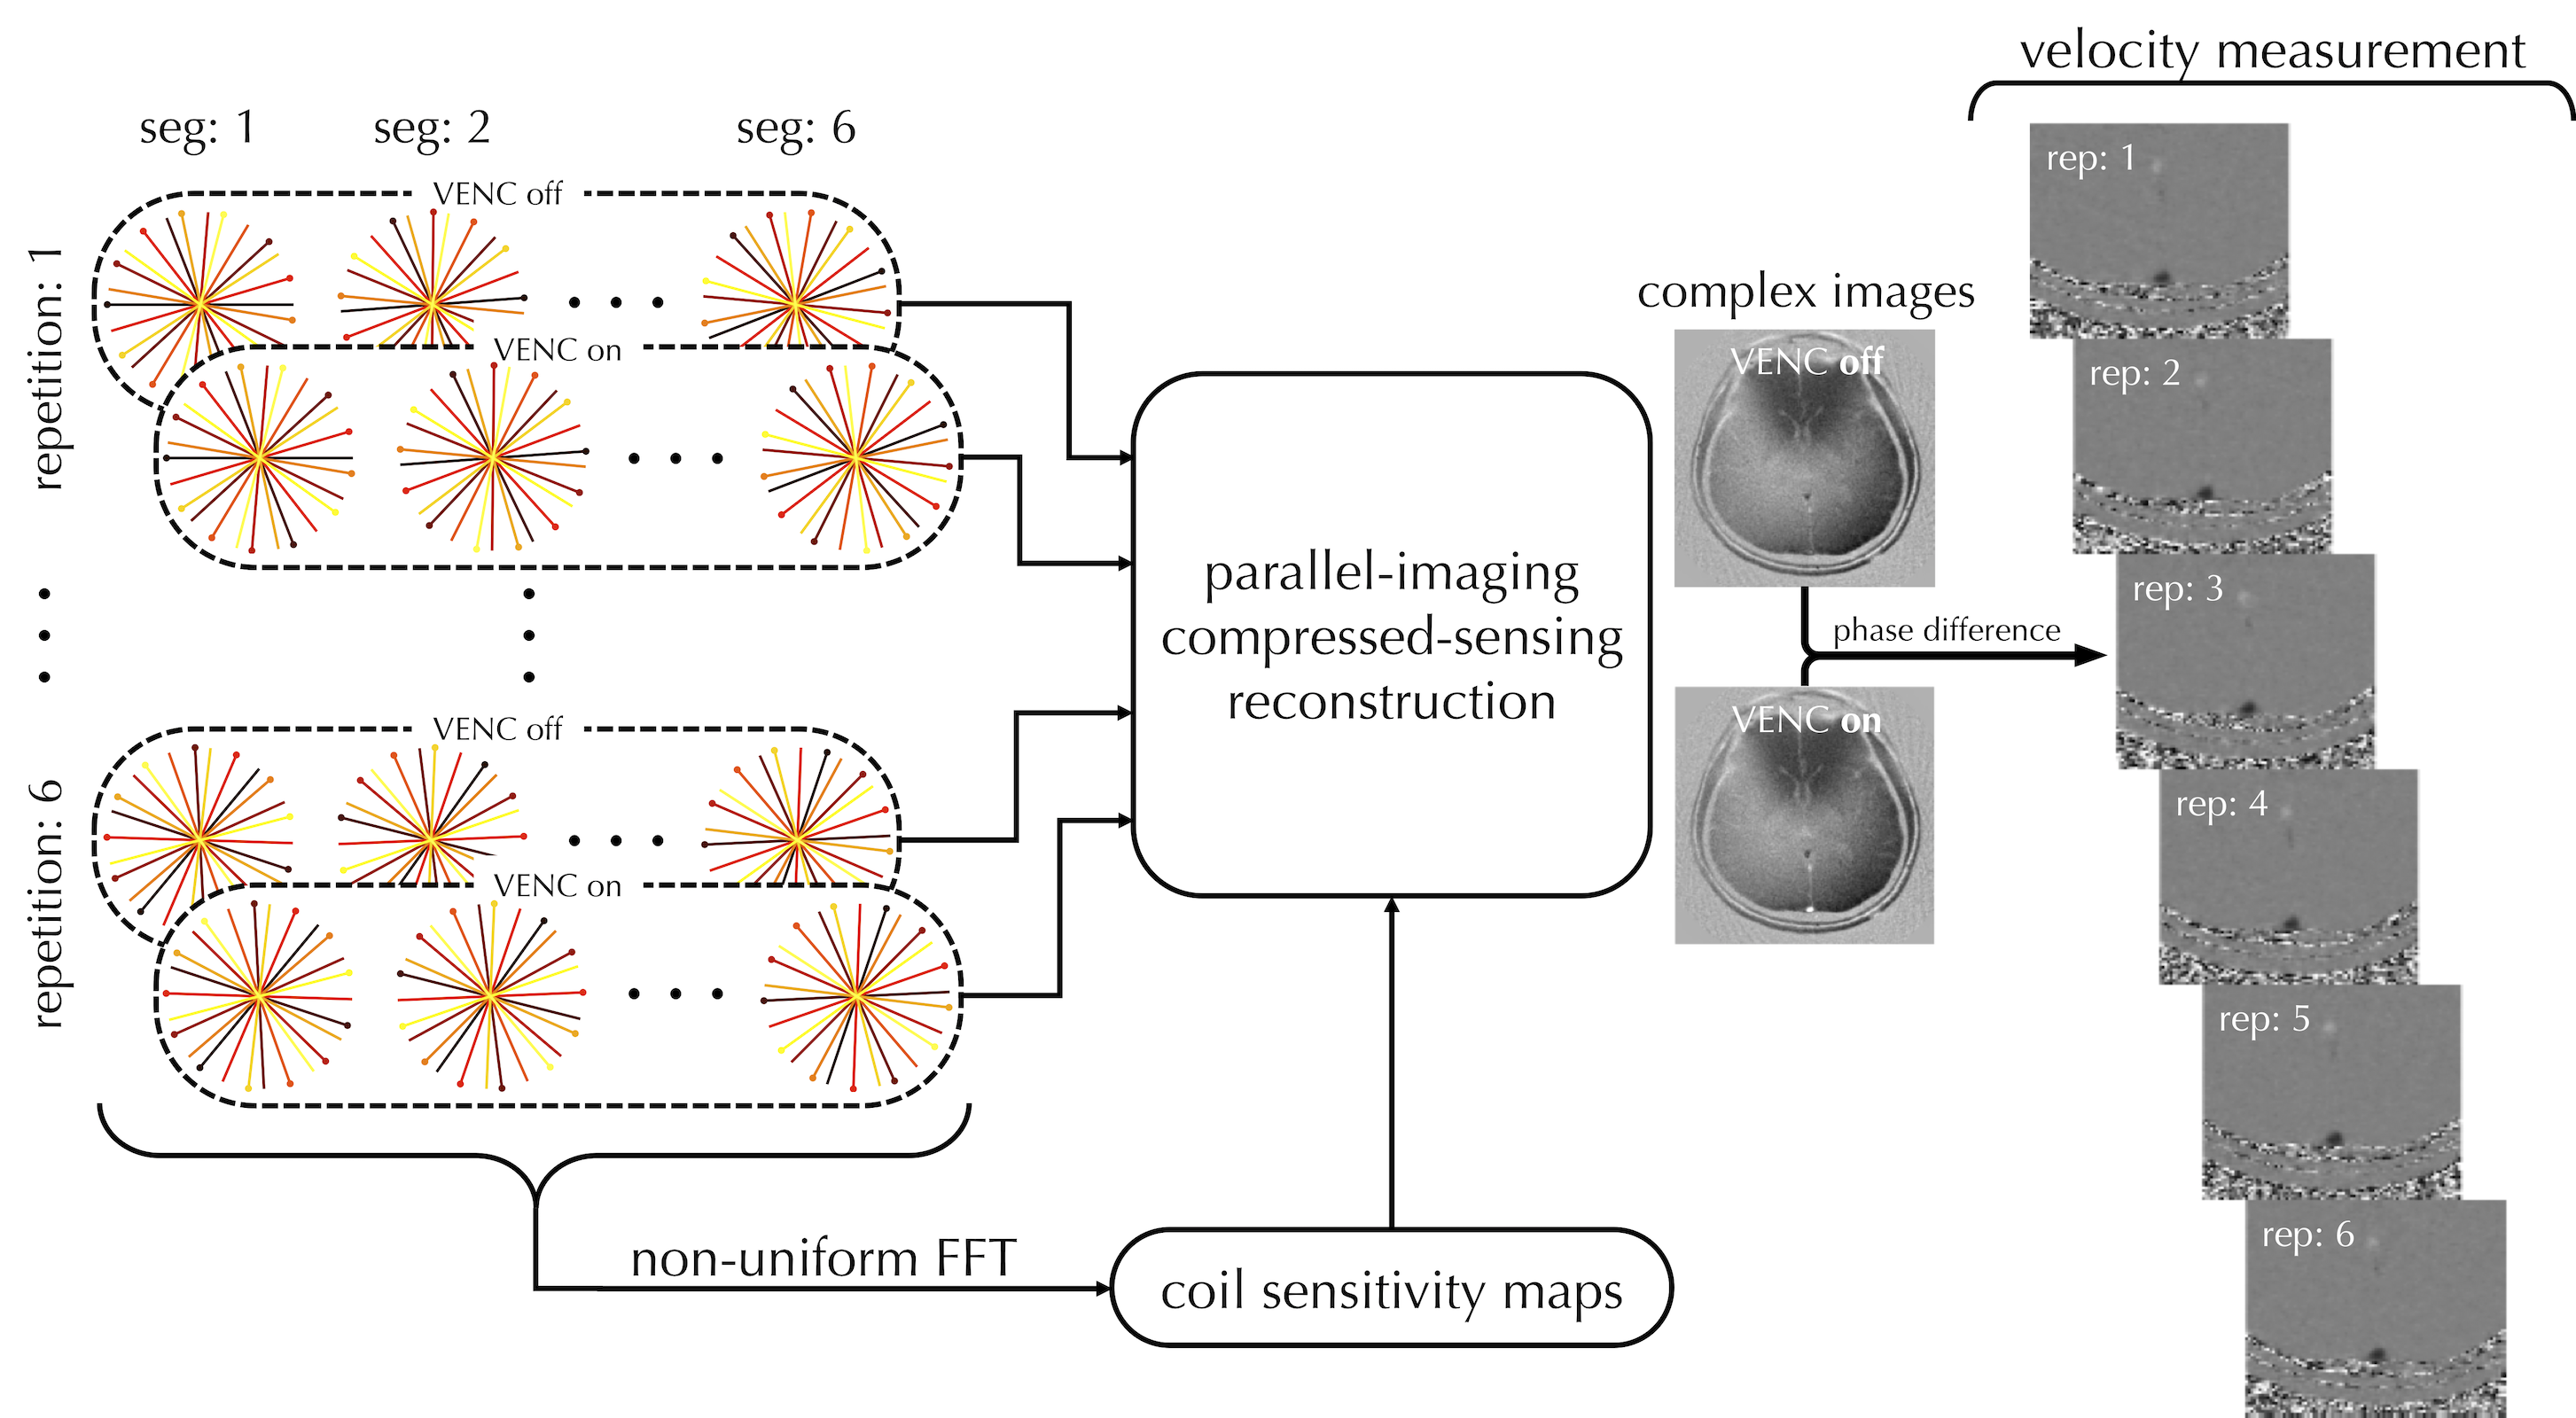
Fig. 2 Workflow for the reconstruction of velocity-encoded golden-angled radial acquisition. All radial spokes are included to generate coil sensitivity maps, while k-space data within each repetition are sorted depending on VENC states before parallel-imaging compressed-sensing reconstruction is applied to generate a pair of complex, velocity-encoded images. Velocity maps are then generated by taking the phase differences of these images. Representative velocity maps are shown in the right panel.

Fig. 3 Series of T2-weighted bSSFP images (a) with 5 different nominal TE settings, plus an additional SAT image. The background suppression effectively attenuates signal from static tissues, not only highlighting regions of flowing blood but also reducing partial volume effects from the surrounding tissues. In (b) averaged signal intensity within SSS is plotted along effective TE (TEeff), with colored ‘o’ markers indicating different repetitions. The dashed black line shows the T2 relaxation curve with the average T2 measurement over all six repetitions.
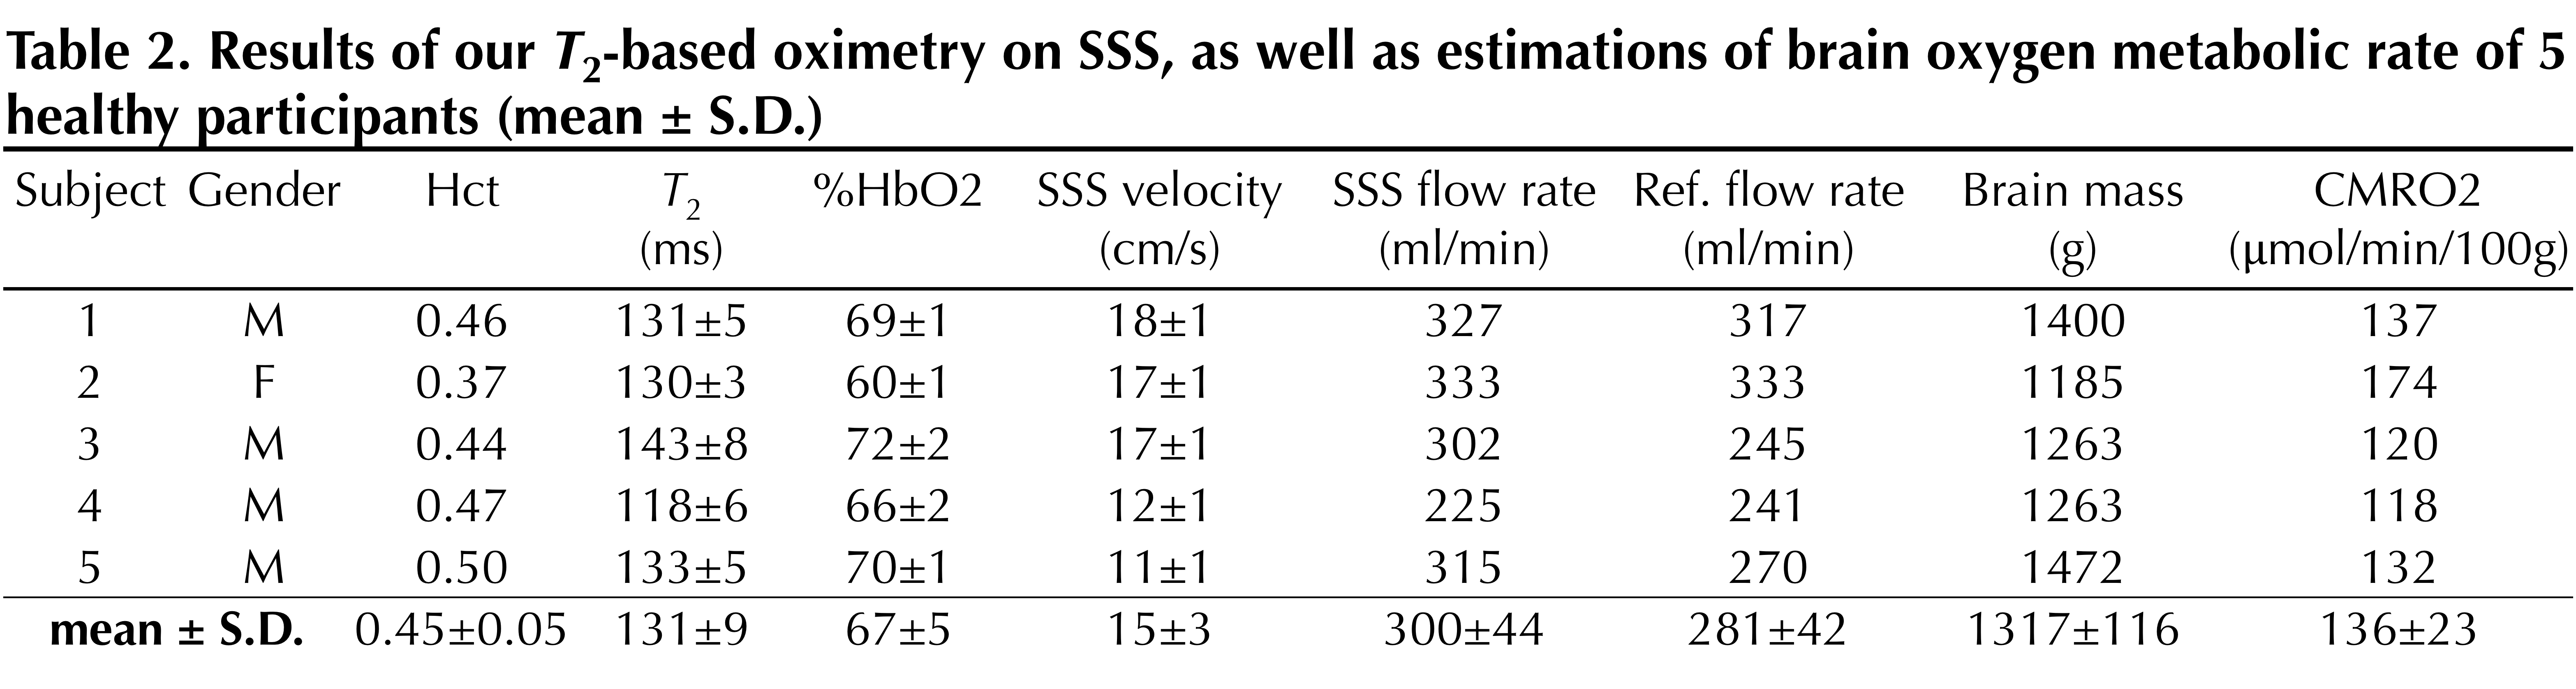
Table 2 Results of our T2-based oximetry on SSS, as well as estimations of brain oxygen metabolic rate of 5 healthy participants (mean ± S.D.)