0893
7T in-vivo human T2* mapping at 350μm isotropic resolution using ME-GRE with flow artifact mitigation reveals cortical layers & vessels1Cognitive Neuroscience, Maastricht University, Maastricht, Netherlands
Synopsis
Spatial misencoding of the vascular signal due to flow is an imaging artifact that presents a significant challenge for in vivo MRI at high resolutions (≤0.5mm). Here we propose a method for mitigating this artifact in multi-echo gradient recalled echo (ME-GRE) images at 350μm isotropic resolution by applying 90° rotations to their phase-encoding direction. After applying our method, we demonstrate clearly visible stria of Gennari, intracortical veins, and pial vessels while mitigating the flow artifact. In addition, we report T2* estimates of several human brain tissues (artery, vein, gray/white matter, CSF) in-vivo which are valuable for future hemodynamic signal modeling.
Introduction
Spatial misencoding of the vascular signal due to flow is an imaging artifact presenting a significant challenge for in vivo MRI [1] at high resolutions (≤0.5mm). In this artifact, the signal of the flowing spins appears to move away from their true location [2] which can lead to incorrect (quantitative) T2* estimations. This flow artifact is especially problematic for high resolution in-vivo MR histology [3]. Although flow compensation is available [4], there is no method for multiple echoes (>2). Here we propose a flow artifact mitigation method for multi-echo gradient recalled echo (ME-GRE) images after applying 90° rotations in their phase-encoding direction.Methods
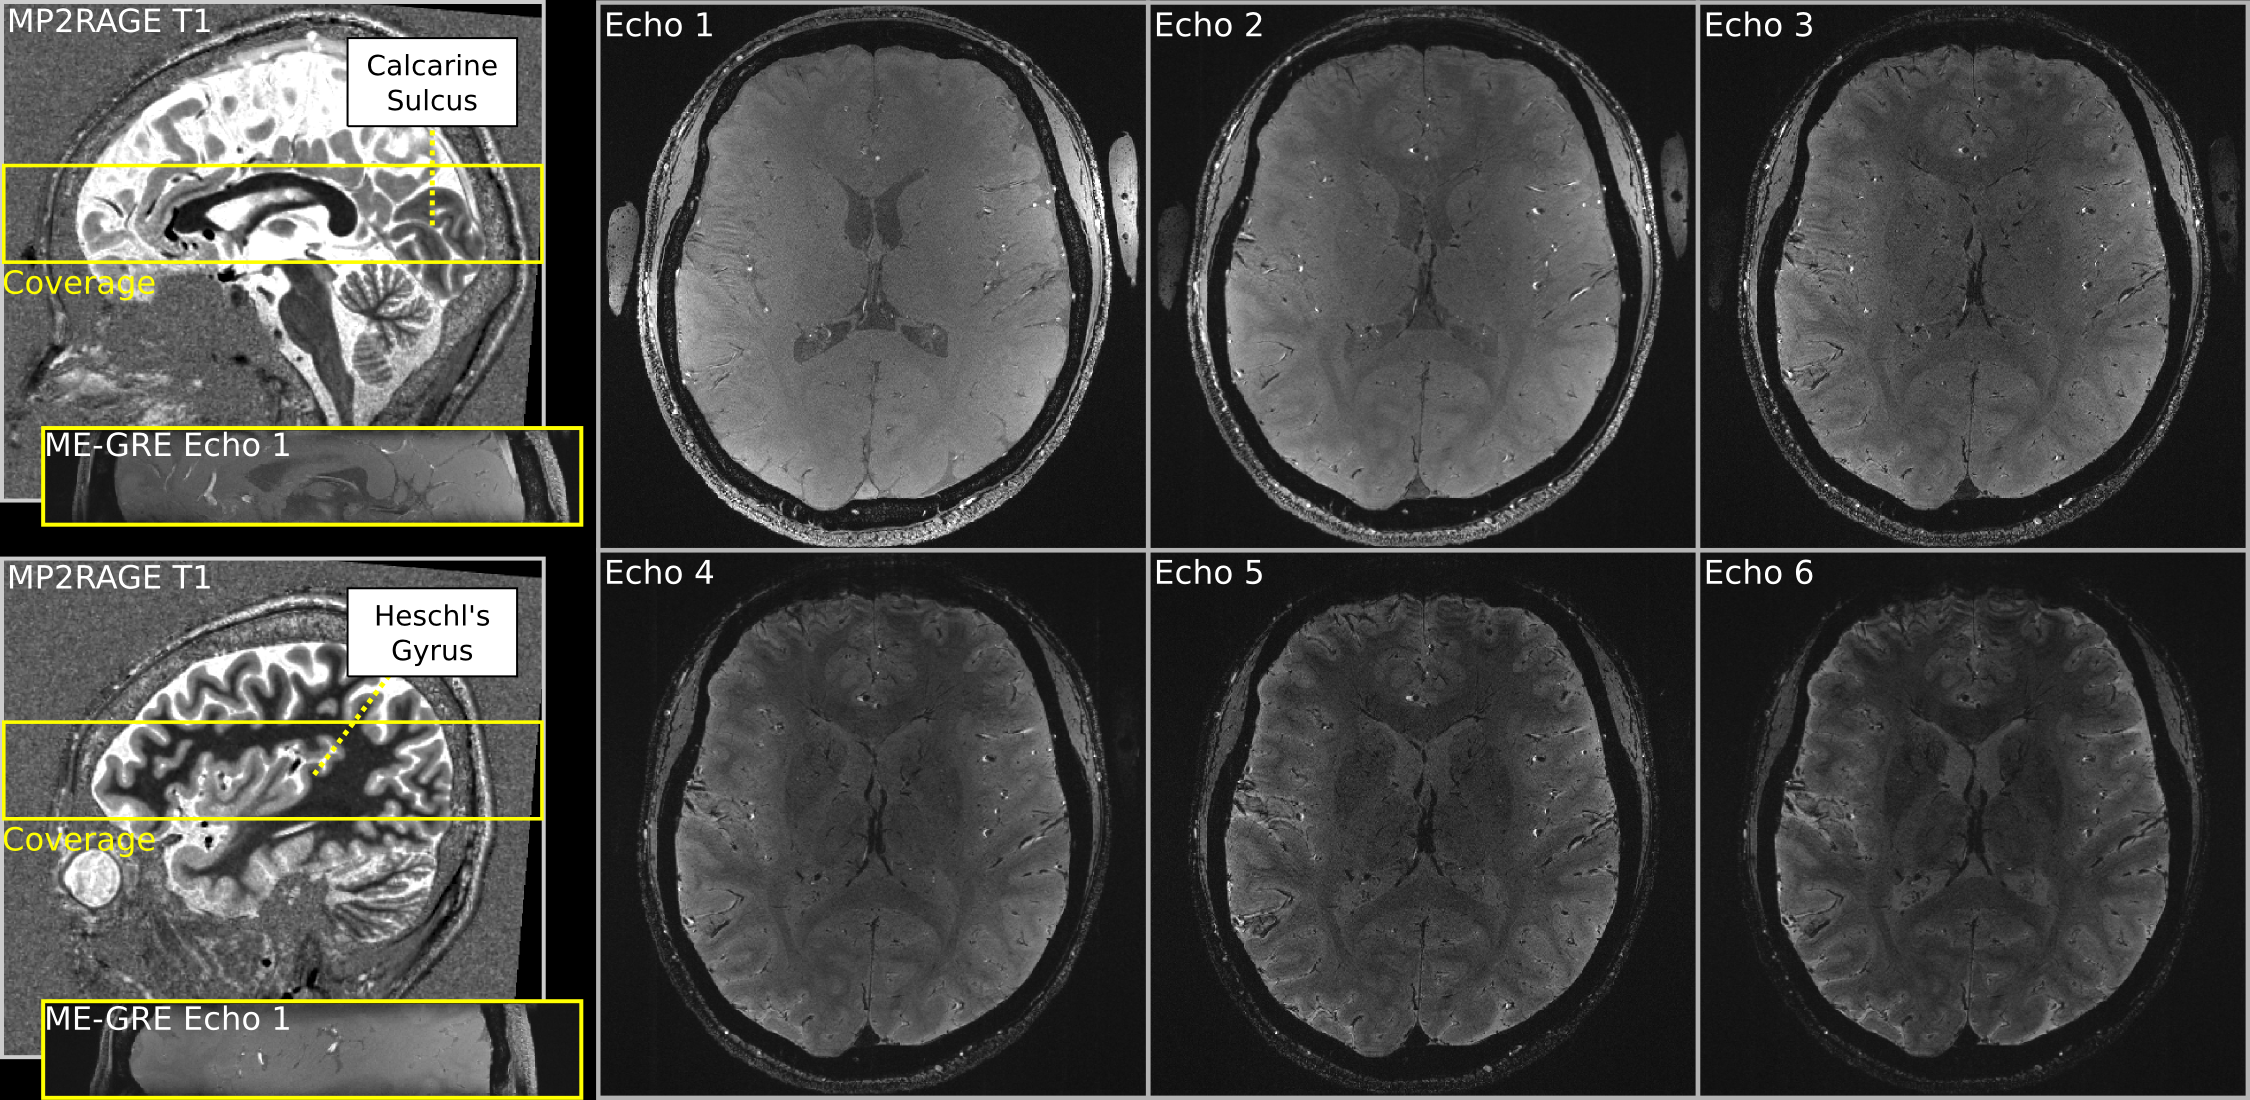
We acquired data from one volunteer (28, female) at 7 Tesla (Siemens) using a 32-channel head coil (NOVA Medical) and 3D ME-GRE with bipolar readout (350μm isotropic resolution; TR=30ms; TE1-6=[3.83, 8.20, 12.57, 16.94, 21.31, 25.68]ms; α=11°; elliptic k-space filling; 14min.). Figure1 shows the coverage (FoV=201.6×201.6×36.4mm3). Two dielectric pads containing a 25% suspension of barium titanate in deuterated water were placed proximal to the temporal lobe to locally increase the transmit B1+ field for improving its homogeneity [5]. Four ME-GRE images were acquired in one session. We changed the phase-encoding direction by 90° (R-L, A-P, L-R, P-A) in each acquisition. The 90°-changes were introduced in order to control the direction of the flow artifact [2] which appears as spatial signal shift along the vector component of the flow direction on readout axis. Note that odd and even numbered echoes in each acquisition had opposite readout directions due to the bipolar readout.We also acquired a whole-brain T1 image using 3D MP2RAGE [6] (650μm isotropic resolution; TR/TE/TI1/TI2=5000/2.46/900/2750ms; α1/α2=5°/3°; FoV=208×208×156mm3).
Our processing pipeline aimed at reducing three sources of artifacts while improving the signal-to-noise ratio (SNR): (i) head motion across acquisitions, (ii) spatial distortions due to readout direction changes across echoes, (iii) spatial misencoding of the vascular signal due to flow.
The distortion introduced by bipolar readouts between odd- and even-numbered echoes [7] was corrected by registering odd and even echoes with the same readout polarity. Then, the images with the same phase-encoding axes (R-L & L-R [Mx] or A-P & P-A [My]) were motion corrected and averaged to increase SNR. Keeping the data with different phase encoding axes (Mx, My) separate was deliberate in order to avoid mixing different flow artifacts effects.
To mitigate the flow artifacts we used compositing (piecing together a new image by using parts of multiple other images). Since the artifact induced by the misencoding of vascular flow is different across images with 90° phase-encoding direction difference, it is possible to compose a new set of echoes by selecting the signal of each voxel from a set that is not affected by the artifact (a voxel affected by the artifact in Mx will not be affected in My). For voxels that were not affected in either Mx or My phase-encoding axis, the signal was averaged.
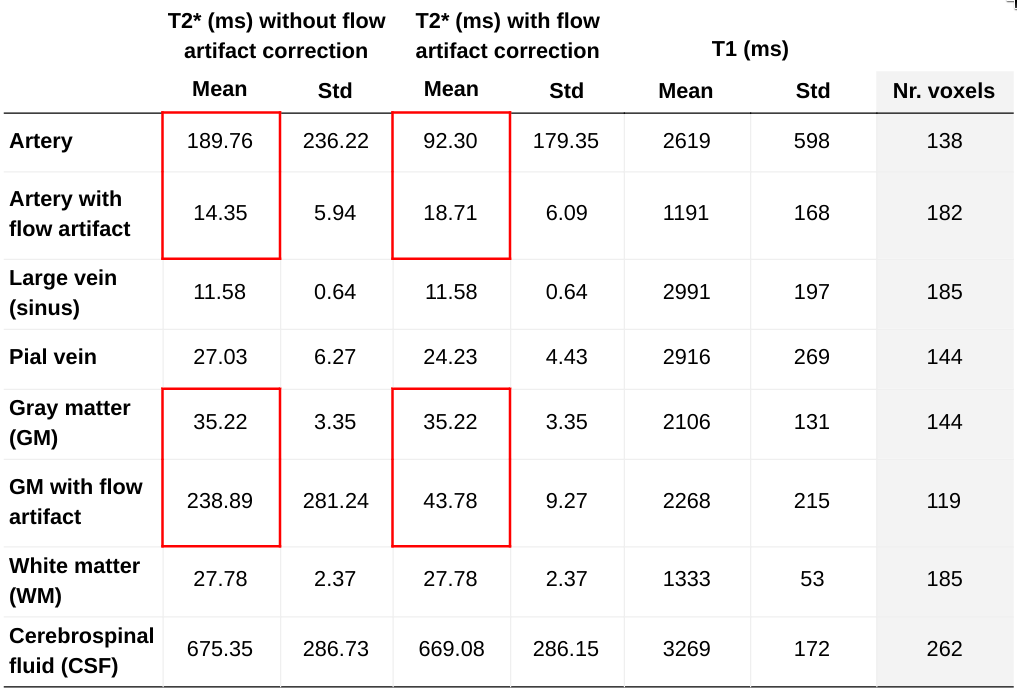
Then, we estimated quantitative T2* in representative arteries/veins, gray/white matter, and cerebrospinal fluid by fitting a mono-exponential decay. To highlight the confounding effect of the flow artifact on the T2* estimation, we also report values for arteries and gray matter affected by the flow artifact before correction.
Results
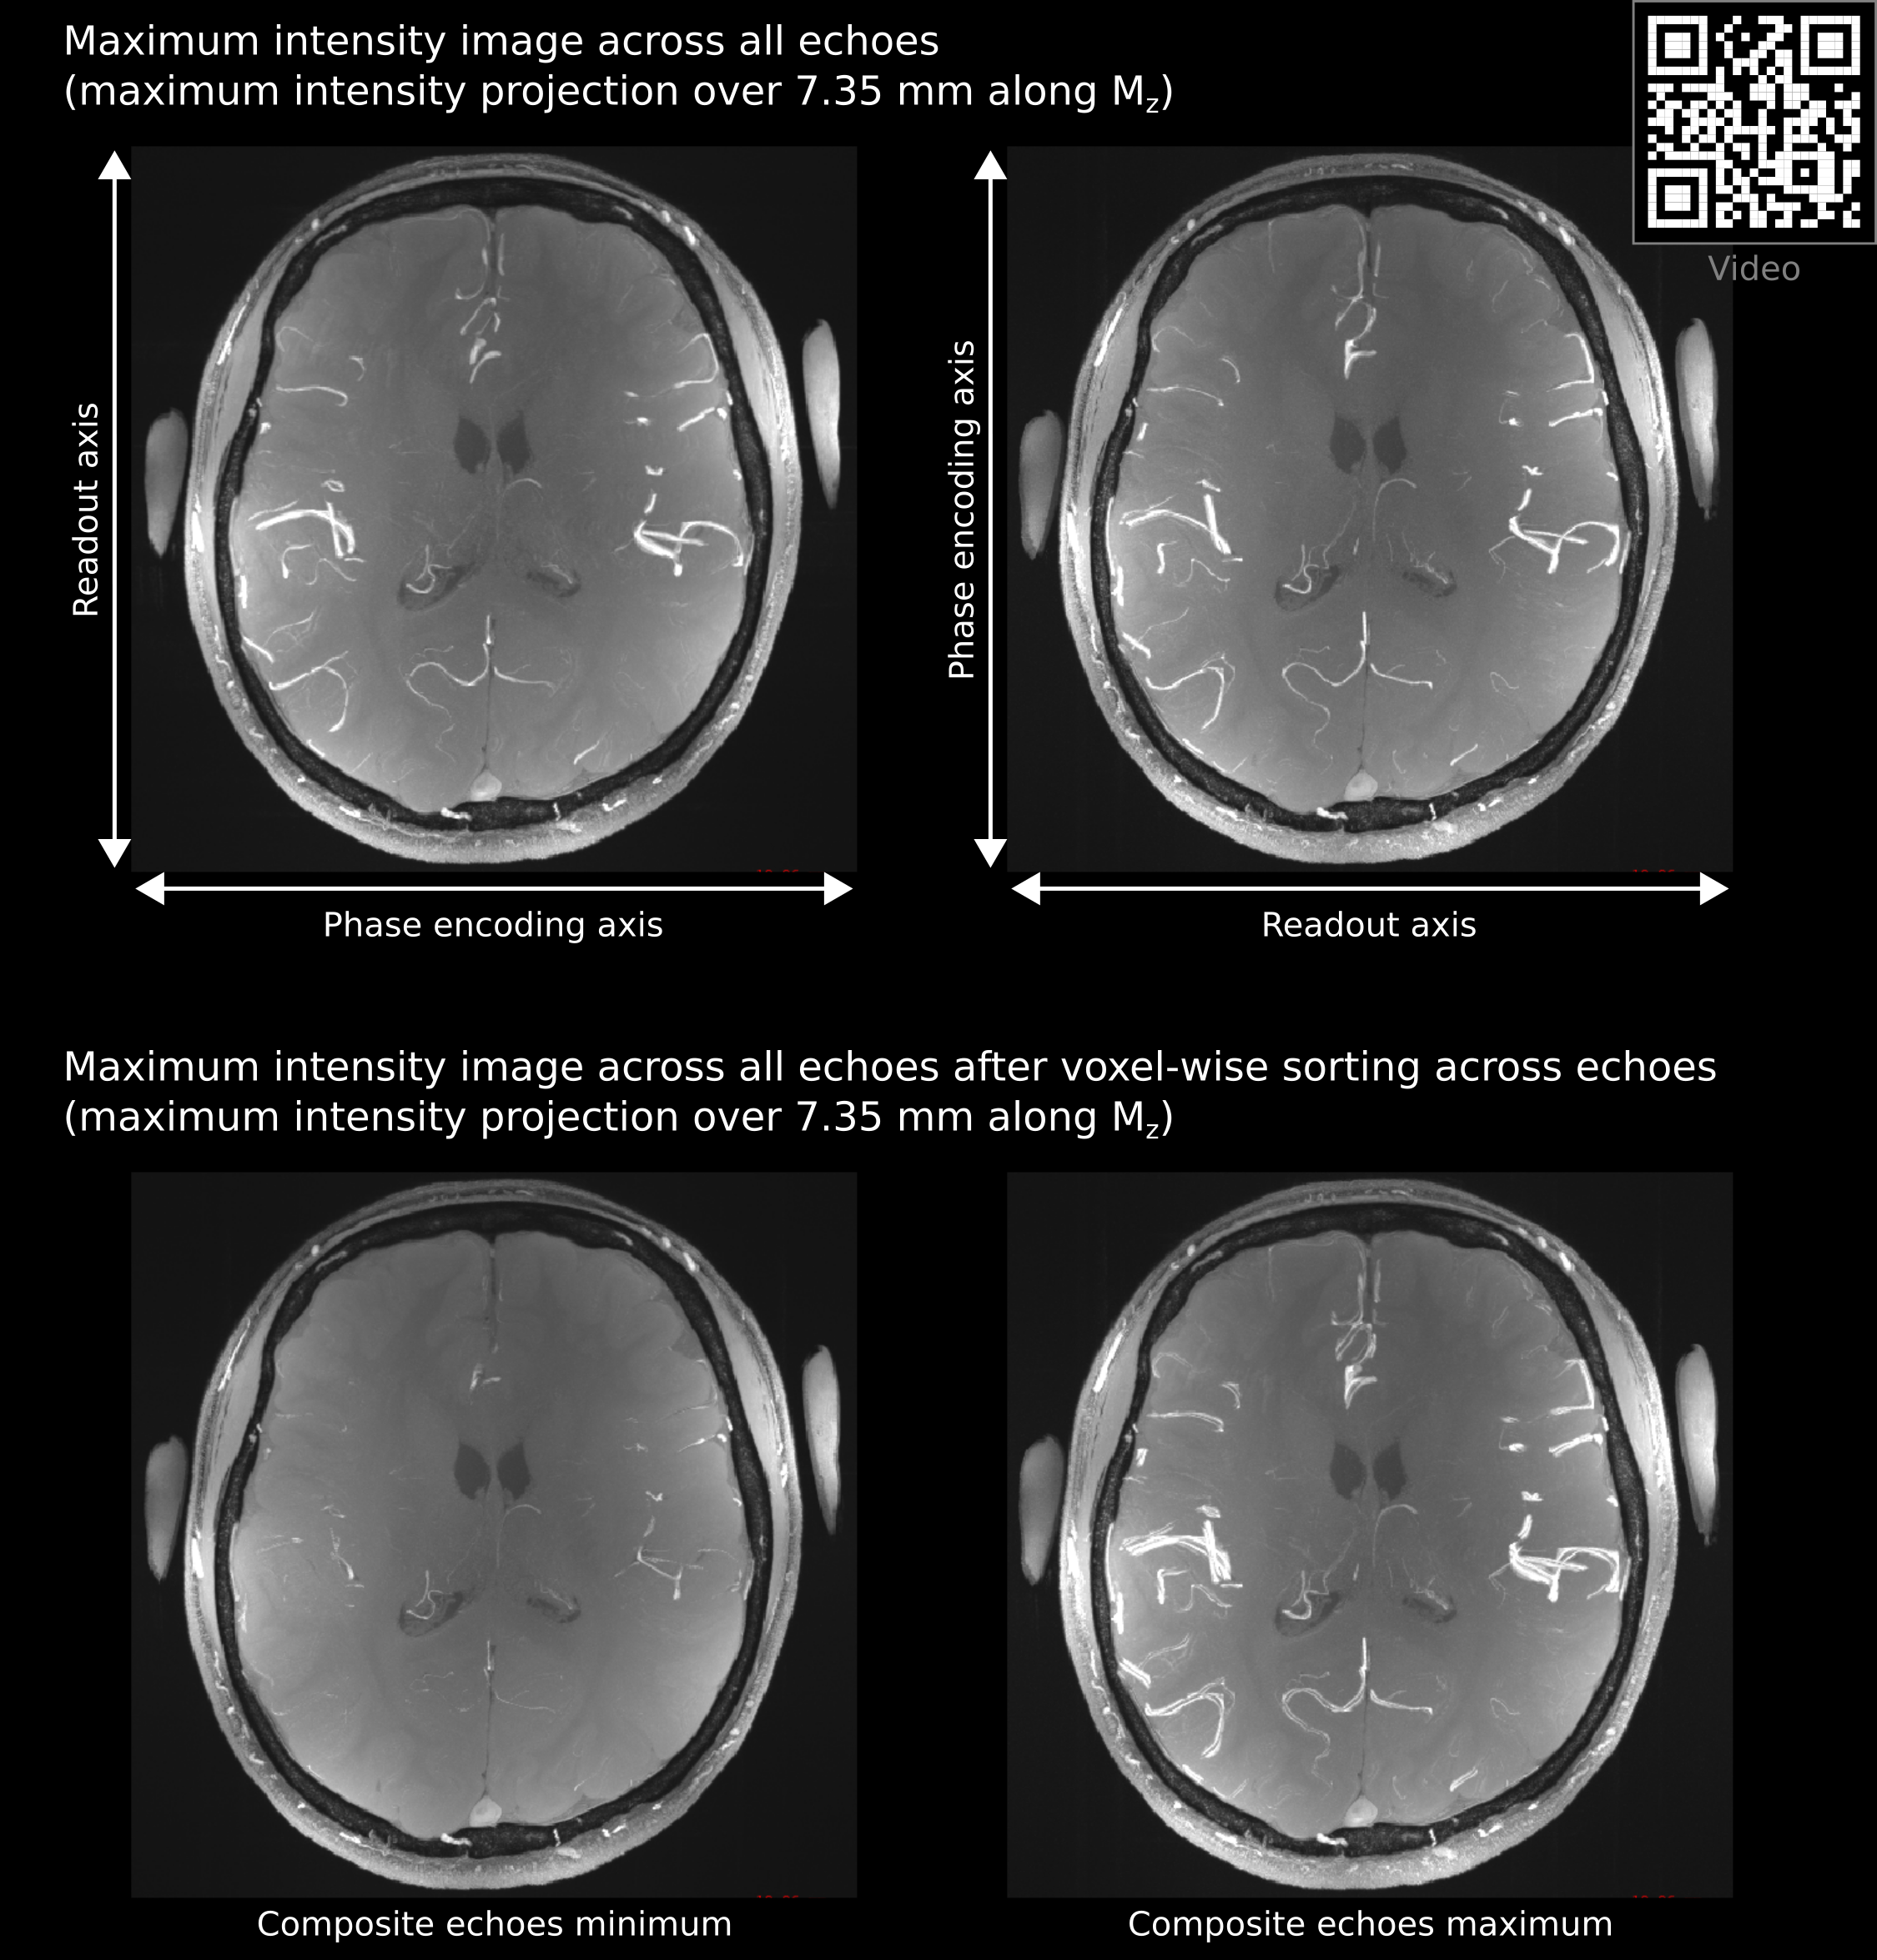
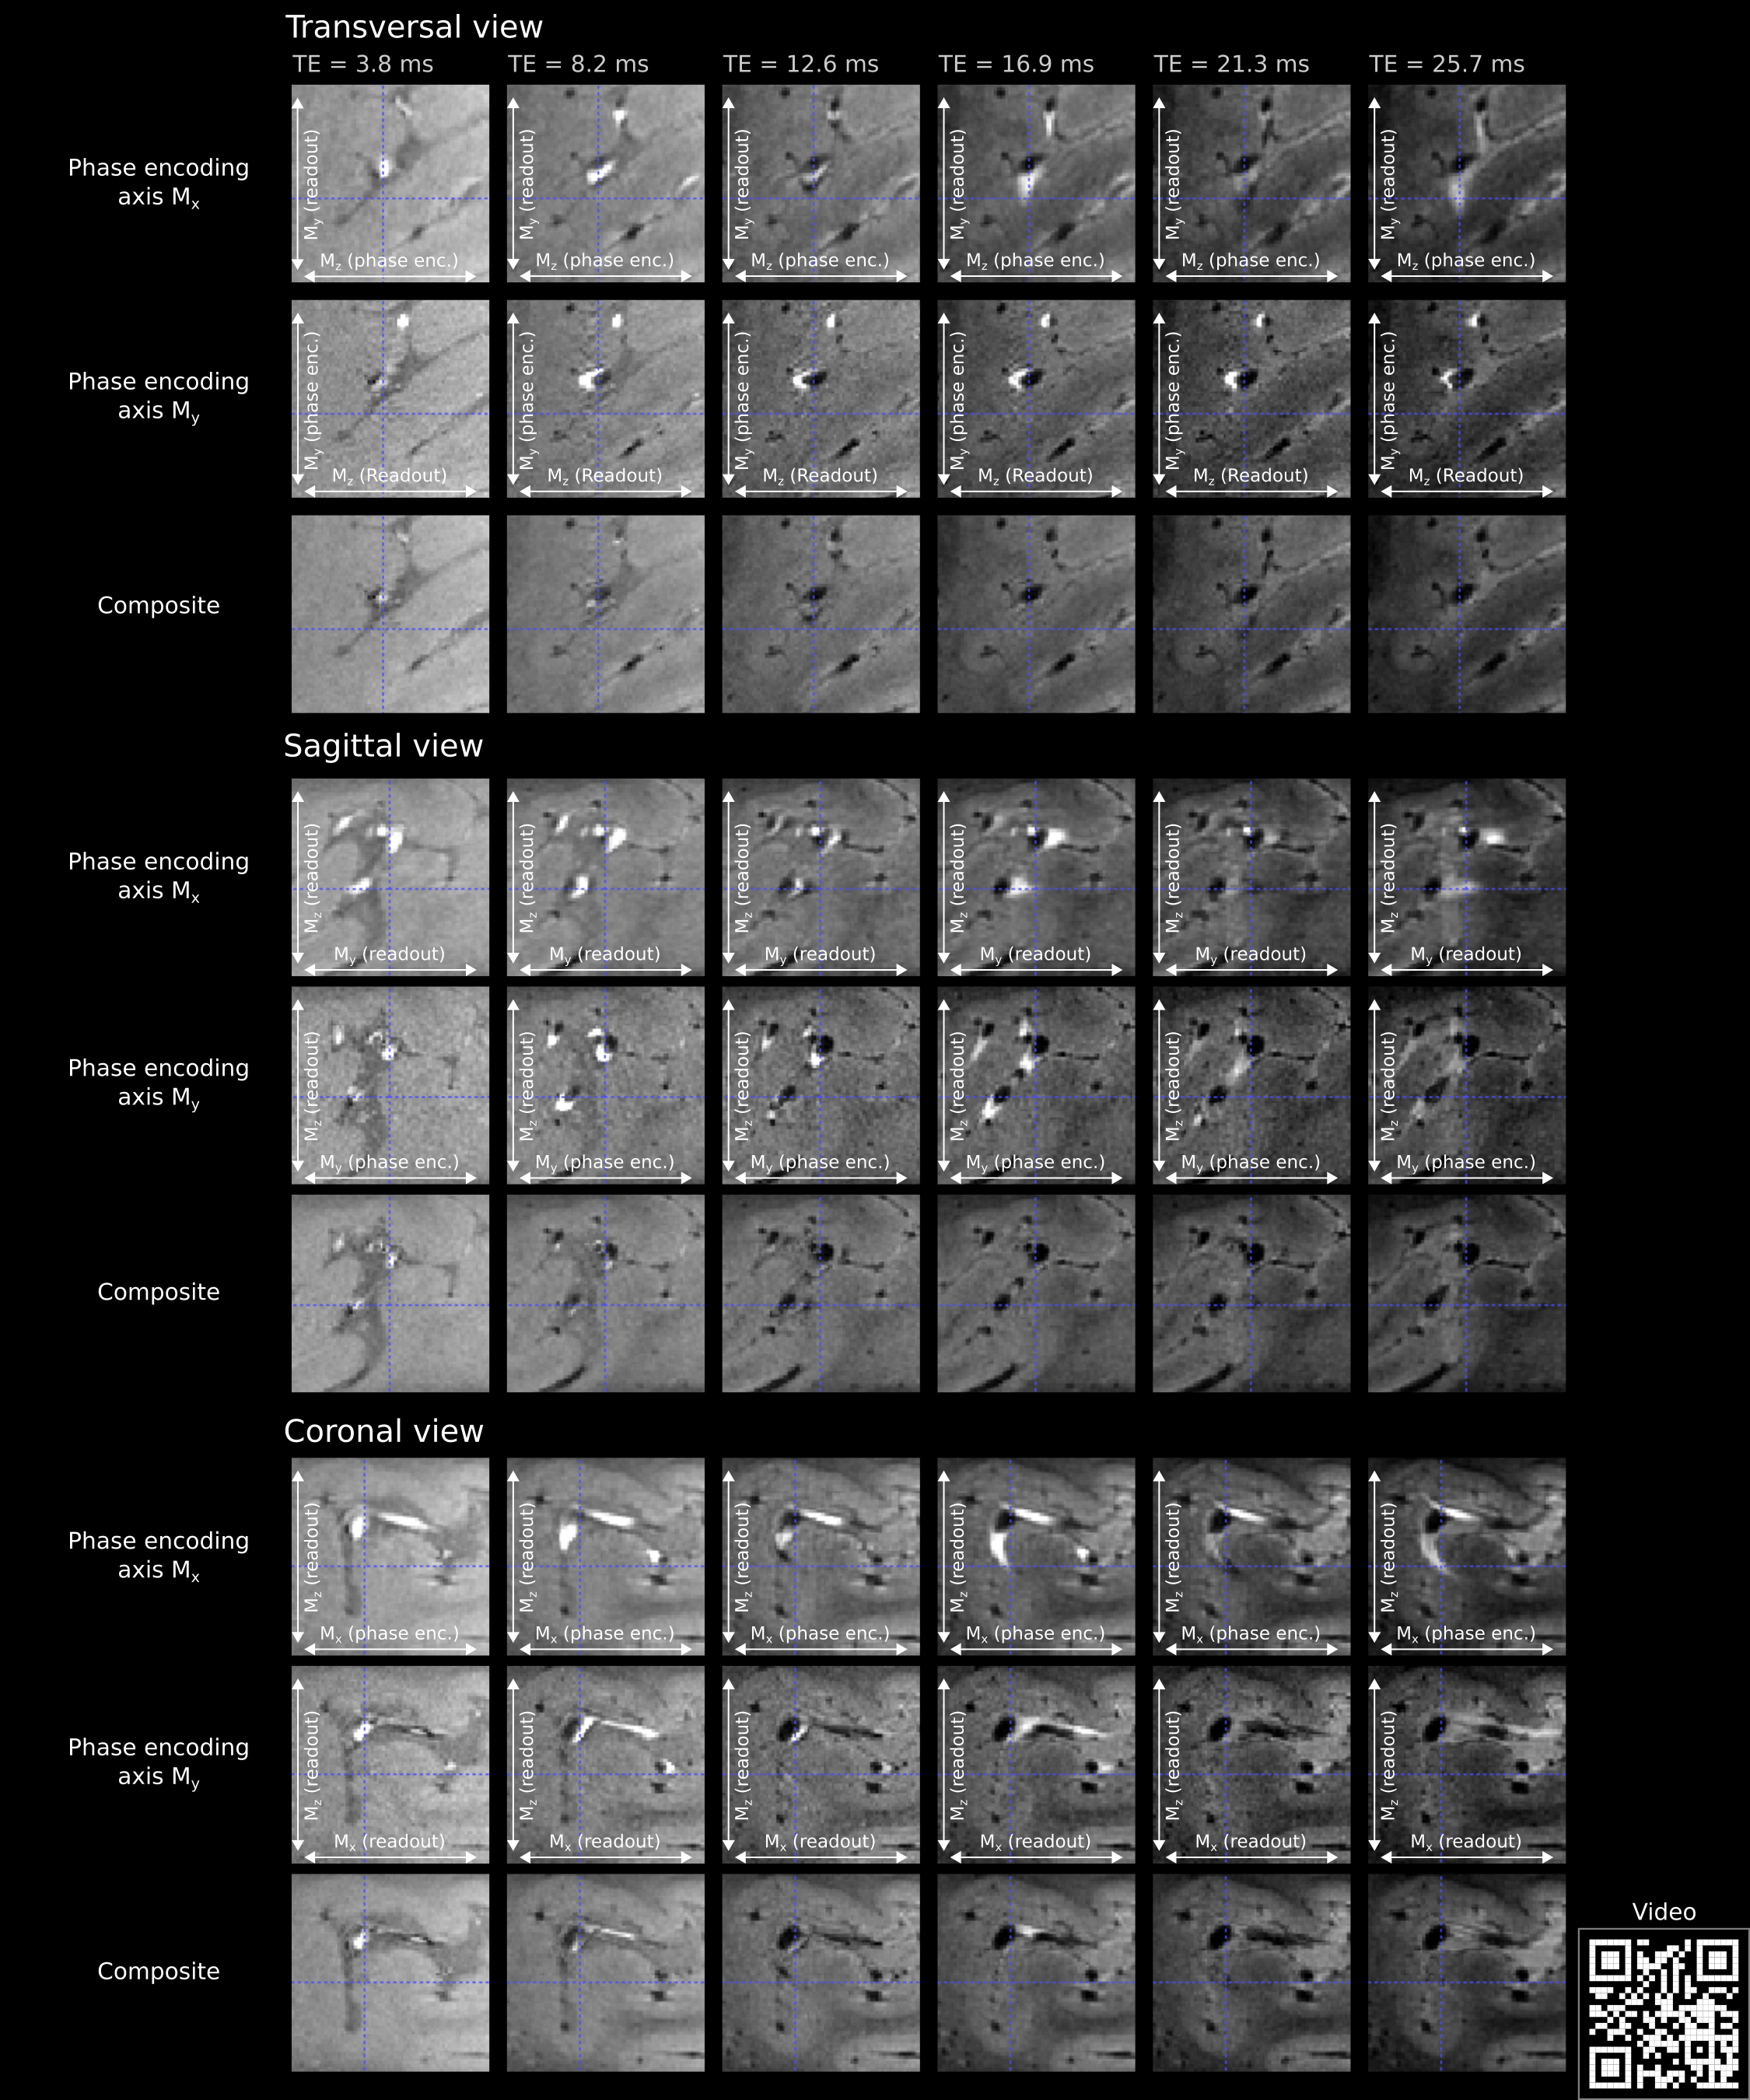
Figure2 (top row) shows the extent of the flow artifact visible around large arteries. Figure3 shows the evolution of the flow artifact across echoes in images acquired with 90° phase-encoding direction difference. Note again the different direction of vascular signal displacement across images with 90° phase-encoding direction difference. Figure3 also shows the effect of flow artifact mitigation by compositing. See that the flow artifact (i.e. the bright arterial signal moving across echoes) is mostly gone in all panels.Figure4 shows T2* estimates for different tissues. The flow artifact changes the T2* estimates around half an order of magnitude. However, this confound is compensated by our flow artifact mitigation procedure.
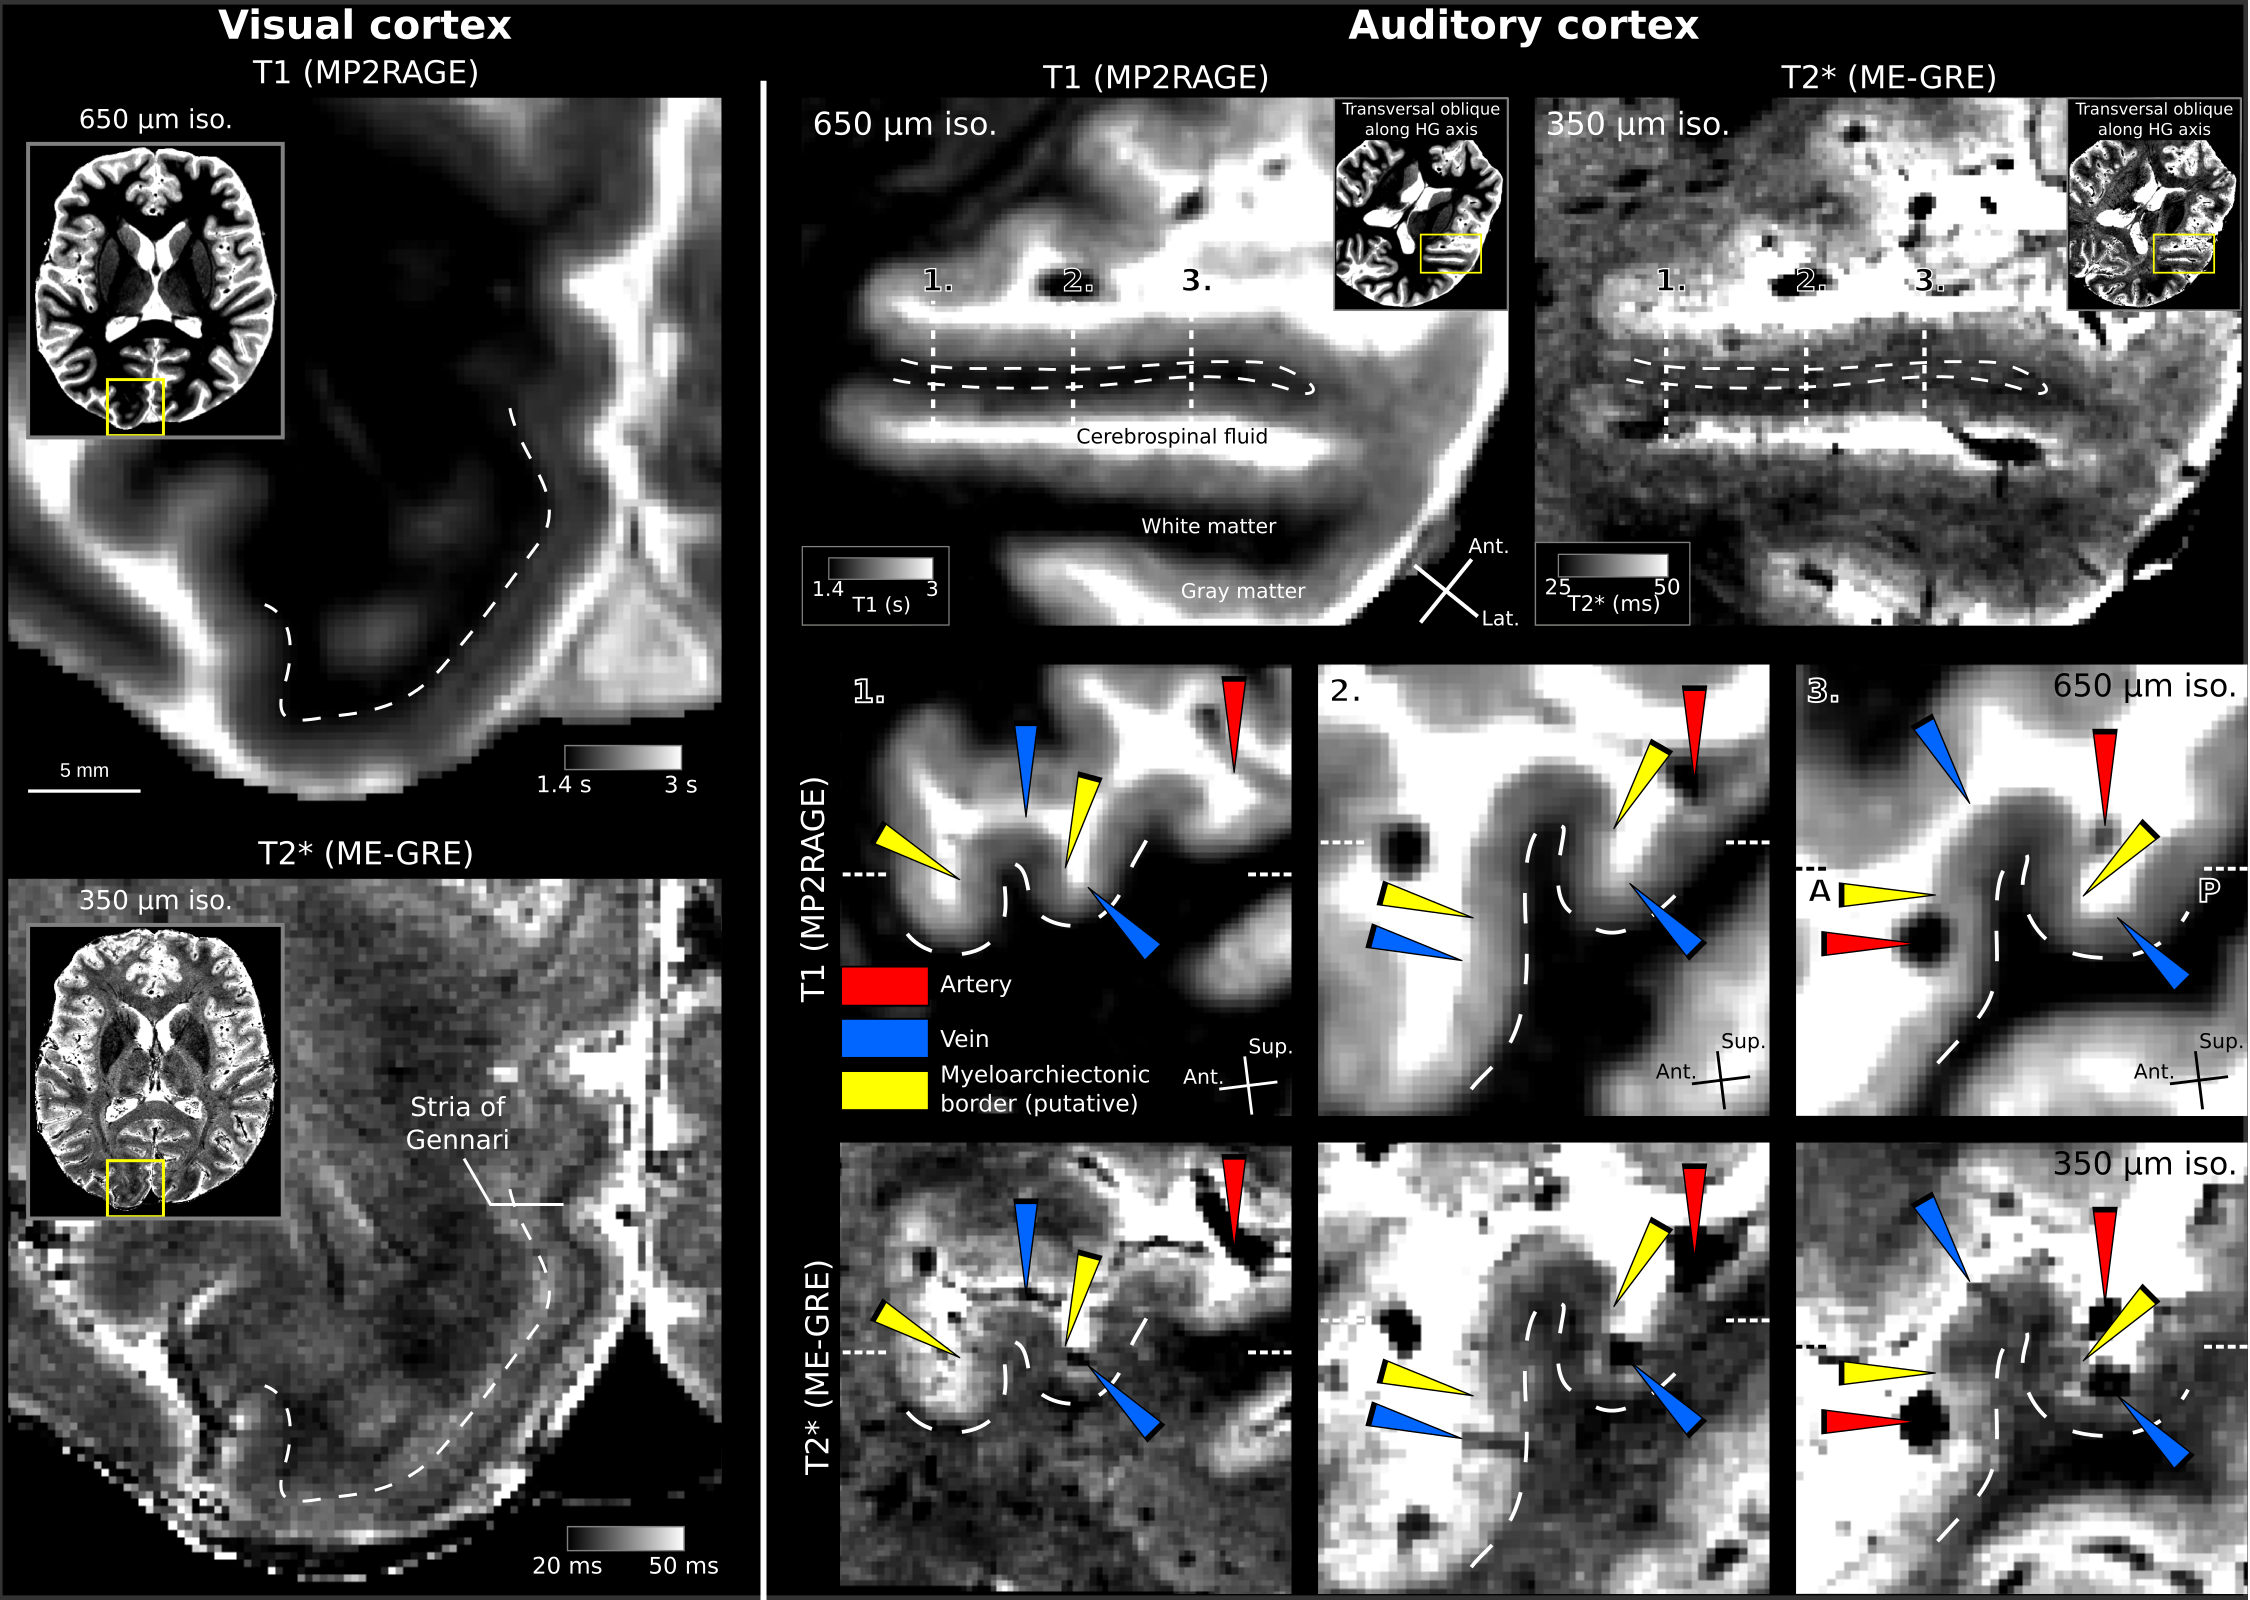
Our pipeline allows clearly visible stria of Gennari, other intracortical layers/veins, and pial vessels (see Figure5).
Discussion
Our results show that using compositing on ME-GRE data after applying 90° rotations in their phase-encoding direction is an effective and straightforward way of mitigating the spatial miscoding of the vascular signal due to flow [1, 2]. Our quantitative T2* measurements show that arteries which are subject to the flow artifact appear to have a very rapid signal decay (as expected). Arteries which are less subject to the flow artifact (arteries with flow direction along the phase encoding axis) give more realistic estimates of arterial T2*. Our measurements demonstrate that gray matter T2* estimates can also be (locally) inflated by the misencoding due to flow.Conclusion
Accounting for the spatial misencoding of the vascular signal due to flow [1, 2] is highly relevant for high resolution in vivo MRI because this artifact can prevent accurate gray matter T2* estimates. By mitigating this artifact, we show more accurate quantitative T2* estimates in gray matter, white matter, vessels, and cerebrospinal fluid. T2* estimates of all these tissues that are less affected by partial voluming at 350μm isotropic resolution are essential for future hemodynamic signal modeling work [8, 9, 10].Acknowledgements
We thank Natalia Petridou, Frederic Dick, and Laurentius Huber for their valuable comments on earlier versions of this work.References
[1] Wehrli, F. W. (1990). Time-of-flight effects in MR imaging of flow. Magnetic Resonance in Medicine, 14(2), 187–193.
[2] Larson, T. C., Kelly, W. M., Ehman, R. L., & Wehrli, F. W. (1990). Spatial misregistration of vascular flow during MR imaging of the CNS: cause and clinical significance. AJR. American Journal of Roentgenology, 155(5), 1117–1124.
[3] Weiskopf, N., Mohammadi, S., Lutti, A., & Callaghan, M. F. (2015). Advances in MRI-based computational neuroanatomy: from morphometry to in-vivo histology. Current Opinion in Neurology, 28(4), 313–322.
[4] Deistung, A., Dittrich, E., Sedlacik, J., Rauscher, A., & Reichenbach, J. R. (2009). ToF-SWI: simultaneous time of flight and fully flow compensated susceptibility weighted imaging. Journal of Magnetic Resonance Imaging : JMRI, 29(6), 1478–1484.
[5] Teeuwisse, W. M., Brink, W. M., & Webb, A. G. (2012). Quantitative assessment of the effects of high-permittivity pads in 7 Tesla MRI of the brain. Magnetic Resonance in Medicine, 67(5), 1285–1293.
[6] Marques, J. P., Kober, T., Krueger, G., van der Zwaag, W., Van de Moortele, P.-F., & Gruetter, R. (2010). MP2RAGE, a self bias-field corrected sequence for improved segmentation and T1-mapping at high field. NeuroImage, 49(2), 1271–1281.
[7] Cohen-Adad, J. (2014). What can we learn from T2* maps of the cortex? NeuroImage, 93 Pt 2, 189–200.
[8] Uludağ, K., Müller-Bierl, B., & Uğurbil, K. (2009). An integrative model for neuronal activity-induced signal changes for gradient and spin echo functional imaging. NeuroImage, 48(1), 150–165.
[9] Havlicek, M., & Uludag, K. (2019). A dynamical model of the laminar BOLD response. NeuroImage, 116209.
[10] Petridou, N., & Siero, J. C. W. (2019). Laminar fMRI: What can the time domain tell us? NeuroImage, 197(February 2017), 761–771.
Figures