0891
Bloch Modelling Enables Robust T2 Mapping using Retrospective Proton Density and T2-weighted Images from Different Vendors and Sites1Biomedical Engineering, University of Alberta, Edmonton, AB, Canada
Synopsis
Differences in pulse sequences between vendors can result in variation in T2 mapping, if not accounted for. We show that Bloch simulation based Indirect and Stimulated Echo Compensation minimizes these differences in T2 maps across different scanners. In contrast, standard exponential fitting results in highly variable T2 values across MR systems even if echo and repetition times are identical. By overcoming errors in T2 quantification through sequence modelling, T2 mapping can be applied in studies across multiple sites and vendors.
Introduction
The combination and comparison of data across multiple sites and vendors is essential for large group MRI studies, and for testing the robustness of clinical methods. However, the reliability of data derived from multiple sites relies on pulse sequence equivalence. In particular, standard T2 mapping from multiple spin-echoes is highly dependent on the refocusing flip angles and transmit field homogeneity, when an exponential fit is used. However, modelling of the pulse sequence with knowledge of the refocusing angles can yield accurate T2 values by accounting for the effects of stimulated echoes.1 A common approach to T2 mapping is the use of a dual-echo proton density (PD) and T2-weighted imaging sequence. However, inter-site studies have noted systematic differences between vendors in T2 maps calculated from exponential fitting.2 Indirect and Stimulated Echo Compensation (ISEC) using Bloch simulation of Fast Spin Echo sequences has been shown to produce robust T2, when flip angles are known.3 Here we examine T2 mapping variation for a multi-site brain MRI study using both standard exponential fitting and Bloch-ISEC modelling.Methods
Data: Brain MRI datasets acquired at 3T on 12 healthy controls were obtained retrospectively from ADNI-1 (Alzheimer's Disease Neuroimaging Initiative) with six each from two major manufacturers: Siemens Medical Systems and General Electric (GE) Healthcare, matched for age and sex (mean age 74 years). All studies used a 2D dual-echo fast/turbo spin echo sequence with parameters: TE1eff=10.0–12.8ms, TE2eff=95–103 ms, TR 3000ms, echo train length 14-16, echo spacing 10.0–12.8 ms, 48 slices, voxel size 3.0 x 0.94 x 0.94 mm3, and acquisition time 5 min. Although most parameters were very similar, Siemens used a train of 165°-150°-150°..., while GE used either constant 125° refocusing train, or a variable flip refocusing angle train.The ADNI-1 study also included a 3D calibration scan using the body coil for transmitting and receiving, enabling an approximation of B1+ shape. Scan parameters were: TEeff 1.0ms, TR 3.3ms, voxel size 2.5 x 2.3 x 2.3 mm3, flip angle 2°, and acquisition time 42 sec. ADNI-1 calibration scans were replicated on a Siemens 3T for three additional subjects to compare the extracted B1+ shape to rigorous B1+ mapping using the Bloch-Siegert approach acquired in the same session.
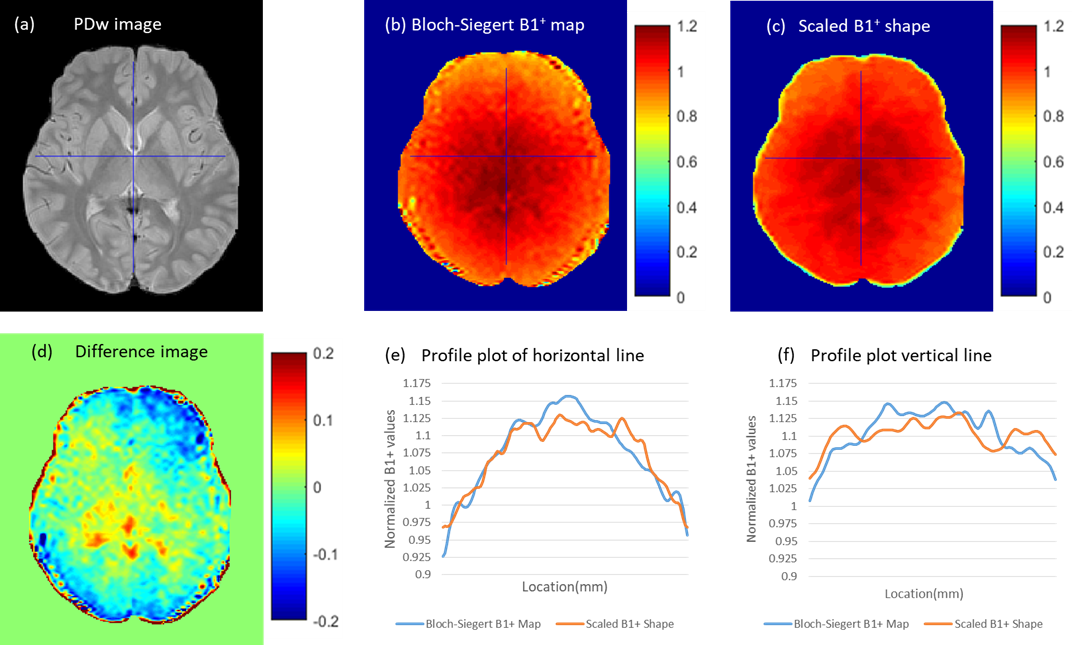
Predicting B1+ maps from calibration data: Ignoring proton density and minimal T1 relaxation effects, and noting the small 2° flip angle, signal intensity S of the calibration scan using body coil transmit (B1+) and body coil receive (B1-) is proportional to S ∝ B1- * B1+. Further simplification can be made by assuming B1- = B1+ in the brain at 3T, hence the B1+ shape can be estimated simply by √S ∝ B1+.
B1+ shapes calculated from the calibration scan of the three validation subjects were scaled and compared against their respective Bloch-Siegert B1+ maps. The resulting scaling factor was applied to all B1+ shapes obtained from each ADNI subject. B1+ shapes and Bloch-Siegert B1+ maps were co-registered and resliced to FSE’s native space using SPM12.
T2 mapping and Analysis: T2 maps were generated by applying Bloch-ISEC fitting using the dual-echo PD and T2-weighted images and the estimated B1+ maps, as previously described.3 T2 maps were also generated by fitting the dual-echo data directly with an exponential decay function. All simulations and fitting methods were performed using in-house MATLAB (R2016b, 64 bit) code. T2 maps were compared between methods using whole brain histograms.
Results
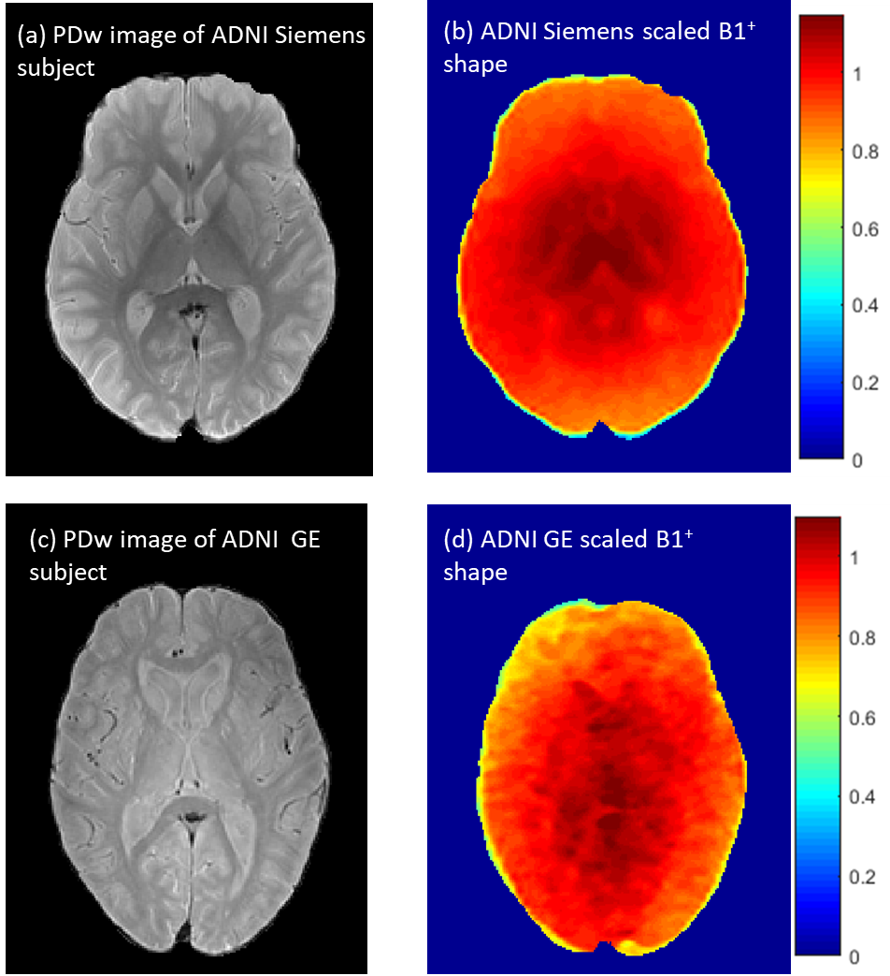
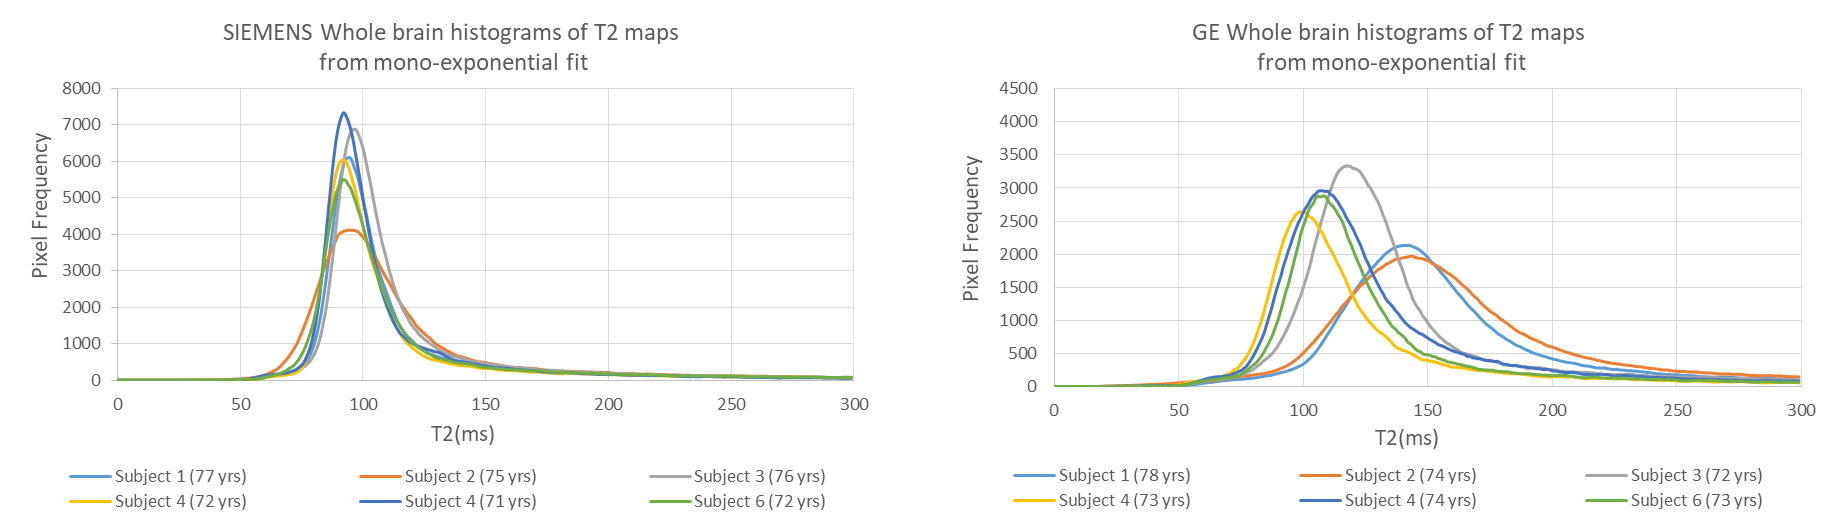
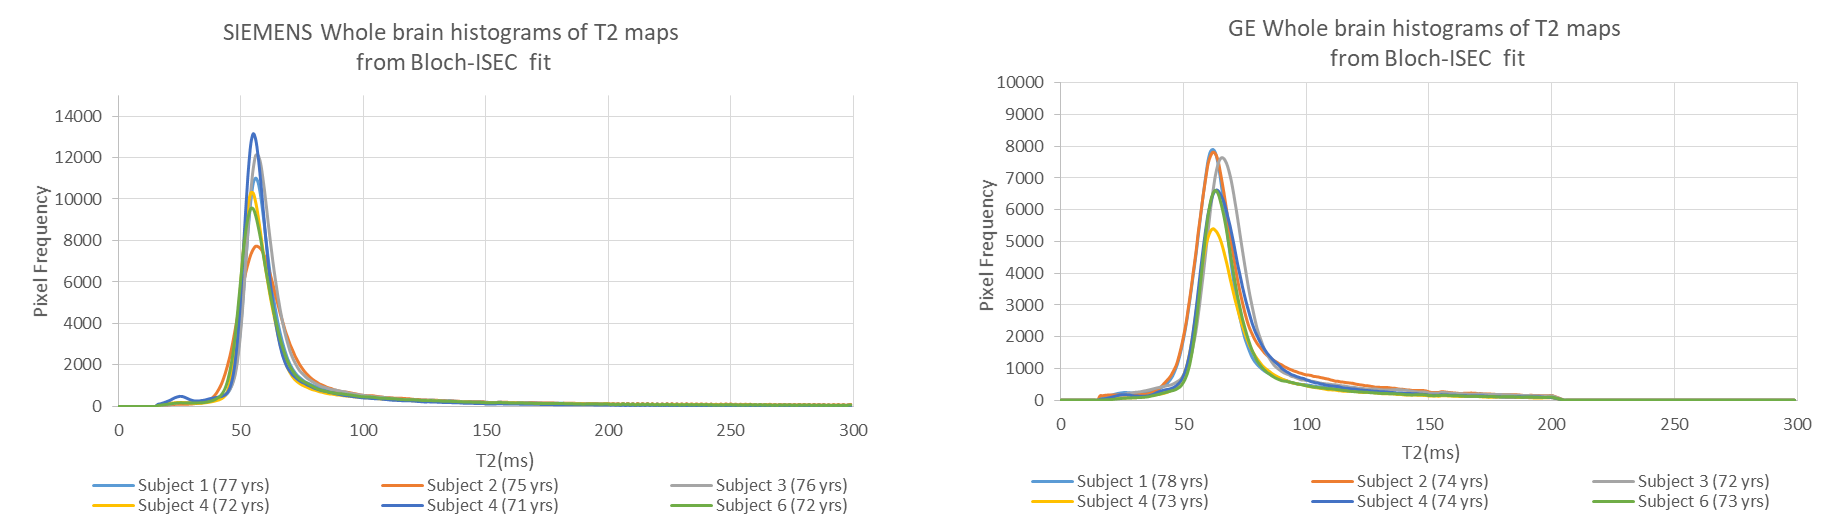
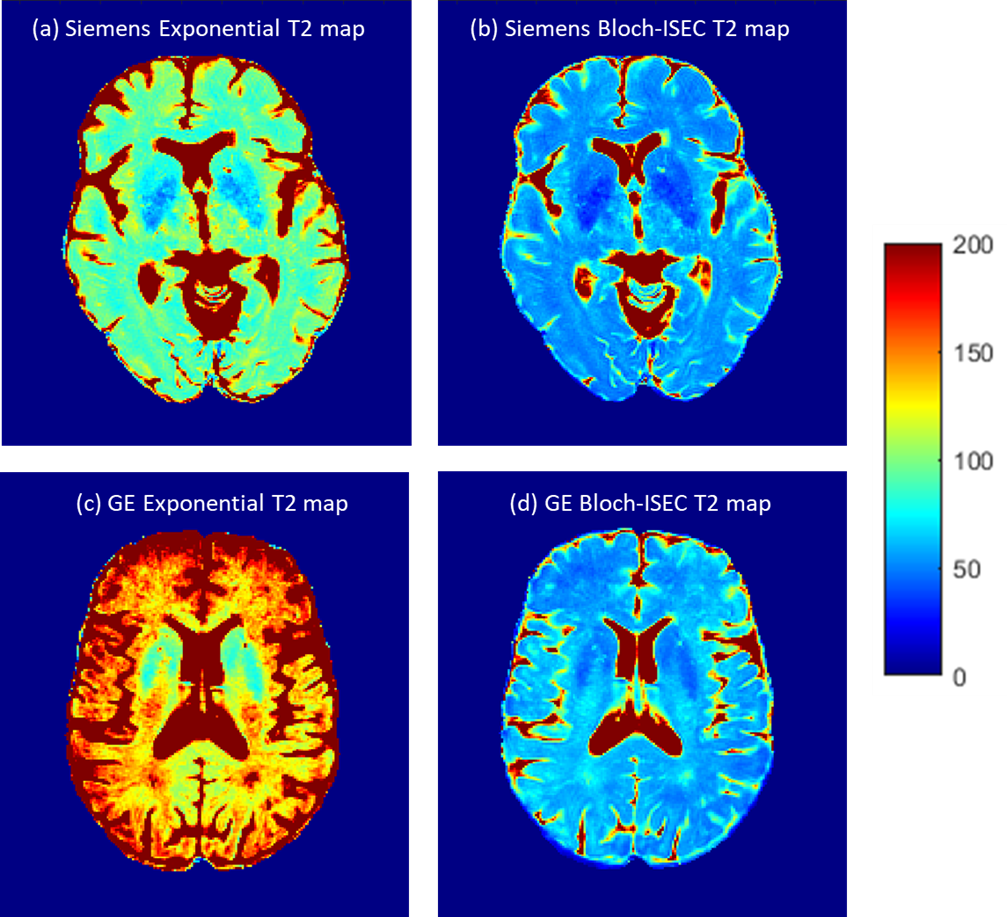
Comparison of normalized Bloch-Siegert B1+ map to the scaled B1+ shape map (Figure 1) demonstrates that the shape maps estimate the actual B1+ maps. Example scaled B1+ shape maps for Siemens and GE subjects are illustrated in Figure 2.Whole brain histograms of T2 values from exponential fitting (Figure 3) show considerable variation between vendors. Bloch-ISEC fitting of the same data (Figure 4) results in histograms with much less variation, and narrower widths, suggesting recovery of correct T2 values across areas with RF inhomogeneity, and reduction of bias due to pulse sequence differences. Example T2 maps from each manufacturer using Bloch-ISEC and exponential fitting are compared in Figure 5.
Discussion
Bloch-ISEC fitting produced similar T2 histograms across vendors and across sites, provided the refocusing angles were known. The rapid low flip angle calibration scan in the ADNI-1 data set enabled estimation of the B1+ shape, which was validated in comparison to actual measurements of Bloch-Siegert B1+ maps. Further improvements could account for the proton density variation in the calibration maps.Conclusion
T2 maps computed via exponential fitting of PD and T2-weighted images led to striking biases between vendors and sites, owing to differences in refocusing flip angle trains. These biases in T2 measurements were removed via modelling of the pulse sequences, using known flip angles and B1+ shape to account for RF inhomogeneity. Use of PD and T2-weighted images enables quantitative T2 measurement at the same spatial resolution as standard weighted images. By accounting for differences in pulse sequences, sequence modelling allows for T2 mapping in studies across multiple sites and vendors.Acknowledgements
Data collection and sharing was funded by the Alzheimer's Disease Neuroimaging Initiative (ADNI). Contract grant sponsorship is provided by the Canadian Institutes of Health research.
References
1. Lebel RM, Wilman AH. Transverse relaxometry with stimulated echo compensation. Magn Reson Med. 2010;64(4):1005–14.
2. Bauer CM, Jara H, Killiany R. Whole brain quantitative T2 MRI across multiple scanners with dual echo FSE: Applications to AD, MCI, and normal aging. Neuroimage. 2010;52(2):508–14.
3. McPhee KC, Wilman AH. T2 quantification from only proton density and T2-weighted MRI by modelling actual refocusing angles. Neuroimage. 2015;118:642–50.
Figures