0887
Correction of B1 non-uniformity errors in fast macromolecular proton fraction and R1 mapping without B1 maps1Radiology, University of Washington, Seattle, WA, United States
Synopsis
Correction of B1 field non-uniformity is critical for quantitative MRI methods including fast macromolecular proton fraction (MPF) and variable flip angle T1 mapping. However, B1 mapping sequences increase the examination time and are not commonly available in clinics. A new algorithm is presented to enable simultaneous B1 correction in R1=1/T1 and MPF mapping without acquisition of B1 maps. The principle of the algorithm is based on different mathematical dependences of B1-related errors in R1 and MPF allowing extraction of a surrogate B1 map from uncorrected R1 and MPF maps. The method demonstrated excellent agreement with actual B1 mapping at 3T.
Introduction
Single-point macromolecular proton fraction (MPF) mapping1,2 is a quantitative MRI method for the assessment of myelination in neural tissues. MPF demonstrated strong correlations with histologically measured myelin density in animal models3-5 and showed a promise as a biomarker of myelin in multiple sclerosis6,7 and brain development8-10 studies. In the single-point synthetic-reference method2, MPF maps are reconstructed from three source spoiled gradient-echo (GRE) images providing magnetization transfer (MT), T1, and proton-density (PD) contrast weightings. One limitation of this method is its sensitivity to errors caused by B1 field inhomogeneity rendering the need in B1 mappings as a part of imaging protocols.11 However, B1 mapping sequences increase the examination time and are not commonly available in clinical settings. As an intermediate result, the single-point MPF mapping method1,2 produces R1=1/T1 maps reconstructed using the two-point variable flip angle (VFA) method, which also require B1 correction.Purpose
To develop a data-driven algorithm for simultaneous correction of B1 inhomogeneity in MPF and R1 maps without actual B1 mapping.Theory
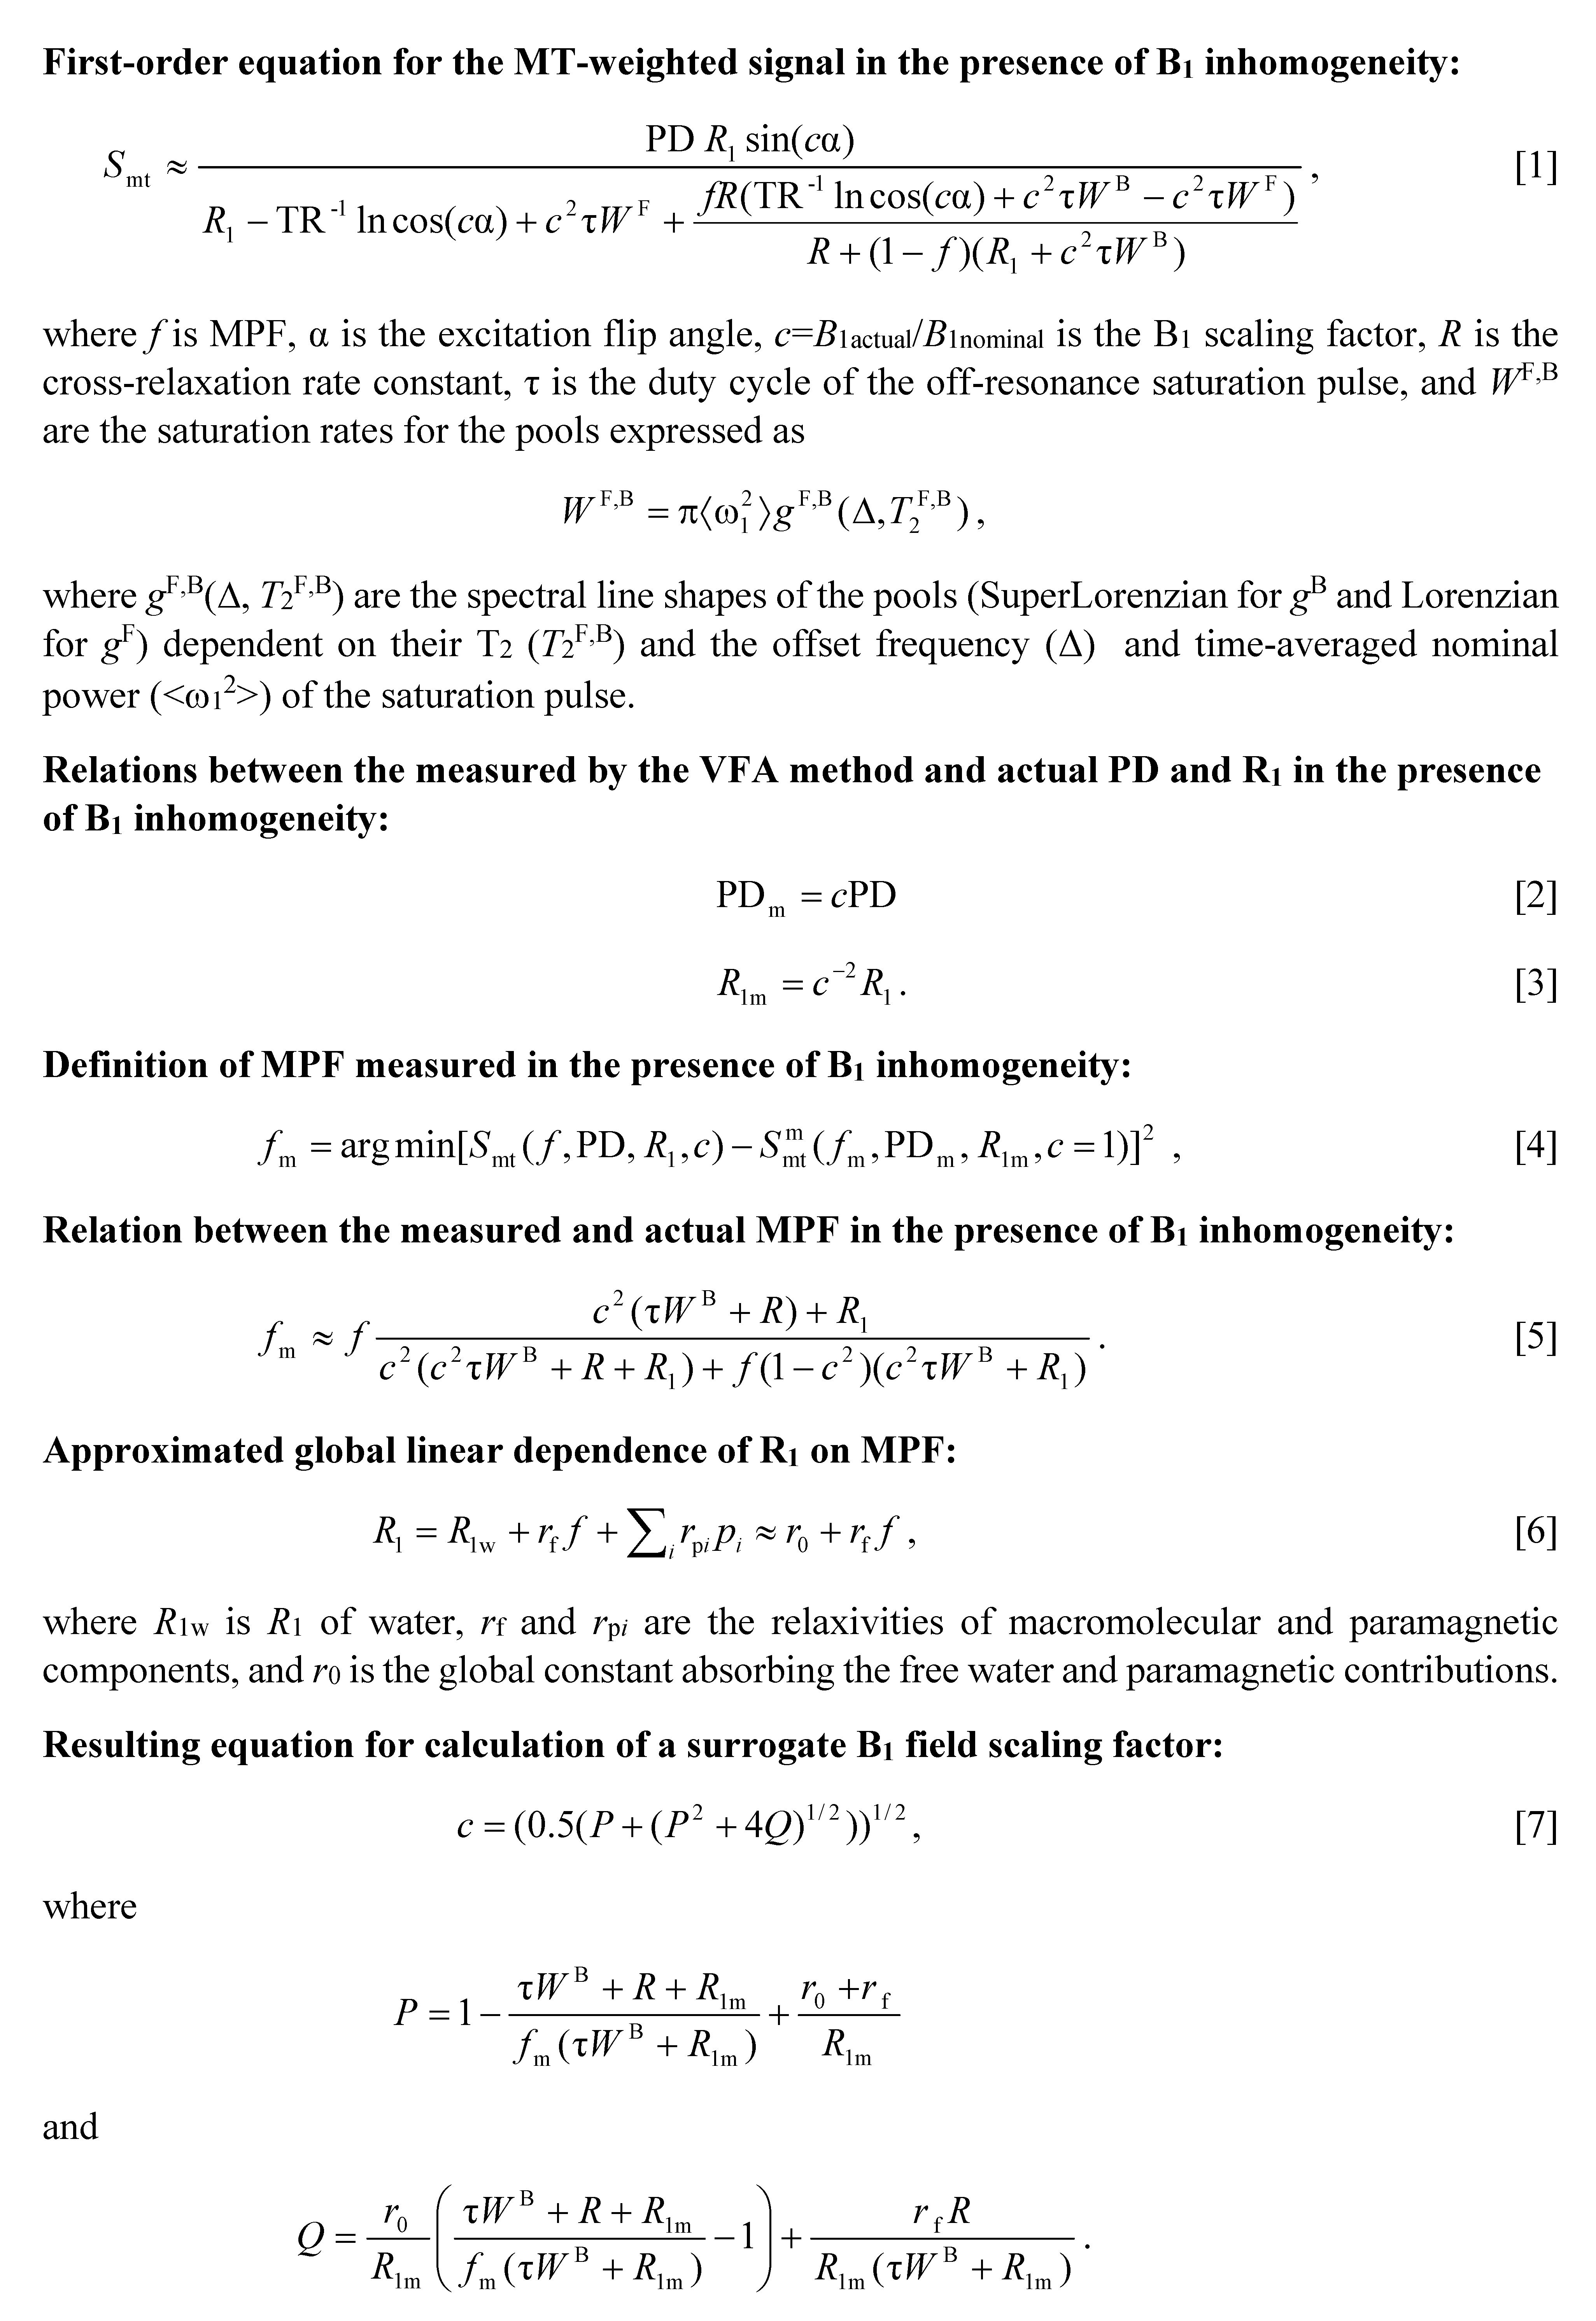
The idea of the proposed algorithm is to exploit the distinctions in the mathematical description of B1-related errors in MPF and R1 in order to reconstruct a surrogate B1 field map directly from uncorrected MPF and R1 maps and recursively apply it for correction of initial MPF and R1 maps. A simplified equation describing the MT-weighted spoiled GRE signal in the presence of B1 non-uniformity (expressed as the B1 scaling factor c=B1actual/B1nominal) was derived using the first-order approximation of the matrix pulsed steady-stated MT model1 (Fig. 1, Summary of equations, Eq. [1]). Dependence of B1-related errors in R1 and PD on c was described earlier (Fig. 1, Eqs. [2] and [3]).12 Computation of MPF with unknown B1 non-uniformity can be expressed as the fit of the signal model calculated with the nominal values of RF-related variables (c=1) and the measured values of PD and R1 containing B1-related errors (PDm and R1m) to the experimental signal given by Eq. [1] (Fig. 1, Eq. [4]). After solving Eq. [4] with Maclaurin series expansion for a small flip angle (FA) α, an equation describing the relationship between measured and actual MPF (fm and f) was obtained (Fig. 1, Eq. [5]). We further assume a global linear relationship between R1 and MPF in the absence of B1 errors (Fig. 1, Eq. [6]), which implies that R1 variations in tissues are primarily determined by the macromolecular content, while the variability due to paramagnetic ions is of the second order. After substituting R1 and f from Eqs. [2] and [5] into Eq. [6], the biquadratic equation for c can be obtained with the solution given by Eq. [7] (Fig. 1). According to Eq. [7], a surrogate B1 map can be reconstructed from uncorrected R1 and MPF maps with the knowledge of population-averaged constants r0 and rf, while other variables are the known constraints of the single-point algorithm (R and T2B)1 and sequence parameters.Methods
Participants: Data were obtained from 8 healthy volunteers (mean age 44.6±12.2 years).MRI Protocol: MRI acquisition was performed on a 3.0 Tesla Philips Achieva scanner using a previously described2 protocol including 3D PD- (TR=21 ms, FA=4°), T1- (TR=21 ms, FA=25°), and MT-weighted (TR=28 ms, FA=10°, saturation offset frequency 4 kHz, effective FA=560°) spoiled GRE sequences with isotropic resolution of 1.25x1.25x1.25 mm3. AFI13 B1 maps (TR1/TR2=40/160 ms, FA=60°) were obtained with the voxel size of 2.5x2.75x5.0 mm3.
Image processing and analysis: MPF and R1 maps were reconstructed using the single-point synthetic-reference algorithm2 with three B1 correction options: no correction, AFI, and the described data-driven algorithm. AFI-corrected MPF maps were automatically segmented into white matter (WM) and gray matter (GM) using FSL software. The resulting tissue masks were applied to all maps to calculate mean MPF and R1. The constants r0 and rf were estimated from whole-brain voxel-based linear regression of R1 on MPF and averaged across subjects.
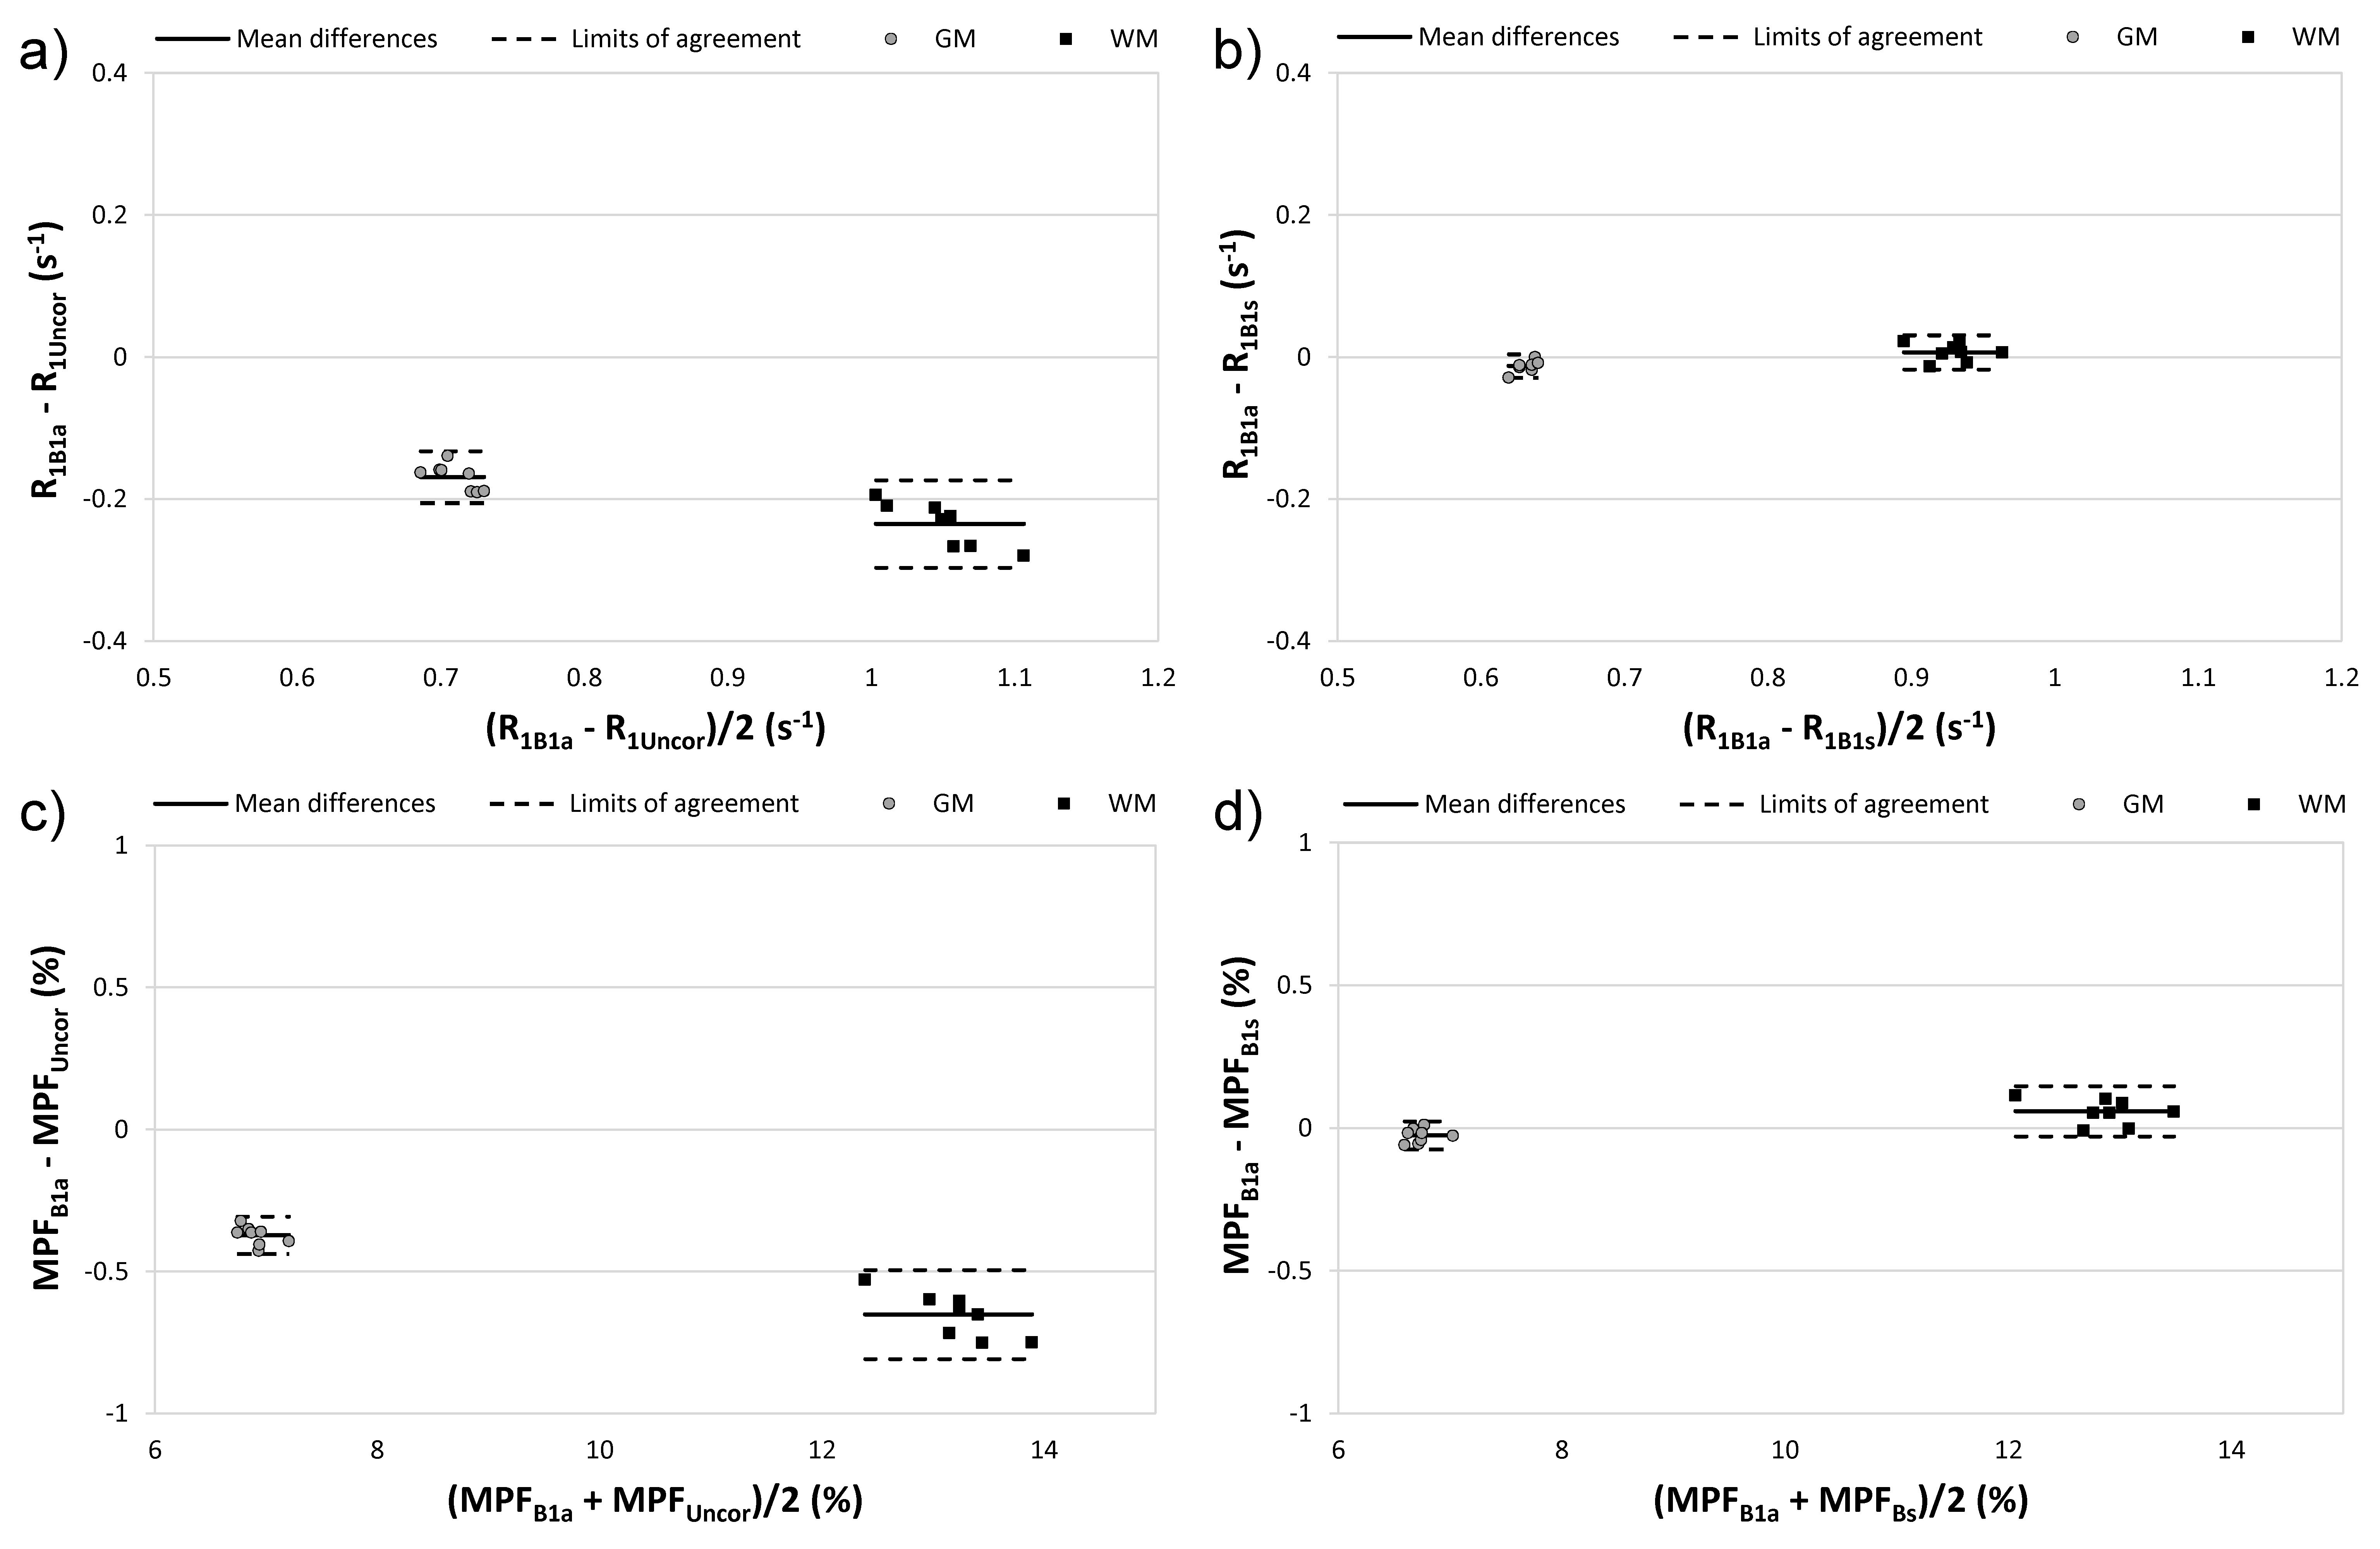
Statistical analysis: Repeated-measures ANOVA with post-hoc Tukey tests and Bland-Altman plots were used to assess agreement between B1 corrections for MPF and R1 in WM and GM.
Results
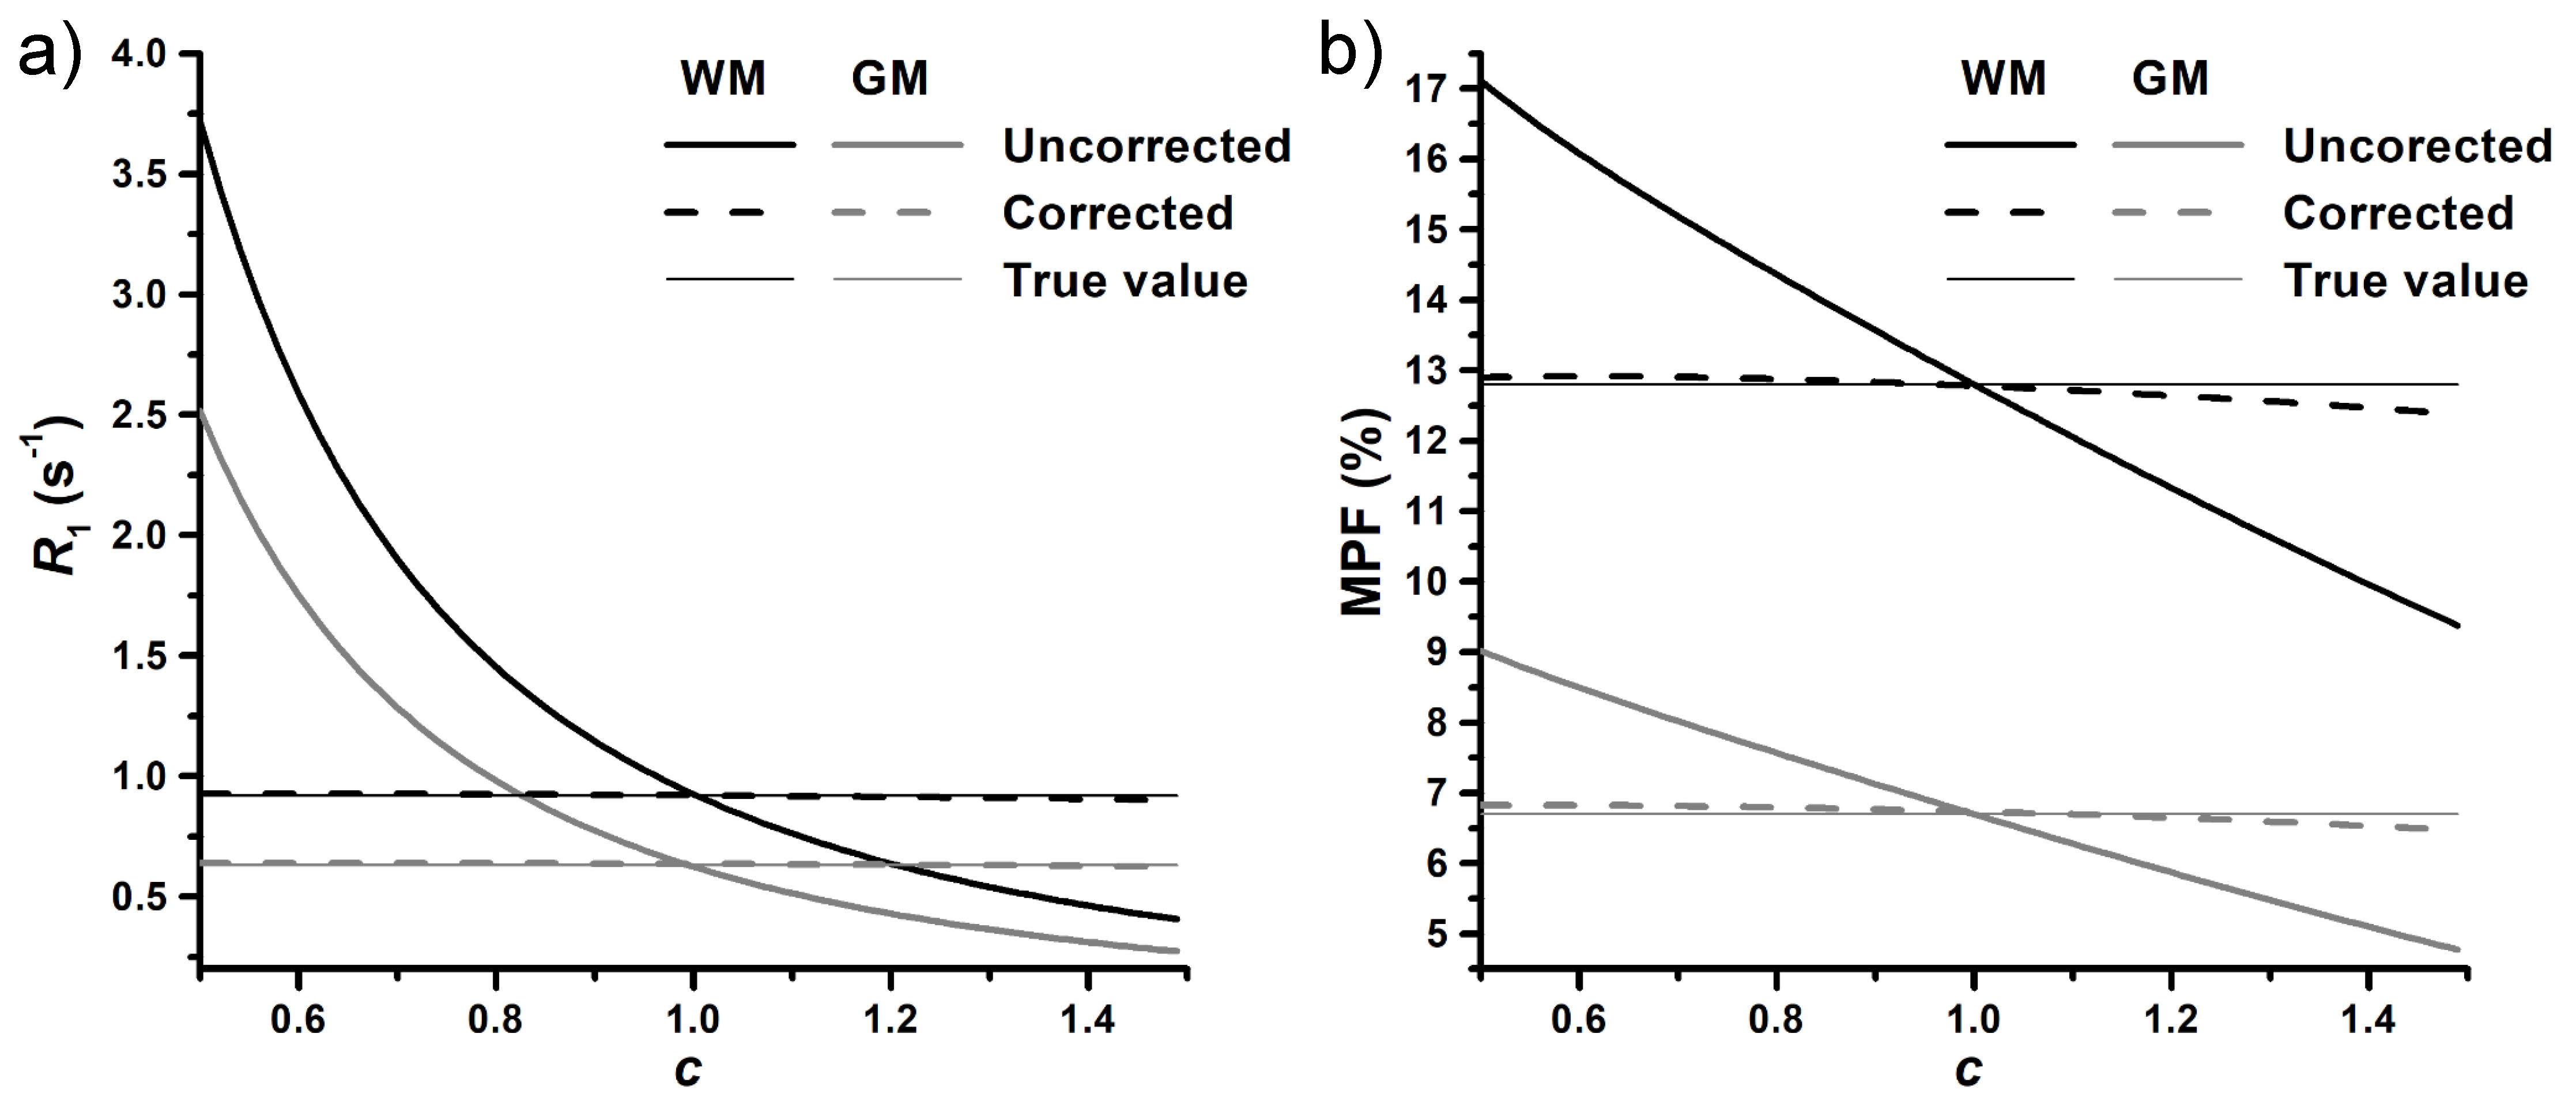
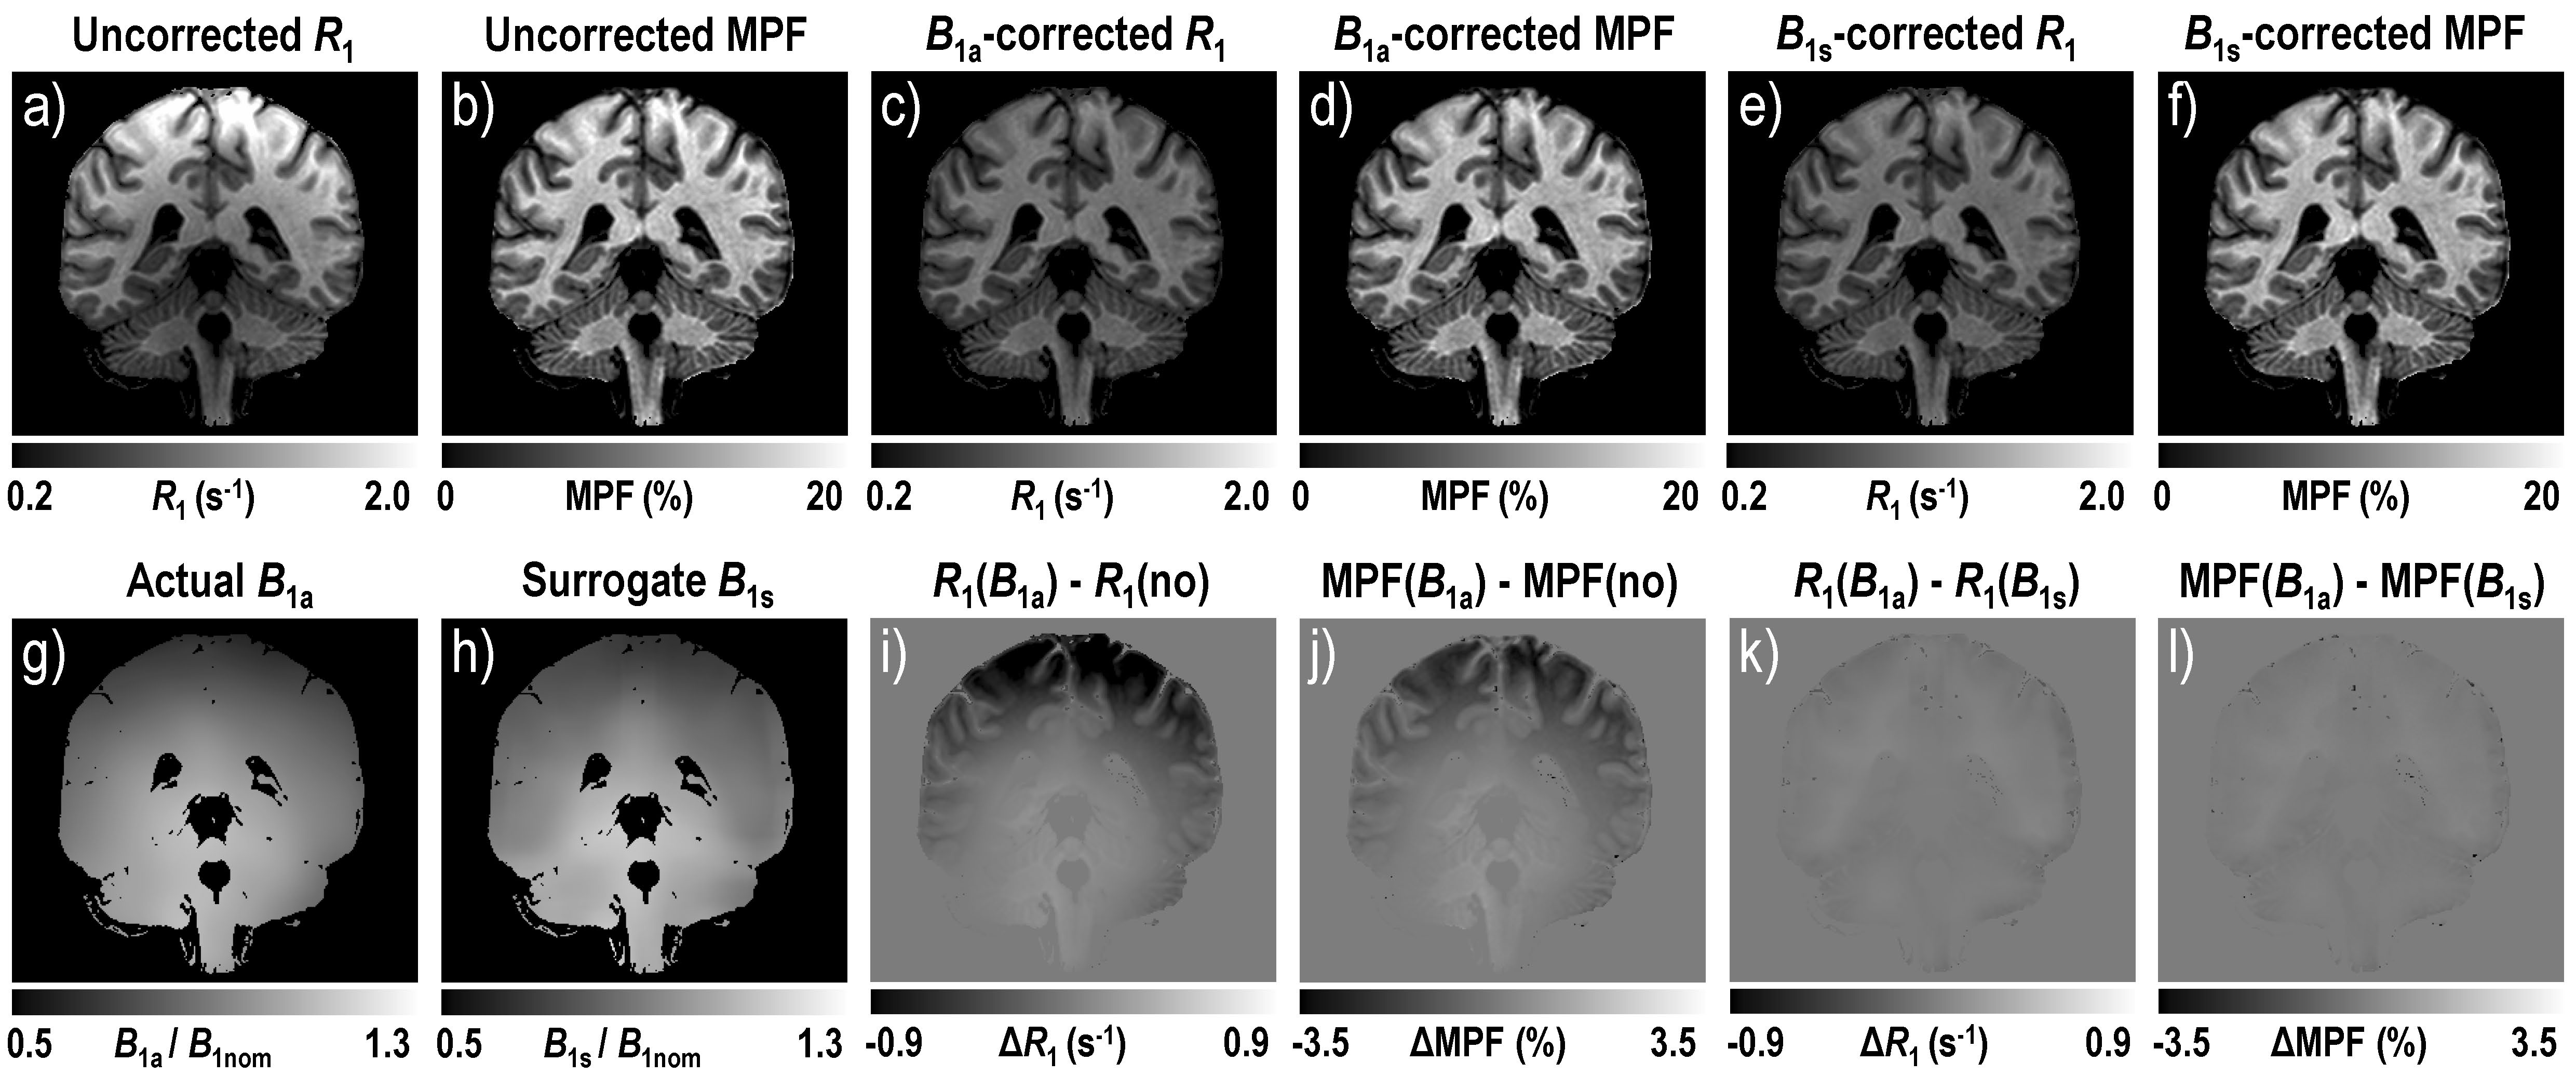
According to simulations (Fig. 2), the absence of B1 correction results in large R1 errors (about four-fold overestimation at c=0.5) and smaller but substantial MPF errors (~20-25% overestimation at c=0.5). These errors are almost completely eliminated by the described algorithm (Fig. 2). Mean ± SD experimental values of the algorithm constants were: r0=0.32±0.01 s-1 and rf=4.73±0.10 s-1. Surrogate B1 maps closely reproduced actual B1 field distribution (Fig. 3). R1 and MPF maps reconstructed without B1 correction showed significant bias in WM and GM measurements (P<0.001, Fig. 4) and apparent propagation of spatially dependent B1-related errors (Fig. 3). Correction of R1 and MPF maps using surrogate B1 field reduced the bias to a non-significant level (P=0.77 and 0.12 for WM and GM R1 and P=0.10 and 0.10 for WM and GM MPF, Fig. 4) and markedly improved uniformity of the resulting maps (Fig. 3).Conclusions
The data-driven algorithm eliminates the need in B1 maps in the fast MPF and VFA R1 brain mapping techniques. If R1 (or T1) is of primary interest, an additional MT-weighted scan can replace specialized B1 mapping sequences in imaging protocols to enable B1 field correction.Acknowledgements
Grant support: NIH R24NS104098; R21NS109727; R01EB027087.References
1. Yarnykh VL. Fast macromolecular proton fraction mapping from a single off-resonance magnetization transfer measurement. Magn Reson Med 2012;68:166-178.
2. Yarnykh VL. Time-efficient, high-resolution, whole brain three-dimensional macromolecular proton fraction mapping. Magn Reson Med 2016;75:2100-2106.
3. Underhill HR, Rostomily RC, Mikheev AM, Yuan C, Yarnykh VL. Fast bound pool fraction imaging of the in vivo rat brain: Association with myelin content and validation in the C6 glioma model. Neuroimage 2011;54:2052-20 16.
4. Khodanovich MY, Sorokina IV, Glazacheva VY, et al. Histological validation of fast macromolecular proton fraction mapping as a quantitative myelin imaging method in the cuprizone demyelination model. Sci Rep 2017;7:46686.
5. Khodanovich MY, Kisel AA, Akulov AE, et al. Quantitative assessment of demyelination in ischemic stroke in vivo using macromolecular proton fraction mapping. J Cereb Blood Flow Metab 2018;38:919-931.
6. Yarnykh VL, Bowen JD, Samsonov A, et al. Fast whole-brain three-dimensional macromolecular proton fraction mapping in multiple sclerosis. Radiology 2015;274:210-220.
7. Yarnykh VL, Krutenkova EP, Aitmagambetova G, et al. Iron-insensitive quantitative assessment of subcortical gray matter demyelination in multiple sclerosis using the macromolecular proton fraction. AJNR Am J Neuroradiol 2018;39:618-625.
8. Yarnykh VL, Prihod'ko IY, Savelov AA, Korostyshevskaya AM. Quantitative assessment of normal fetal brain myelination using fast macromolecular proton fraction mapping. AJNR Am J Neuroradiol 2018;39:1341-1348.
9. Korostyshevskaya AM, Prihod'ko IY, Savelov AA, Yarnykh VL. Direct comparison between apparent diffusion coefficient and macromolecular proton fraction as quantitative biomarkers of the human fetal brain maturation. J Magn Reson Imaging 2019;50:52-61.
10. Yarnykh V, Knipenberg N, Tereshchenkova O. Quantitative assessment of pediatric brain myelination in a clinical setting using macromolecular proton fraction. In: Proceedings of the 26th Annual Meeting of ISMRM, Paris, France; 2018 (abstract 525).
11. Yarnykh VL, Kisel AA, Khodanovich MY. Scan-rescan repeatability and impact of B0 and B1 field non-uniformity corrections in single-point whole-brain macromolecular proton fraction mapping. J Magn Reson Imaging; In press, DOI: 10.1002/jmri.26998
12. Helms G, Dathe H, Dechent P. Quantitative FLASH MRI at 3T using a rational approximation of the Ernst equation. Magn Reson Med 2008;59:667-672.
13. Yarnykh VL. Actual flip-angle imaging in the pulsed steady state: a method for rapid three-dimensional mapping of the transmitted radiofrequency field. Magn Reson Med 2007;57:192-200.
Figures