0882
PSST … Parameter mapping Swift and SilenT
Florian Wiesinger1,2, Emil Ljungberg2, Mathias Engström3, Sandeep Kaushik1, Tobias Wood2, Steven Williams2, Gareth Barker2, and Ana Beatriz Solana1
1GE Healthcare, Munich, Germany, 2King’s College London, London, United Kingdom, 3GE Healthcare, Stockholm, Sweden
1GE Healthcare, Munich, Germany, 2King’s College London, London, United Kingdom, 3GE Healthcare, Stockholm, Sweden
Synopsis
Here we describe a new framework for 3D, high-resolution Parameter mapping in a Swift and SilenT manner, termed PSST. The method combines T1 and T2 contrast preparation with segmented, silent, zero TE (ZTE) image encoding and an analytical signal model. Four canonical schemes are presented and demonstrated in phantom and in-vivo brain experiments.
Introduction
One major thrust in radiology today is image standardization with rapidly-acquired, quantitative, multi-contrast information. This is critical for multi-center trials, for the collection of big data and the use of artificial intelligence in evaluating the data. In the past few years new quantitative, multi-parametric MR imaging methods have been presented addressing this need1-4.Here we present a new framework for Parameter mapping in a Swift and Silent manner, termed PSST. The method combines T1 and T2 magnetization preparation, with segmented 3D, fast and silent Zero TE (ZTE)5,6 image encoding.
Methods
Figure 1 illustrates four example implementations (top) and corresponding signal evolutions (bottom) for the proposed PSST silent parameter mapping framework. Magnetization preparation pulses are indicated by blue (T1 inversion recovery preparation), and red (T2 preparation) lines. The 3D silent ZTE image encoding segments5,6 (each containing N=256 center-out radial spokes), indicated in green, are identically repeated for each segment.The mean longitudinal magnetization averaged over the nth segment (Mz,n) can be stated as the weighted sum of the longitudinal magnetization immediately preceding this segment (Mprepz,n) and the ZTE steady-state longitudinal magnetization (Mz,SS) according to:
$$M_{z,n}=M^{prep}_{z,n}f+M_{z,SS}(1-f) \textrm{, with } f=\frac{\beta(1-\beta^N)}{N(1-\beta)} \textrm{, and } \beta=\cos(\alpha)\exp(-\frac{TR}{T1})$$
$$M_{z,SS}=\frac{M_0(1-E1)}{1-E1\cos(\alpha)}, \textrm{with } E1=exp(-\frac{TR}{T1})$$
For small α<<1rad and short TR<<T1, Mz,SS can be approximated as:
$$M_{z,SS}=\frac{M_0}{1+\frac{T1 \alpha^2}{2 TR}}$$
Apparently, native ZTE (1st column) with very small α (i.e. α2*T1/(2*TR)<<1) provides proton density information (M0), which was used as input for T1 and T2 fitting in the subsequent schemes. T2zz (2nd column, T2 preparation followed by two ZTE segments) is the fastest scheme providing PD, T1 and T2 maps using only two ZTE segments. The T1 information is extracted in a variable flip angle (VFA) sense via the separately acquired PD information. T1zzz (3rd column, T1 inversion recovery followed by three ZTE segments) does not include a T2 sensitizing mechanism and hence only provides PD and T1. T2zT1zzz (4th column, T2 preparation followed by one ZTE segment followed by T1 inversion recovery followed by two ZTE segments) is a hybrid of the previous schemes and provides PD, T1 and T2 information.
Corresponding signal evolutions are plotted for gray matter (GM), white matter (WM) and cerebrospinal fluid (CSF). The considered PSST schemes demonstrate stronger signal dispersion for T1 than T2 differences. Accordingly, T2 maps are slightly smoothed by a Gaussian filter with 0.65 voxels full-width-half-maximum.
The PSST silent parameter mapping framework was implemented on a GE 3T MR750w scanner using an 8-channel brain coil (GE Healthcare, Chicago, IL), tested and optimized using a quantitative phantom (Eurospin, UK) and, finally, demonstrated in healthy volunteer brain scans. Both T1 and T2 magnetization preparation modules, are using wide-band, adiabatic RF pulses to improve robustness against B1 inhomogeneity and off-resonance. Scan parameters are listed in the respective figure captions. Online image reconstruction was implemented using the Orchestra SDK (GE Healthcare, Chicago, IL) including 3D Kaiser-Bessel gridding7 and optional total-generalized-variation (TGV) regularization8. Quantitative T1 and T2 parameter maps were calculated via least-squares dictionary matching of the M0 normalized signals (i.e. Mt,i/M0) using a precalculated dictionary containing 500*500 (T1,T2) sampling points. The pre-acquired M0 information improves the conditioning of the fitting and allows differentiating signals also based on magnitude differences (vs. cross-correlation based dictionary matching exploiting shape differences only).
Results and Discussion
Figure 2 illustrates in-vivo parameter maps of the four tested PPST schemes using a high resolution 1mm protocol. Native ZTE (left) provides PD information, which was then used as prior knowledge for the subsequent schemes. T2zz and T2zT1zzz both provide T1 and T2 information, while T1zzz only captures T1 information.Figure 3 evaluates accuracy, precision and reproducibility using a quantitative phantom consisting of 11 tubes of known T1 and T2 relaxation times. The measured T1 and T2 values appear slightly biased but highly precise in terms of standard deviation. The T2xx scheme (blue dashed line) appears significantly different; presumably because of its VFA nature. After an approximate flip angle correction (i.e. FA~0.88*FAnominal) obtained T1 and T2 values converge towards the other schemes. Reproducibility was tested for T2zT1zz and found excellent (i.e. five repetitions with separate prescan adjustments in between).
Figure 4 demonstrates sub-millimeter PSST results for T2zT1zzz acquired in 11:13, showing PD, T1 and T2 parameter maps together with derived synthetic T1-FLAIR and T2-FLAIR images. The acoustic noise was measured inside the magnet bore using a dedicated microphone setup and found to be within 5dB(A) to ambient noise for all tested PSST schemes.
Conclusion
The presented PSST method allows parameter mapping in a swift and silent manner. T1 and T2 signal dispersion is accomplished in a controlled manner via discrete magnetization preparation pulses and steady-state signal weighting. Four canonical PPST schemes are demonstrated for parameter mapping plus synthetic MR contrast generation at different resolutions.Acknowledgements
References
- Blystad, I., Warntjes, J. B. M., Smedby, O., Landtblom, A. M., Lundberg, P., & Larsson, E. M. (2012). Synthetic MRI of the brain in a clinical setting. Acta radiologica, 53(10), 1158-1163.
- Kvernby, S., Warntjes, M. J. B., Haraldsson, H., Carlhäll, C. J., Engvall, J., & Ebbers, T. (2014). Simultaneous three-dimensional myocardial T1 and T2 mapping in one breath hold with 3D-QALAS. Journal of Cardiovascular Magnetic Resonance, 16(1), 102.
- Ma, D., Gulani, V., Seiberlich, N., Liu, K., Sunshine, J. L., Duerk, J. L., & Griswold, M. A. (2013). Magnetic resonance fingerprinting. Nature, 495(7440), 187.
- Gómez, P. A., Molina-Romero, M., Buonincontri, G., Menzel, M. I., & Menze, B. H. (2019). Designing contrasts for rapid, simultaneous parameter quantification and flow visualization with quantitative transient-state imaging. Scientific reports, 9(1), 8468.
- Madio, D. P., & Lowe, I. J. (1995). Ultra‐fast imaging using low flip angles and FIDs. Magnetic resonance in medicine, 34(4), 525-529.
- Wiesinger, F., Sacolick, L. I., Menini, A., Kaushik, S. S., Ahn, S., Veit‐Haibach, P., ... & Shanbhag, D. D. (2016). Zero TE MR bone imaging in the head. Magnetic resonance in medicine, 75(1), 107-114.
- Beatty, P. J., Nishimura, D. G., & Pauly, J. M. (2005). Rapid gridding reconstruction with a minimal oversampling ratio. IEEE transactions on medical imaging, 24(6), 799-808.
- Knoll, F., Bredies, K., Pock, T., & Stollberger, R. (2011). Second order total generalized variation (TGV) for MRI. Magnetic resonance in medicine, 65(2), 480-491.
Figures

Figure 1: Illustration of four canonical PSST schemes (top) and corresponding signal evolution (bottom). Preparation pulses are indicated by blue (T1 inversion recovery preparation), and red (T2 preparation) lines. ZTE image encoding segments are shown in green (each module containing 256 spokes per segment).

Figure 2: Illustration of four canonical PSST schemes (top) and obtained parameter maps (bottom). Scan parameters: res=1mm3, BW=±20.83kHz, FA=4 (1 for ZTE), NEX=1.25 (2.5 for ZTE).
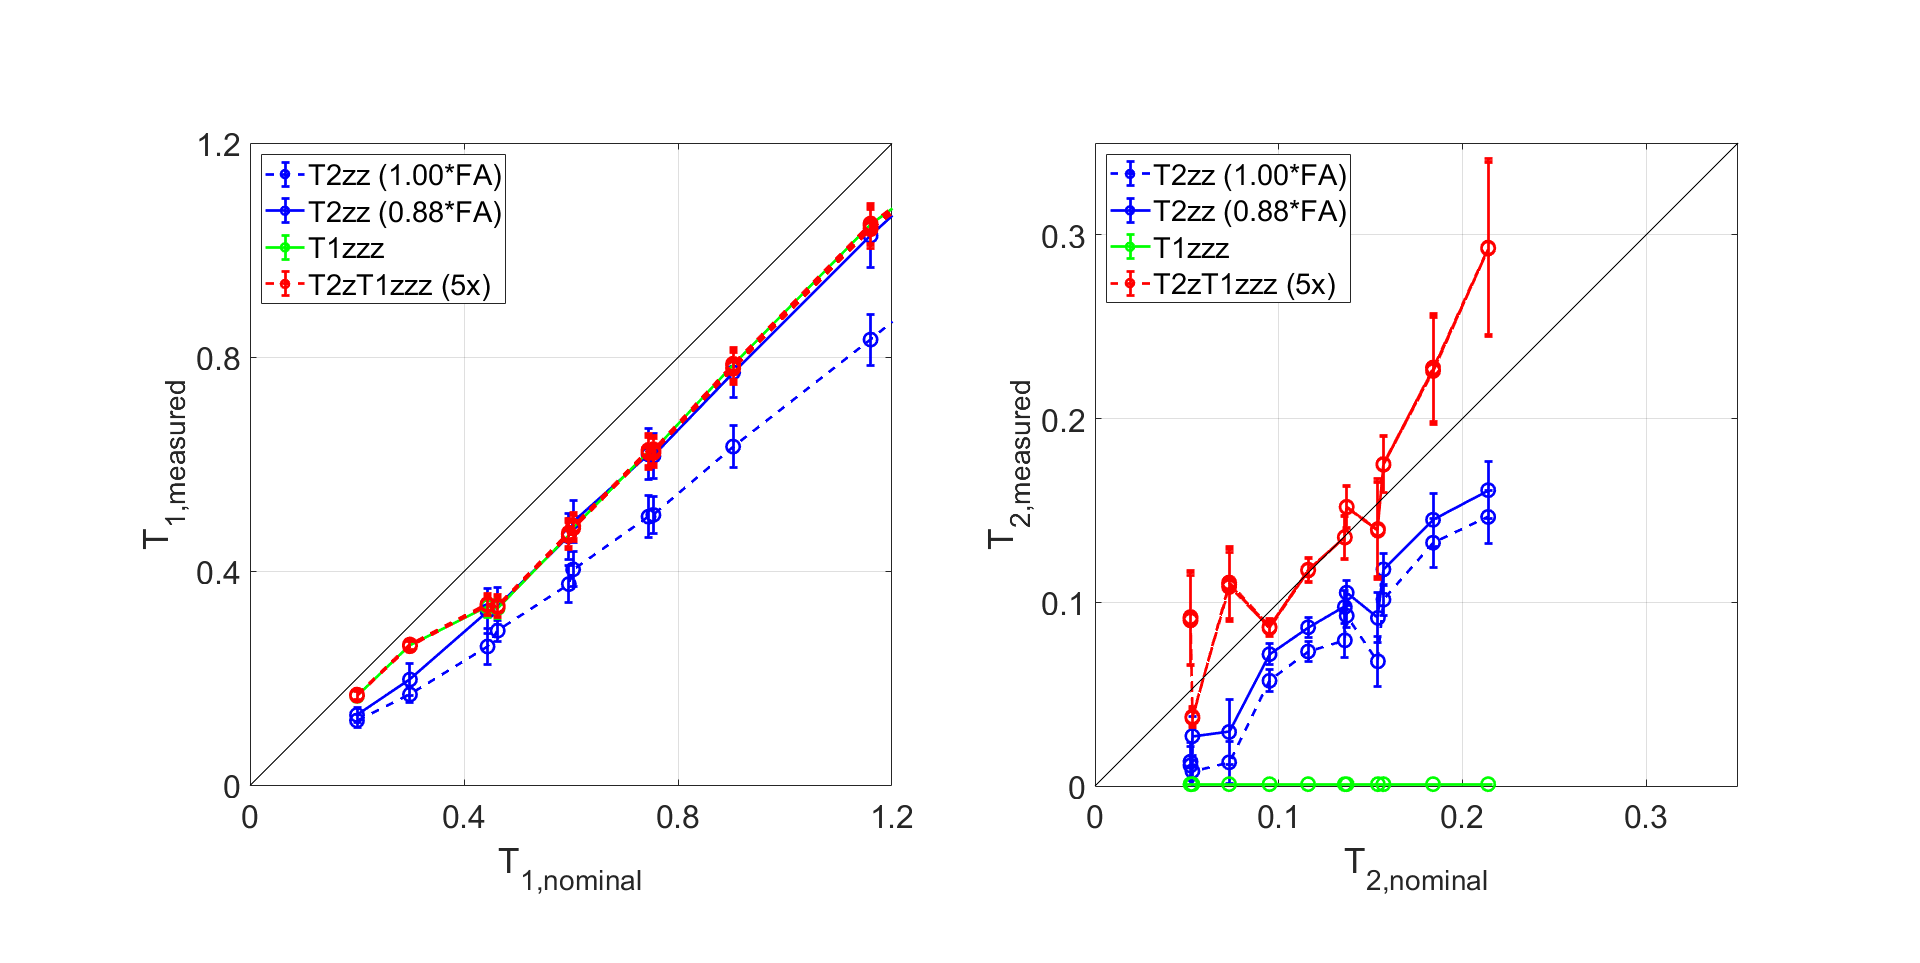
Figure 3: Accuracy, precision and reproducibility measurements performed in a quantitative T1, T2 phantom using the PSST schemes of Figure 2. Accuracy appears slightly biased, while precision and reproducibility is excellent. T2zz is based on the VFA scheme and hence sensitive to B1+ errors (blue dashed line), which can be corrected (blue solid line).
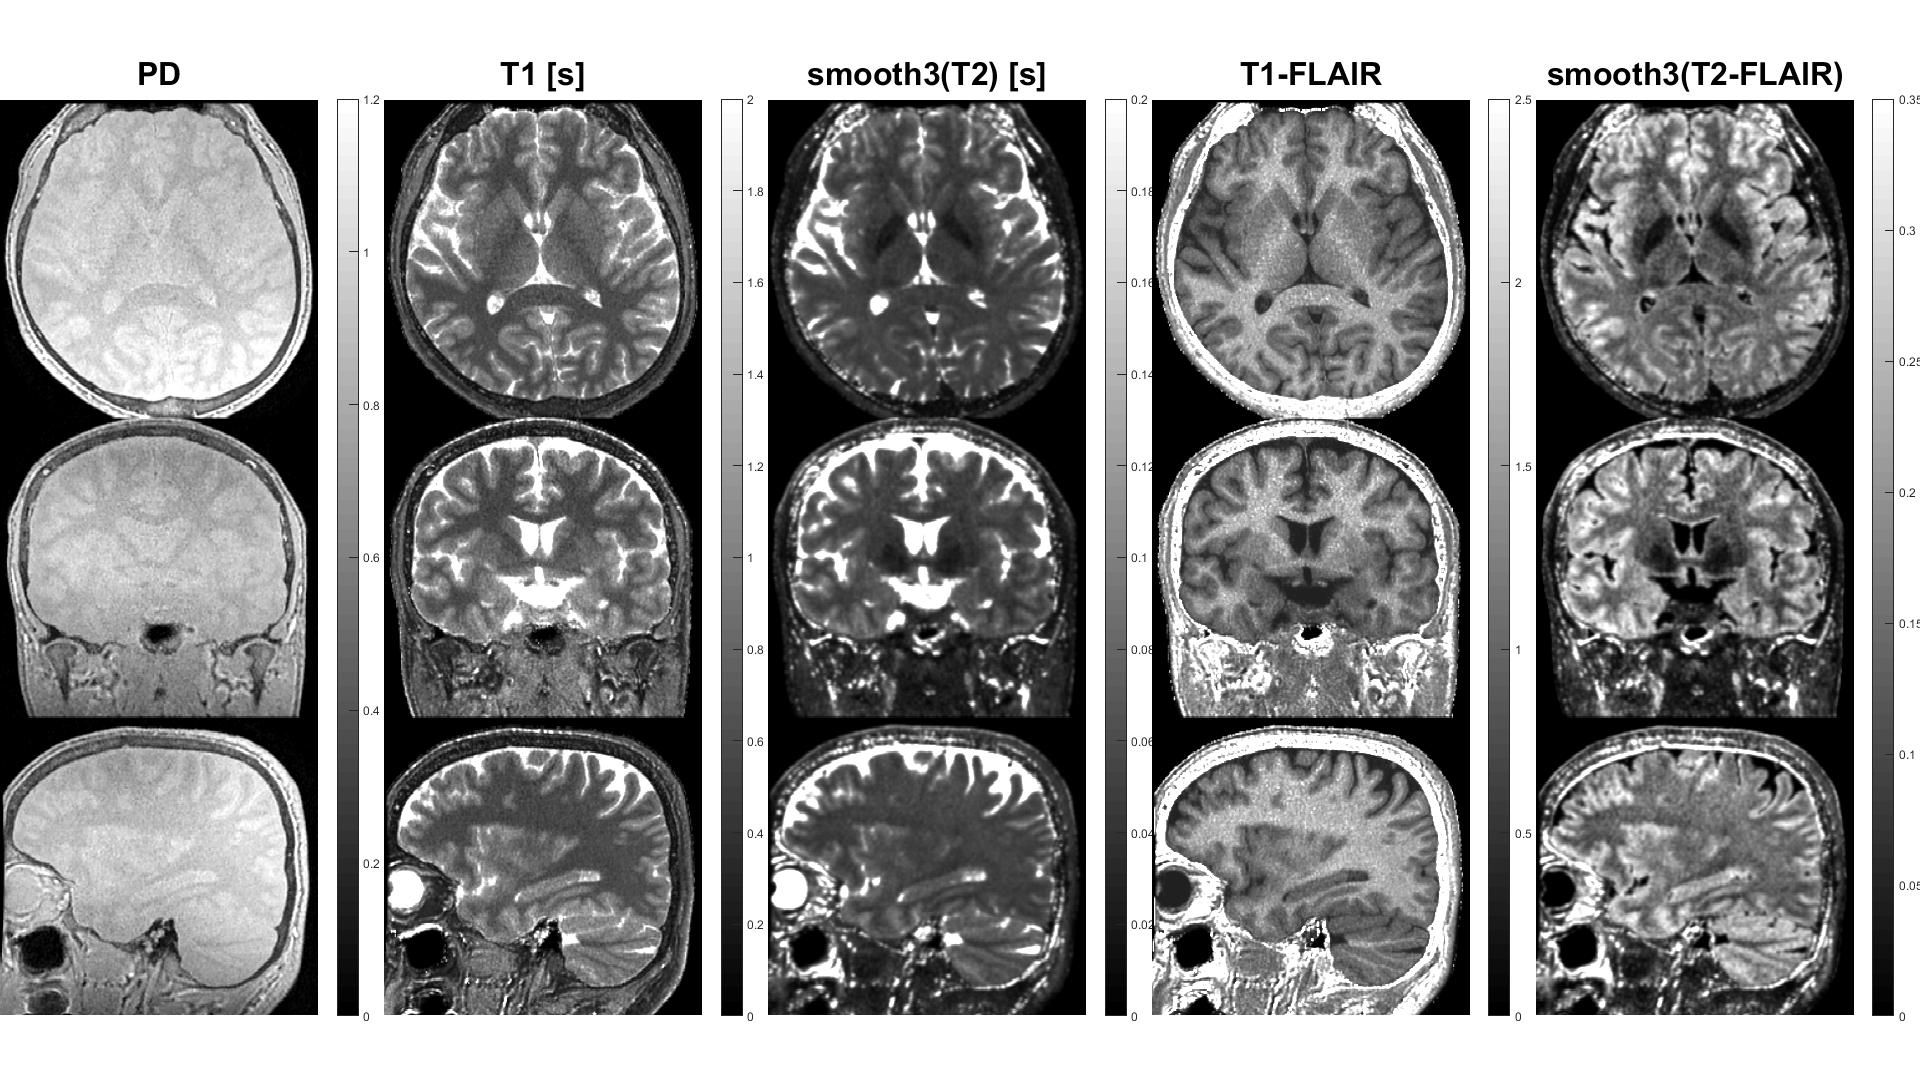
Figure 4: Sub-millimeter parameter maps and derived synthetic FLAIR images using the T2zT1zzz scheme. Scan parameters: res=(0.8mm)3, BW=±25kHz, FA=4 (1 for ZTE), NEX=1, 256 spokes per segment, scan time 11:13.