0881
Simultaneous quantitative mapping of T1, R2* and susceptibility with magnetic resonance multitasking1Biomedical Imaging Research Institute, Cedars Sinai Medical Center, Los Angeles, CA, United States, 2Bioengineering Department, University of California, Los Angeles, Los Angeles, CA, United States, 3Magnetic Resonance Innovations, Inc, Bingham Farms, MI, United States, 4Wayne State University School of Medicine, Detroit, MI, United States, 5The MRI Institute for Biomedical Research, Bingham Farms, MI, United States
Synopsis
A new approach for simultaneous quantitative mapping of T1, R2* and susceptibility was presented in this work. This technique employed IR pulses followed by N=152 segments of multi-echo FLASH readout. We were able to reconstruct the images for each echo time and inversion time under the multitasking framework for furhther analysis. Results of both visual comparison and statistical analysis showed that our proposed method agreed well with the reference but were more time efficient and robust to interscan motion.
Introduction
Quantitative mapping of Magnetic Resonance (MR) relaxation times can reveal important information for brain tissue composition1 and various neurodegenerative diseases2,3. T1 has been widely used in differentiation of brain tissues4 and T2* mapping is important for detecting hemorrhage, calcification, and iron deposition5. Recently, magnetic susceptibility mapping has become a useful tool for the quantification of specific biomarkers such as calcium, gadolinium, and superparamagnetic iron oxide (SPIO) nano-particles6. However, different quantitative maps are usually acquired in separate scans, which can be time-consuming and possibly suffer from image mis-registration. Therefore, more versatile and robust techniques for simultaneous quantitative mapping would be of interest from both a scientific and clinical perspective. In this work, we proposed a new approach based on multitasking7.Methods
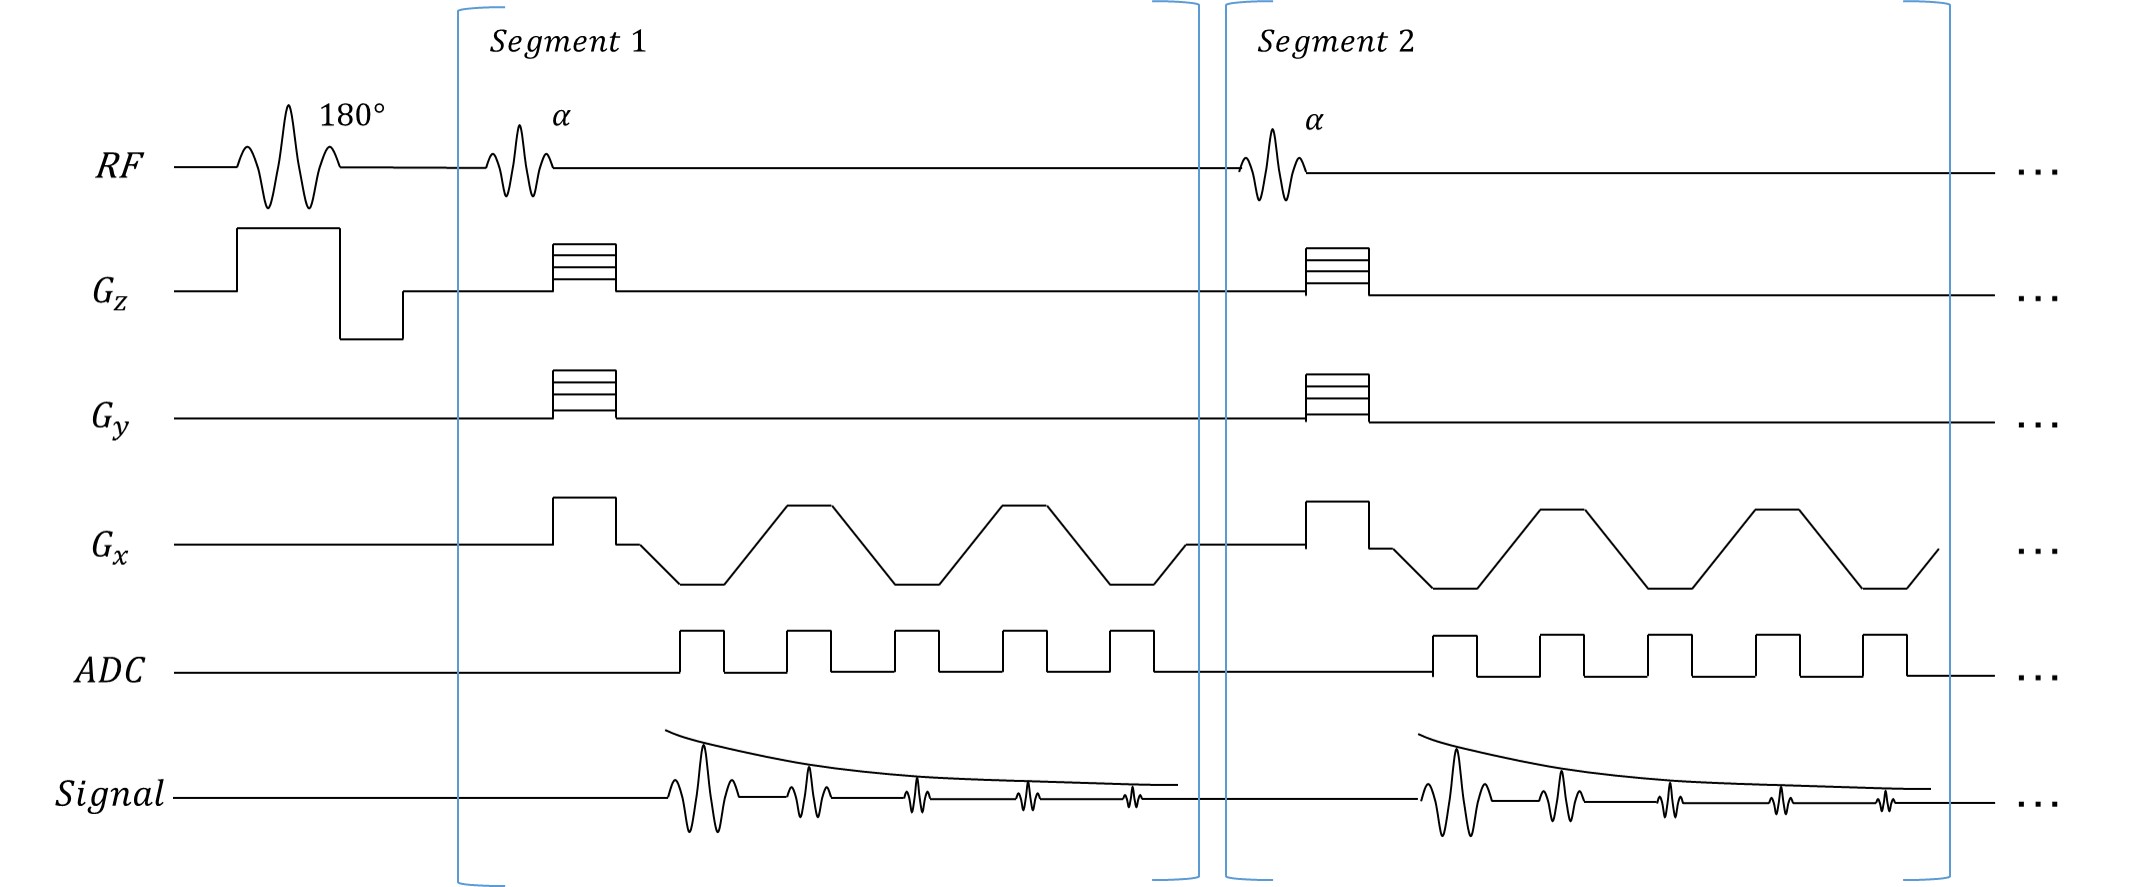
Sequence design and TheoryAs shown in Fig. 1, data were continuously collected using a 3D inversion recovery multi-echo FLASH sequence. In each segment, all echoes corresponding to the same inversion time (TI) were acquired at the same k-space location. The underlying image was expressed as $$$\rho\left(\mathbf{r}, T_{\mathrm{E}}, T_{1}\right)$$$ with spatial locations $$$\mathbf{r}=(x, y, z)$$$ , echo time $$$T_{E}$$$ and inversion time index $$$T_{I}$$$ . Our 5-dimensional image $$$\rho$$$ can be written as a 3-way tensor $$$\mathcal{A}$$$ with elements $$$A_{i j k}=\rho\left(\mathbf{r}_{i}, T_{\mathrm{E}, j}, T_{\mathrm{I}, k}\right)$$$. Image correlation induces $$$\mathcal{A}$$$ to be low-rank, expressible in a factorized form:
$$\mathbf{A}_{(1)}=\mathbf{U}_{\mathbf{r}} \mathbf{\Phi}$$ Where subscript (1) denotes mode-1 unfolding of the tensor, $$$\mathbf{U}_{\mathbf{r}}$$$ are spatial coefficients and $$$\mathbf{\Phi}=\mathbf{G}_{(1)}\left(\mathbf{U}_{\mathrm{TI}} \otimes \mathbf{U}_{\mathrm{TE}}\right)$$$ is a temporal factor consisting of a core tensor $$$\mathbf{G}_{(1)}$$$, multi-echo temporal basis $$$\mathbf{U}_{\mathrm{TE}}$$$ and T1 recovery temporal basis $$$\mathbf{U}_{\mathrm{TI}}$$$. The temporal factor $$$\mathbf{\Phi}$$$ can be determined from Bloch-constraint low-rank tensor completion of training data interleaved throughout the scan7, after which we can find $$$\mathbf{U}_{\mathbf{r}}$$$ by solving the following optimization problem: $$\widehat{\mathbf{U}}_{\mathbf{r}}=\arg \min _{\mathbf{U}_{\mathbf{r}}}\left\|\mathbf{d}_{\mathbf{i} m g}-\Omega(\mathbf{E} \mathbf{U} \Phi)\right\|_{2}^{2}+\lambda R\left(\mathbf{U}_{\mathbf{r}}\right)$$
where $$$\mathbf{d}_{\mathrm{img}}$$$ contains the undersampled k-space data; $$$\Omega$$$ is an undersampling operator, $$$\mathbf{E}$$$ is the signal model including Fourier transform and coil sensitivities, and where $$$R\left(\mathbf{U}_{\mathbf{r}}\right)$$$ is a spatial regularizer (chosen here as spatial total variation).
MR Experiments
Imaging experiments were performed in 5 healthy subjects on a 3T scanner (Vida; Siemens Healthcare, Erlangen, Germany) with a 20‐channel receiver coil. The data were collected with FOV = 205 x 256 x 128mm3, voxel size = 1.34 x 0.67 x 2 mm3, flip angle = 8°. Following the IR pulse, $$$N = 152$$$ segments were acquired with TR = 22ms, IR period = 3.3s, TEs=5ms, 7.5ms, 10ms, 12.5ms and 16.25ms. The scan time was 10 min for 64 slices.
Image Analysis
The reference T1 maps were generated from inversion recovery TSE sequences, while the reference R2* and susceptibility maps were generated from multi-echo GRE sequences. FOV was kept the same across different scans. Both visual comparison and statistical analysis were performed to evaluate the agreement between the multitasking method and the references.
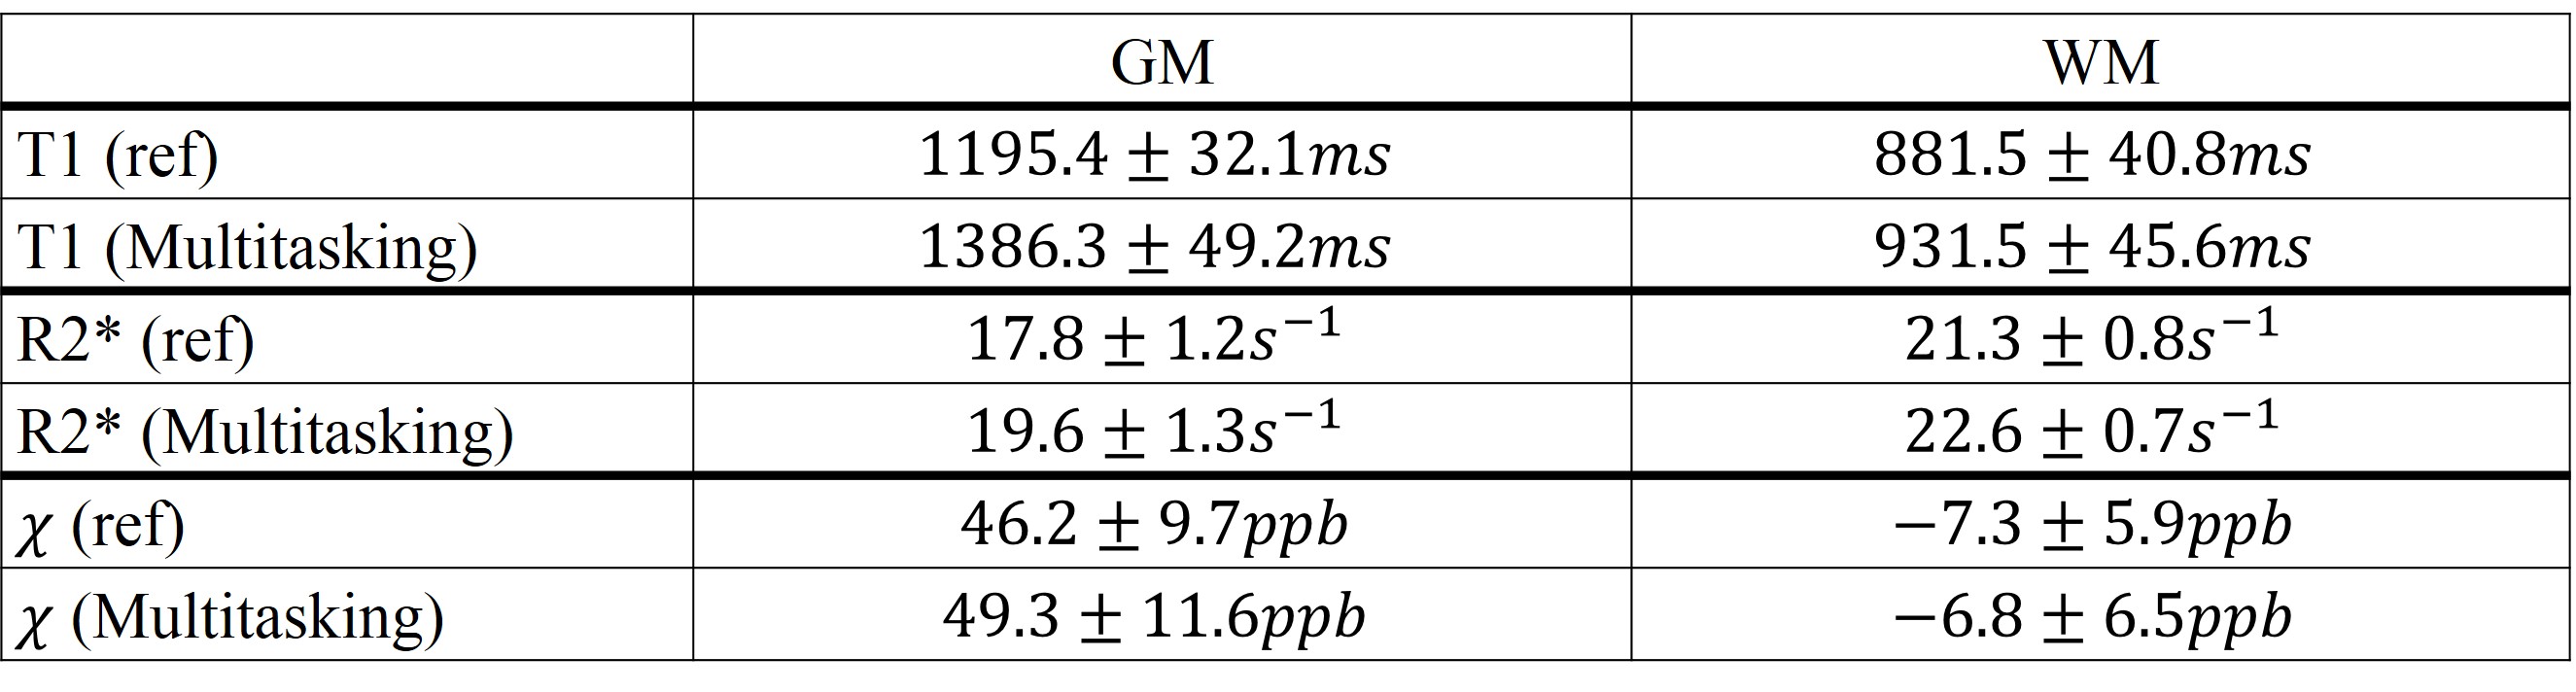
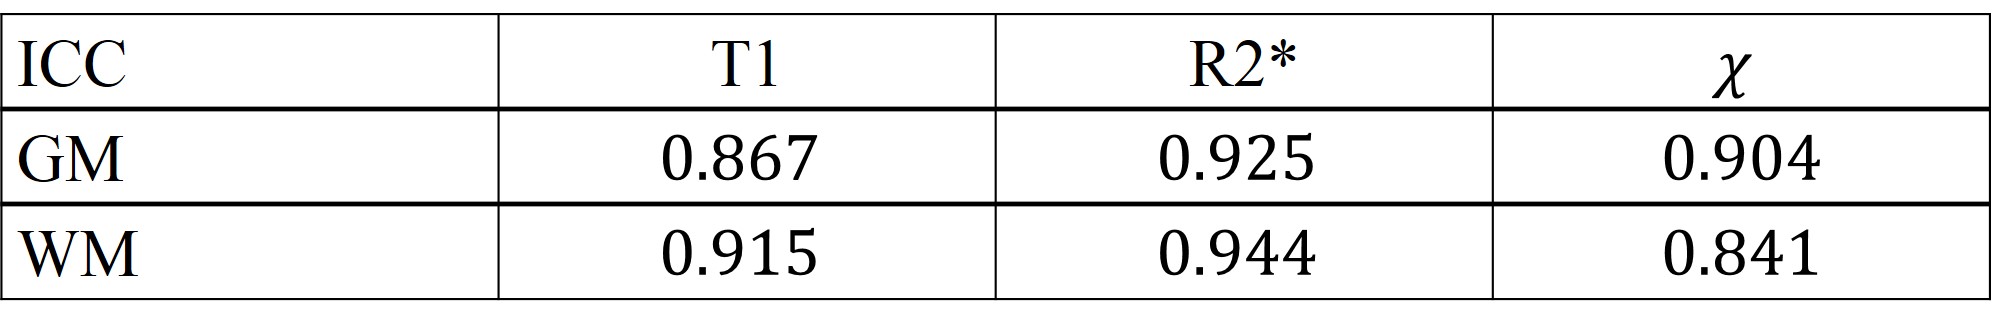
Mean values and standard deviations were analyzed and reported. Besides, the intra-class correlation coefficients (ICC) between different methods were computed with SPSS, Version 24 (IBM Corp., Armonk, N.Y., USA) for different parameters and different tissues.
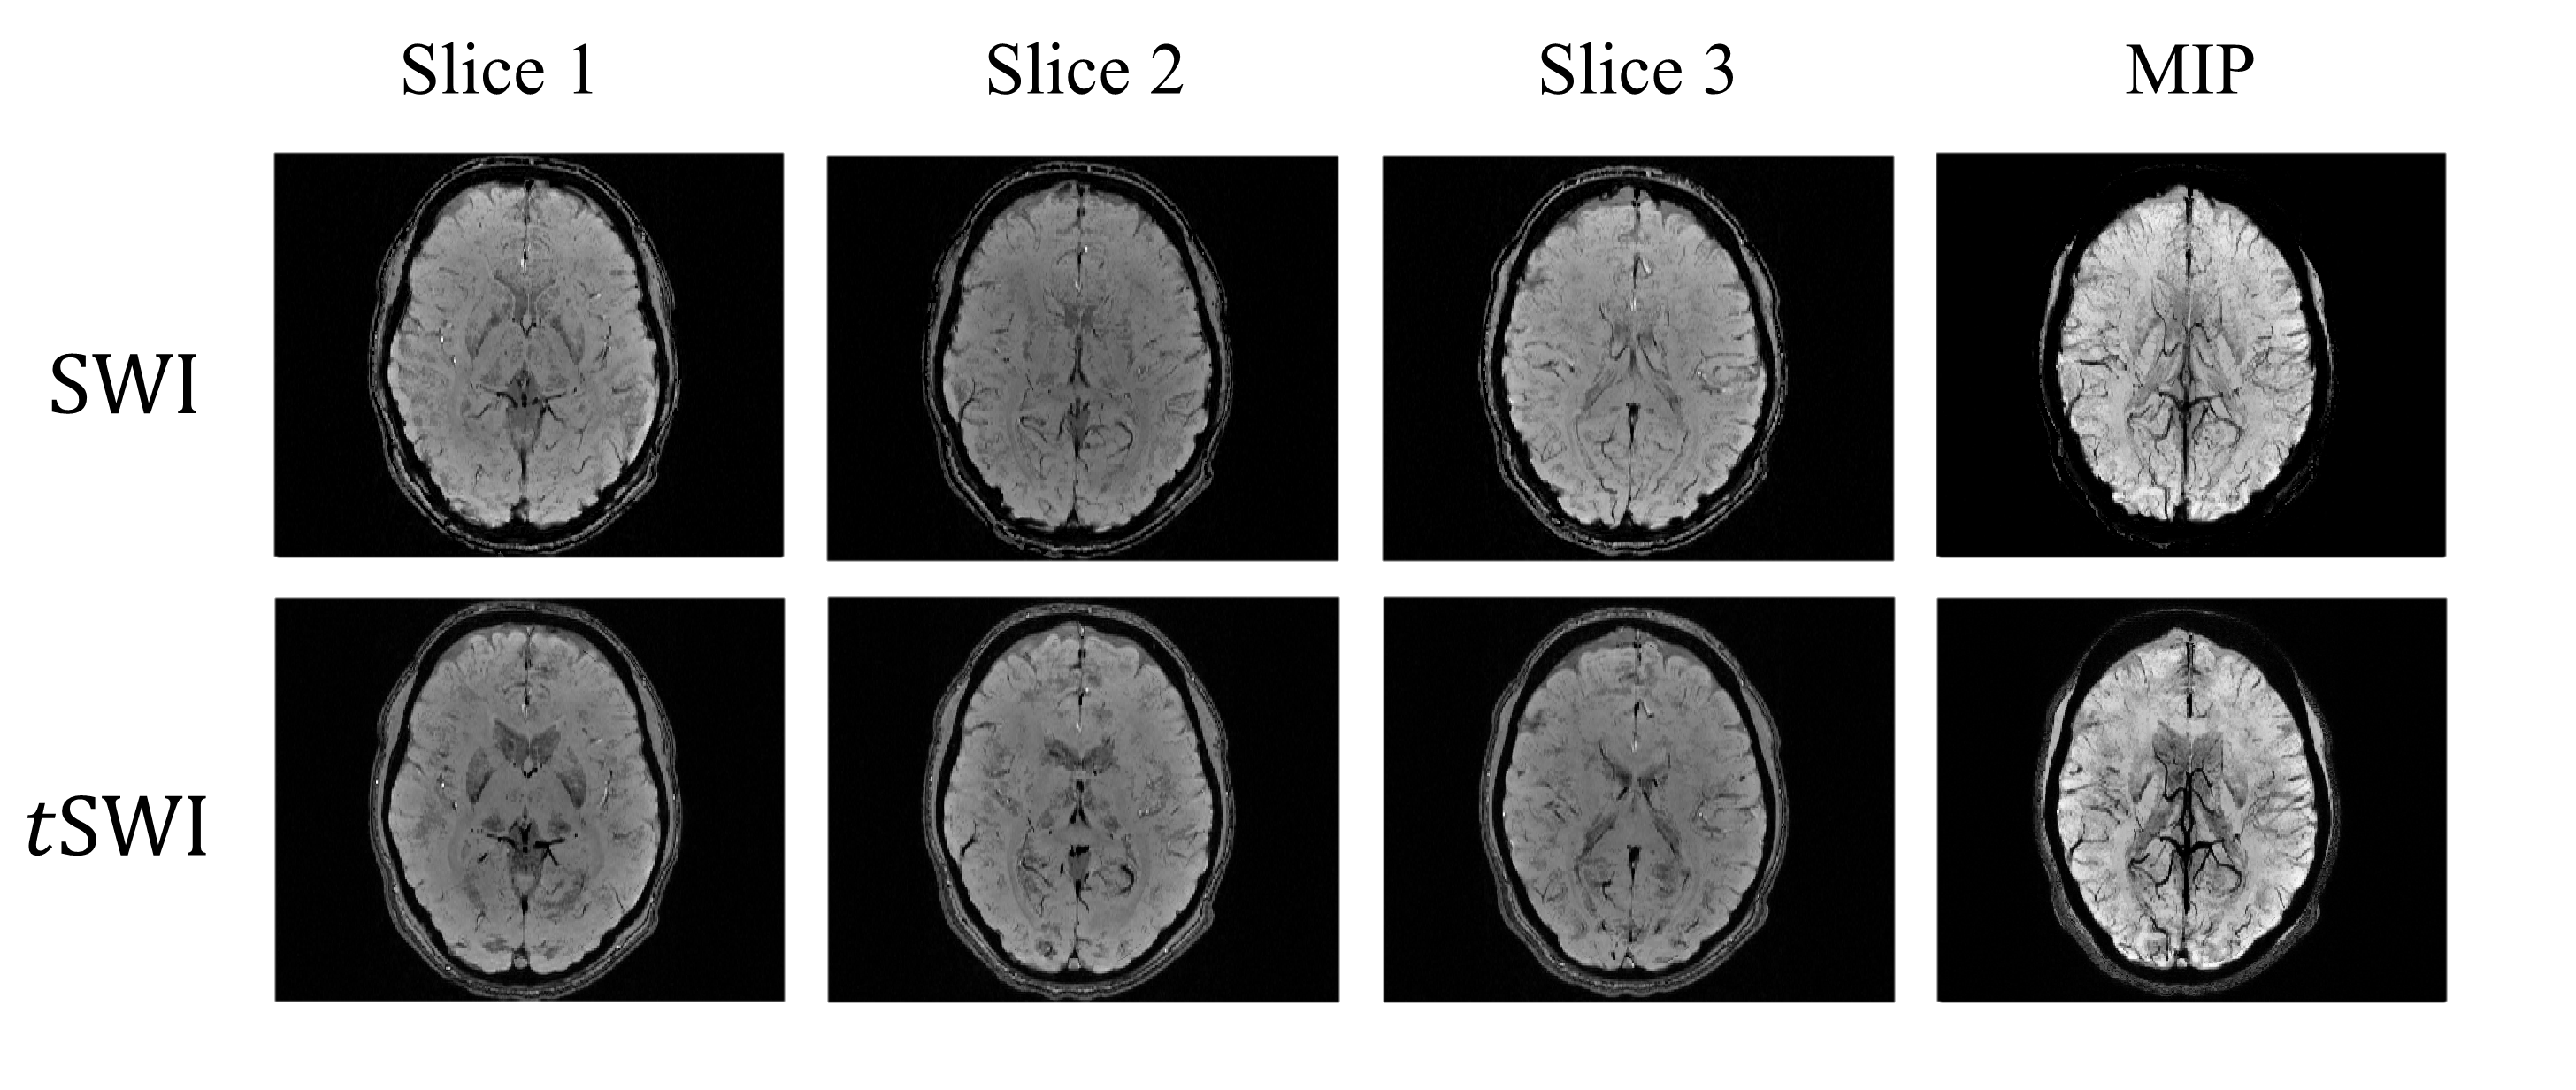
In addition to quantitative mapping and analysis, susceptibility-weighted images are also available with Multitasking.SWI can be generated from high-pass filtered phase maps8 while true-SWI (tSWI) can be created from susceptibility mapping9.
Results
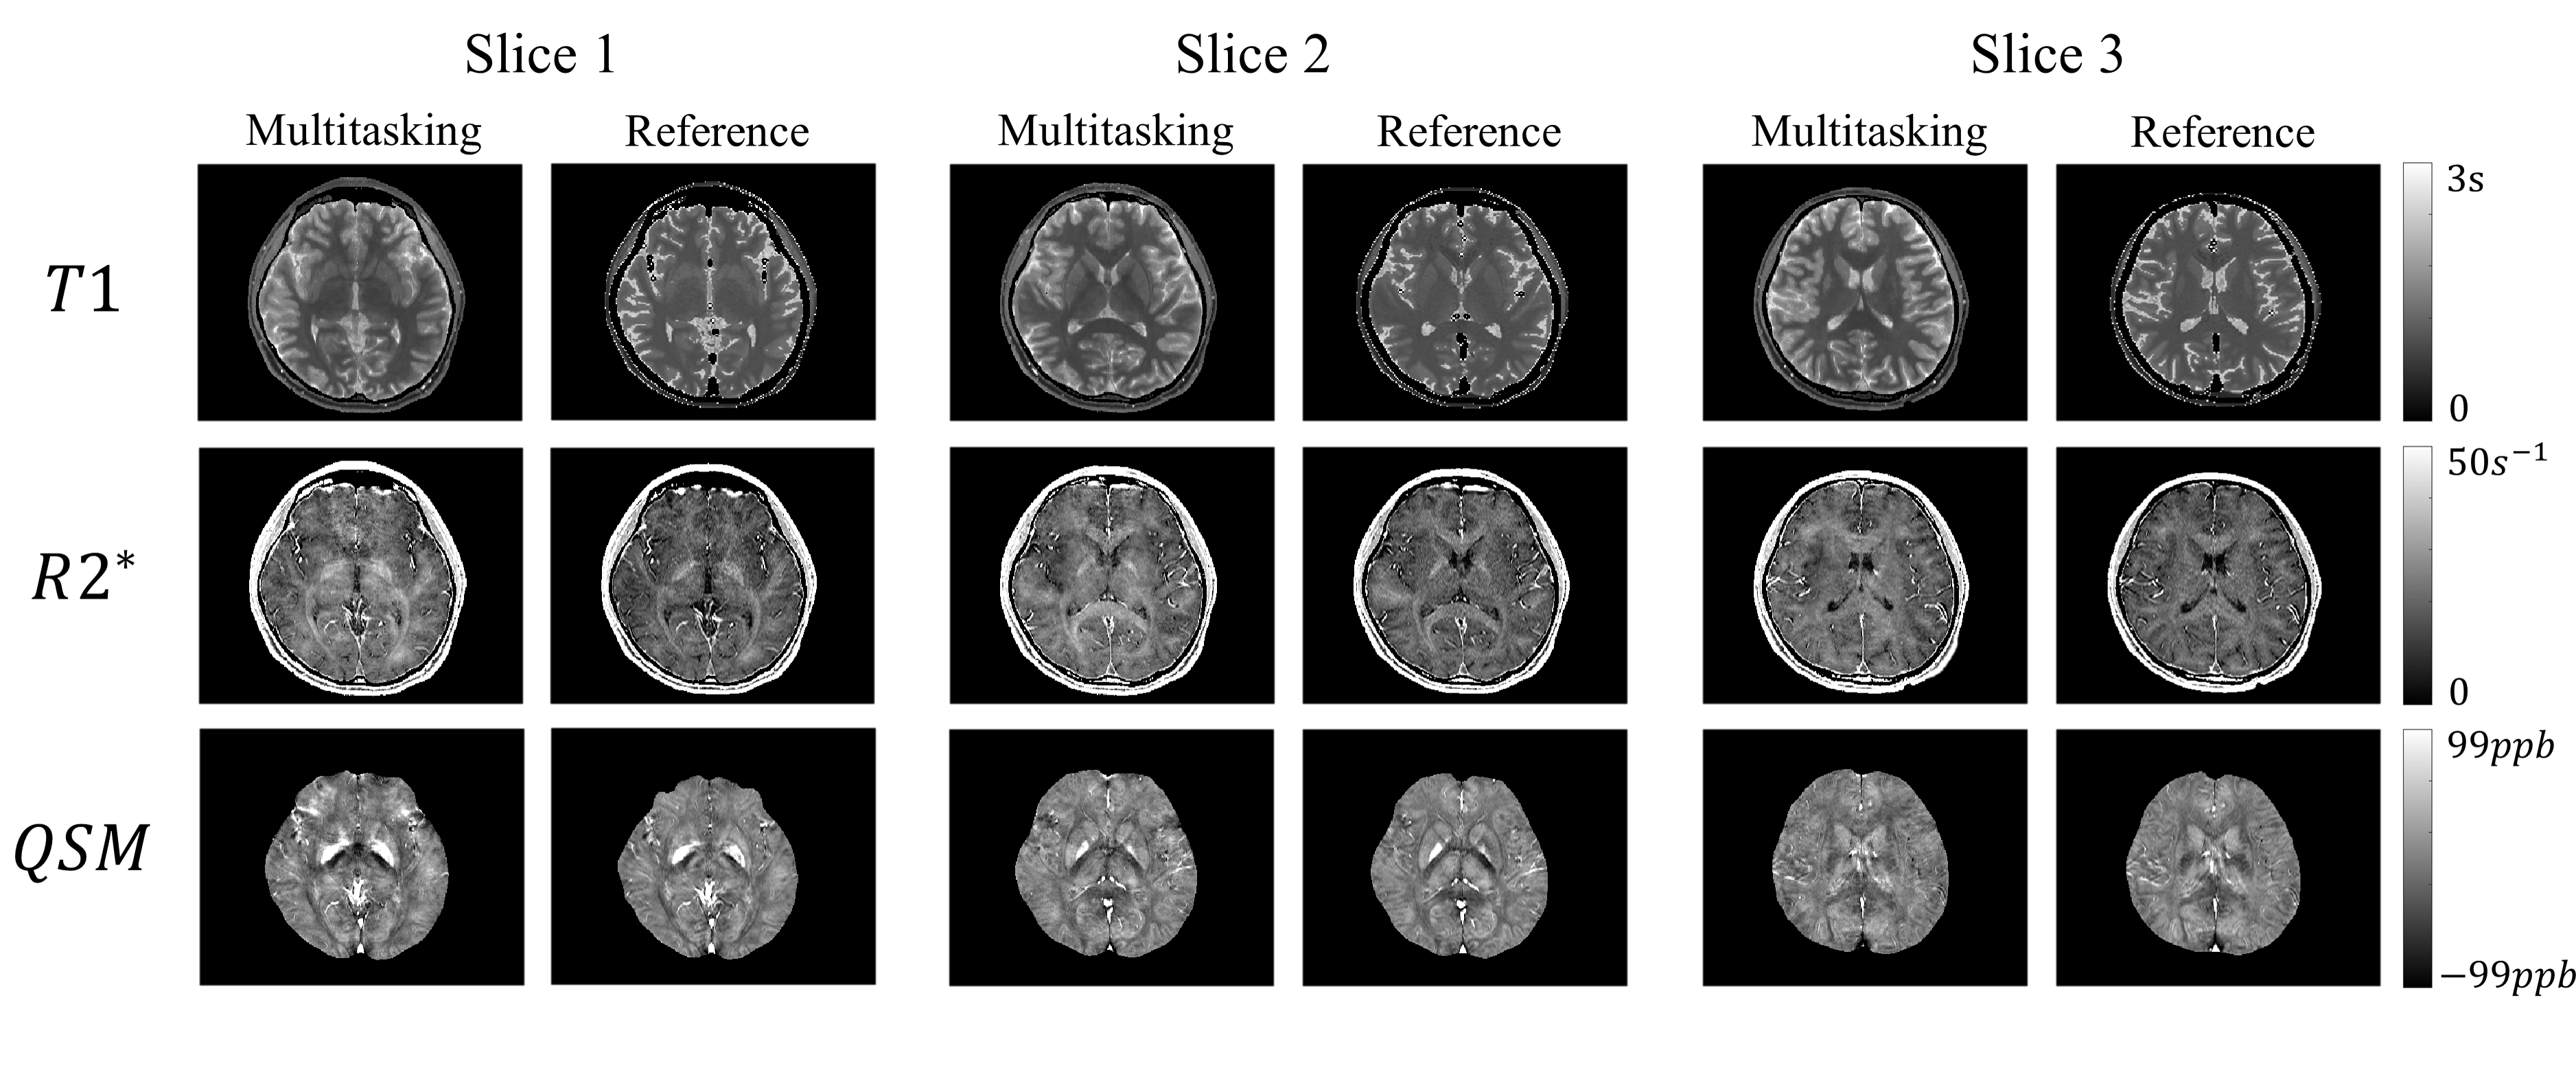
The comparison between different mappings from both methods are found in Fig. 2. For bothT1 mapping and R2* mapping, the overall tissue structures and the contrasts were preserved in our proposed method, which agreed with the reference. Additionally, QSM from multitasking (Slice 1), compared with the reference, was also able to differentiate caudate nucleus, putamen, and globus pallidus and offered similar visualization of the microvasculature throughout all slices.Table 1 summarized the gray matter (GM) and white matter (WM) measurements. Multitasking produced higher T1 values for GM, although the overall T1 values were still within the literature range 10. For other parameters, however, there were no substantial differences. The results for ICC are summarized in Table 2 and the indexes were all above 0.8, indicating excellent agreement with the references.
Created SWI, tSWI and their minimum projection are shown in Fig 3, which enhanced the contrast between tissue and vasculature.
Discussion and Conclusion
In this work, we proposed a simultaneous T1, R2* and susceptibility mapping technique based on the multitasking framework. It is substantially faster than common sequences which can take 25 min or even longer for whole-brain coverage. Based on the visual comparison and statistical analyses, the proposed multitasking method yielded consistent results with the references. The proposed method has the potential to be intrinsically less sensitive to image mis-registration and less time consuming, thus allowing easier and more robust clinical application. The scan time could be potentially reduced in the future by further optimization of flip angle and SNR. Advanced motion handling to reduce the effect of interscan motion will be explored in future works, as the general Multitasking framework has demonstrated excellent abilities in motion-resolved, motion-compensated, and motion-removed imaging7. Further clinical validation is warranted.Acknowledgements
No acknowledgement found.References
1. Callaghan, Martina F., et al. "A general linear relaxometry model of R1 using imaging data." Magnetic resonance in medicine 73.3 (2015): 1309-1314.
2. Stevenson, V. L., et al. "Variations in T1 and T2 relaxation times of normal appearing white matter and lesions in multiple sclerosis." Journal of the neurological sciences 178.2 (2000): 81-87.
3. Bergamino, M., et al. "A review of technical aspects of T1-weighted dynamic contrast-enhanced magnetic resonance imaging (DCE-MRI) in human brain tumors." Physica Medica 30.6 (2014): 635-643.
4. Bazin, Pierre-Louis, et al. "A computational framework for ultra-high resolution cortical segmentation at 7 Tesla." Neuroimage 93 (2014): 201-209.
5. Chavhan, Govind B., et al. "Principles, techniques, and applications of T2*-based MR imaging and its special applications." Radiographics 29.5 (2009): 1433-1449.
6. Haacke, E. Mark, et al. "Quantitative susceptibility mapping: current status and future directions." Magnetic resonance imaging 33.1 (2015): 1-25.
7. Christodoulou, Anthony G., et al. "Magnetic resonance multitasking for motion-resolved quantitative cardiovascular imaging." Nature biomedical engineering 2.4 (2018): 215.
8. Haacke, E. Mark, et al. "Susceptibility weighted imaging (SWI)." Magnetic Resonance in Medicine: An Official Journal of the International Society for Magnetic Resonance in Medicine 52.3 (2004): 612-618.
9. Liu, Saifeng, et al. "Improved MR venography using quantitative susceptibility‐weighted imaging." Journal of Magnetic Resonance Imaging 40.3 (2014): 698-708.
10. Wansapura, Janaka P., et al. "NMR relaxation times in the human brain at 3.0 tesla." Journal of Magnetic Resonance Imaging: An Official Journal of the International Society for Magnetic Resonance in Medicine 9.4 (1999): 531-538.
11. Chen, Yongsheng, et al. "STrategically Acquired Gradient Echo (STAGE) imaging, part I: Creating enhanced T1 contrast and standardized susceptibility weighted imaging and quantitative susceptibility mapping." Magnetic resonance imaging 46 (2018): 130-139.
12. Metere, Riccardo, et al. "Simultaneous quantitative MRI mapping of T1, T2* and magnetic susceptibility with multi-echo MP2RAGE." PloS one 12.1 (2017): e0169265.
13. Langkammer, Christian, et al. "Quantitative susceptibility mapping (QSM) as a means to measure brain iron? A post mortem validation study." Neuroimage 62.3 (2012): 1593-1599.
14. Guan, Xiaojun, et al. "Regionally progressive accumulation of iron in Parkinson's disease as measured by quantitative susceptibility mapping." NMR in Biomedicine 30.4 (2017).
15. Guan, Xiaojun, et al. "Influence of regional iron on the motor impairments of Parkinson's disease: a quantitative susceptibility mapping study." Journal of Magnetic Resonance Imaging 45.5 (2017): 1335-1342.
Figures