0876
Three-dimensional MRF obtains highly repeatable and reproducible multi-parametric estimations in the healthy human brain at 1.5T and 3T1IRCCS Stella Maris, Pisa, Italy, 2Imago7 Foundation, Pisa, Italy, 3Istituto Nazionale di Fisica Nucleare, Pisa, Italy, 4Department of Radiology, University of Cambridge, Cambridge, United Kingdom, 5University of Pisa, Department of Physics, Pisa, Italy, 6U.O. Neuroradiologia, Azienda Ospedaliera Universitaria Pisana (AOUP), Pisa, Italy, 7University of Pisa, Department of Translational Research and New Technologies in Medicine and Surgery, Pisa, Italy, 8Fondazione Toscana Gabriele Monasterio, Pisa, Italy, 9U.O.C. Risonanza Magnetica Specialistica e Neuroradiologia, Fondazione CNR/Regione Toscana G. Monasterio, Pisa, Italy, 10Technical University of Munich, Munich, Germany, 11GE Healthcare, Munich, Germany
Synopsis
Three-dimensional magnetic resonance fingerprinting with spiral projection k-space trajectory offers fully-quantitative estimations at a high spatial resolution. To assess the repeatability and reproducibility of the estimations, we acquired test/re-test data in the human brain at 1.5T and 3.0T in a travelling head study involving a total of 12 subjects and 8 different MR scanners. Our approach estimated voxel-wise performance in the CNS: variability was assessed using coefficients-of-variation, bias using a GLM analysis. Solid matter repeatability CVs were under 2% for nPD/T1, and 5% for T2, while reproducibility biases were under 10% in solid matter compartments for T1/T2.
Introduction:
Magnetic Resonance Fingerprinting (MRF) efficiently samples the transient state of the MRI signal to extract multi-parametric, fully quantitative maps1. Recent studies have shown a high repeatability of T1 and T2 values by 2D SSFP MR Fingerprinting2 in the ISMRM/NIST phantom3, as well as in human volunteers4,5. MR Fingerprinting has also been extended to three-dimensional acquisitions6,7,8 for improved spatial resolution and diagnostic value, as well as high repeatability9. In order to assess the repeatability and reproducibility of 3D SSFP MRF, we acquired test/re-test data in the human brain at 1.5T and 3.0T in a travelling head study involving a total of 12 subjects and 8 different MR scanners from a single vendor.Methods:
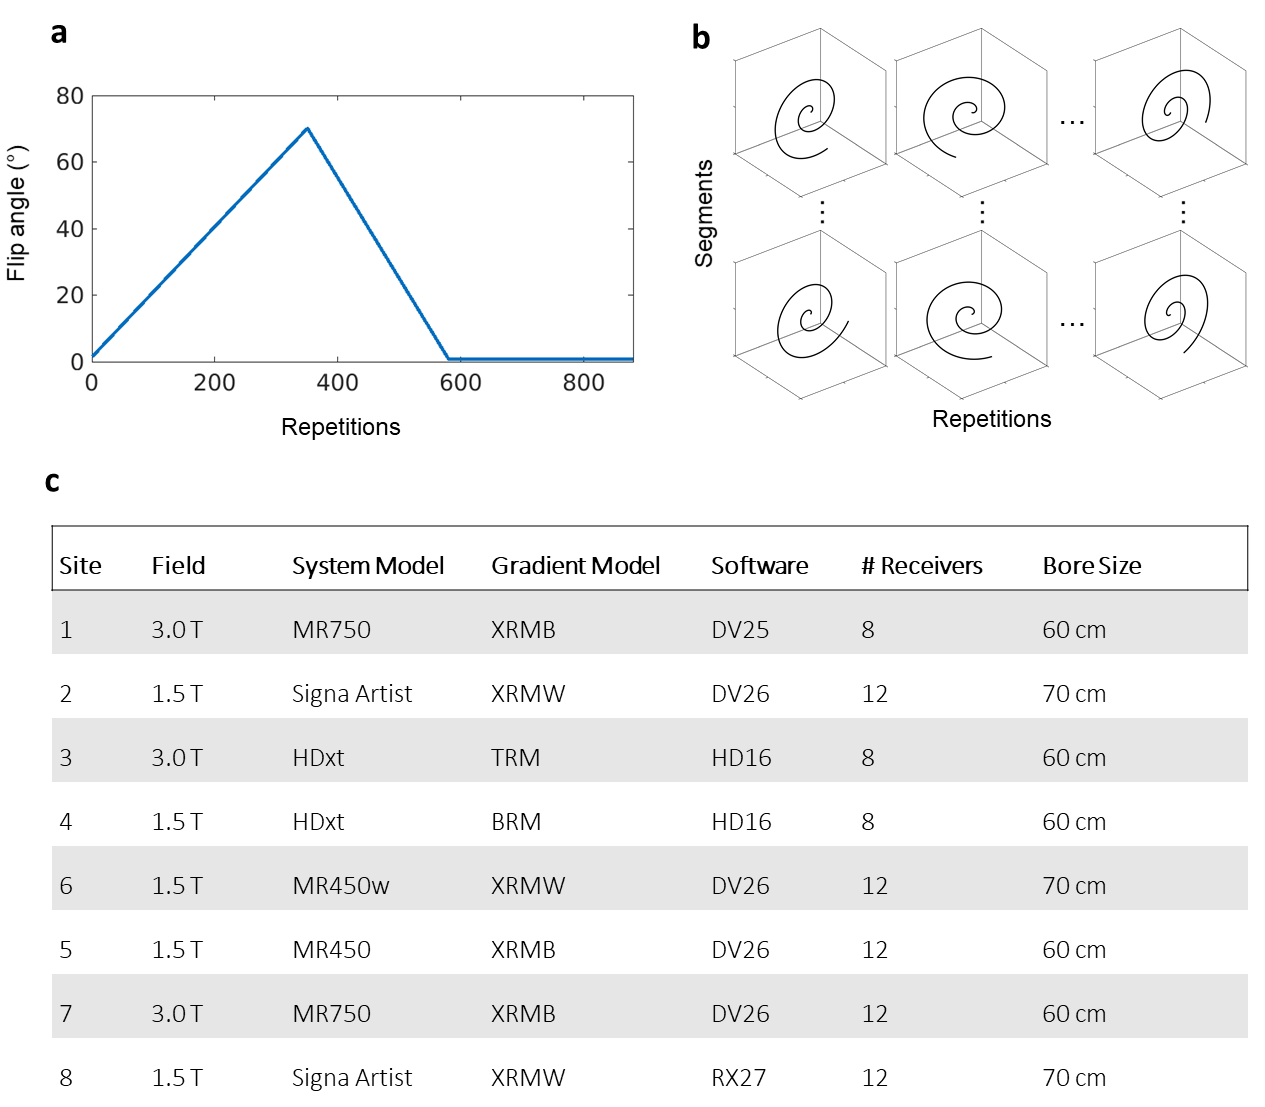
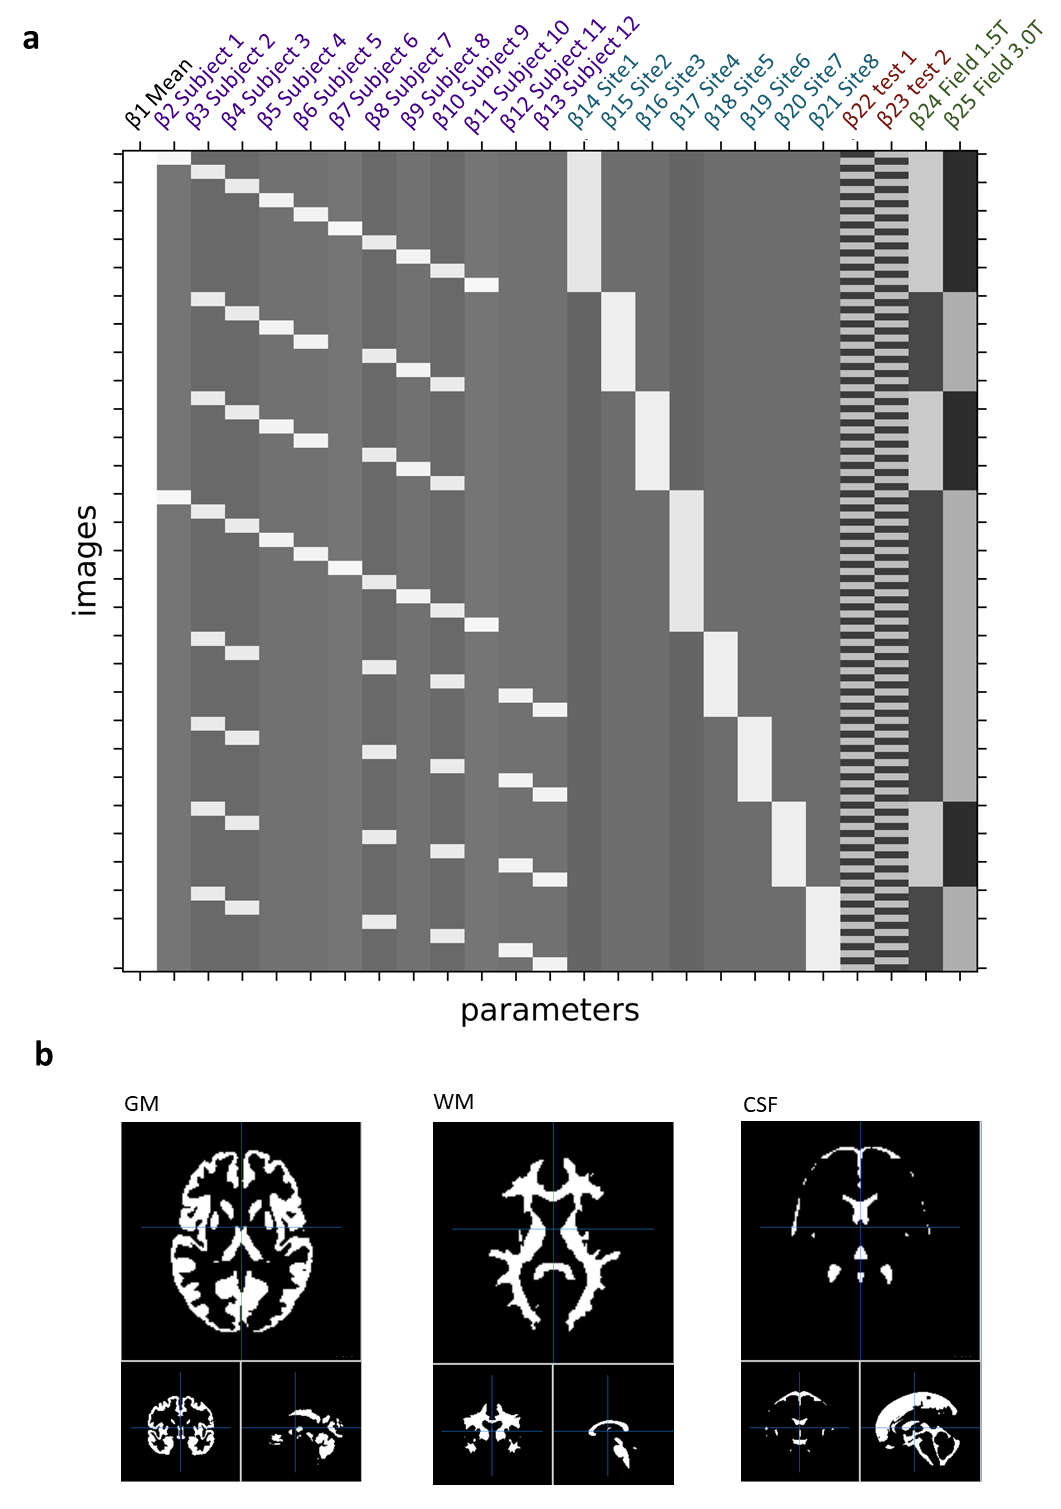
The data were acquired on eight separate systems as shown in Figure 1c, all from the same vendor (GE Healthcare, Chicago, IL), each operating either at 1.5T or 3.0T and each with different hardware (RF/gradient coils) and software release. With local ethical approval, human subjects were imaged in two identical sessions per scanner, each including a 3D steady-state free precession MRF with spiral projection k-space acquisition8. Subjects were removed from the scanner between imaging sessions. To allow for a general linear model (GLM) analysis, each subject was scanned in multiple MR scanners (Figure 2a). The subjects received also a FSPGR scan at 3T at the same spatial resolution as 3D MRF. The MRF acquisition trajectories used undersampled spiral projection interleaves (see Figure 1b) with FOV = (225mm)3, matrix = 200x200x200, sampling bandwidth = ±250kHz, TE/TR = 0.5/11 ms. The scan parameters are shown in Figure 1. The spirals were rewound and followed by a spoiler z-gradient achieving 4pi/mm dephasing. The maximum gradient amplitude was 20mT/m and slew rate was 70T/m/s. The analysis in this work did not apply system-specific gradient delay or trajectory correction. MRF maps were obtained by inner-product pattern matching and the MRF dictionary was computed using the extended phase graphs formalism10, without including B0 or B1 effects in the model. M0 values were reported self-normalised to the average inside the brain mask (PDn).Analysis: the analysis pipeline matched Buonincontri et al4. The quantitative maps for every test were rigidly co-registered to their respective re-test using Statistical Parametric Mapping (SPM 12) Toolbox11. After registration, each subject’s volumetric image was warped to match a custom DARTEL atlas (made using the 3D FSPGR). After applying 6mm Gaussian smoothing, coefficients of variation were calculated between each voxel in test and retest measurements to measure the associated variability. Values were reported averaged on each tissue class, using a threshold of 70% probability as a mask per each tissue (Figure 2b). A general linear model was also estimated assessing the biases associated with each covariate in the experiment including: test, field, subject and site (Figure 2a).
Results:
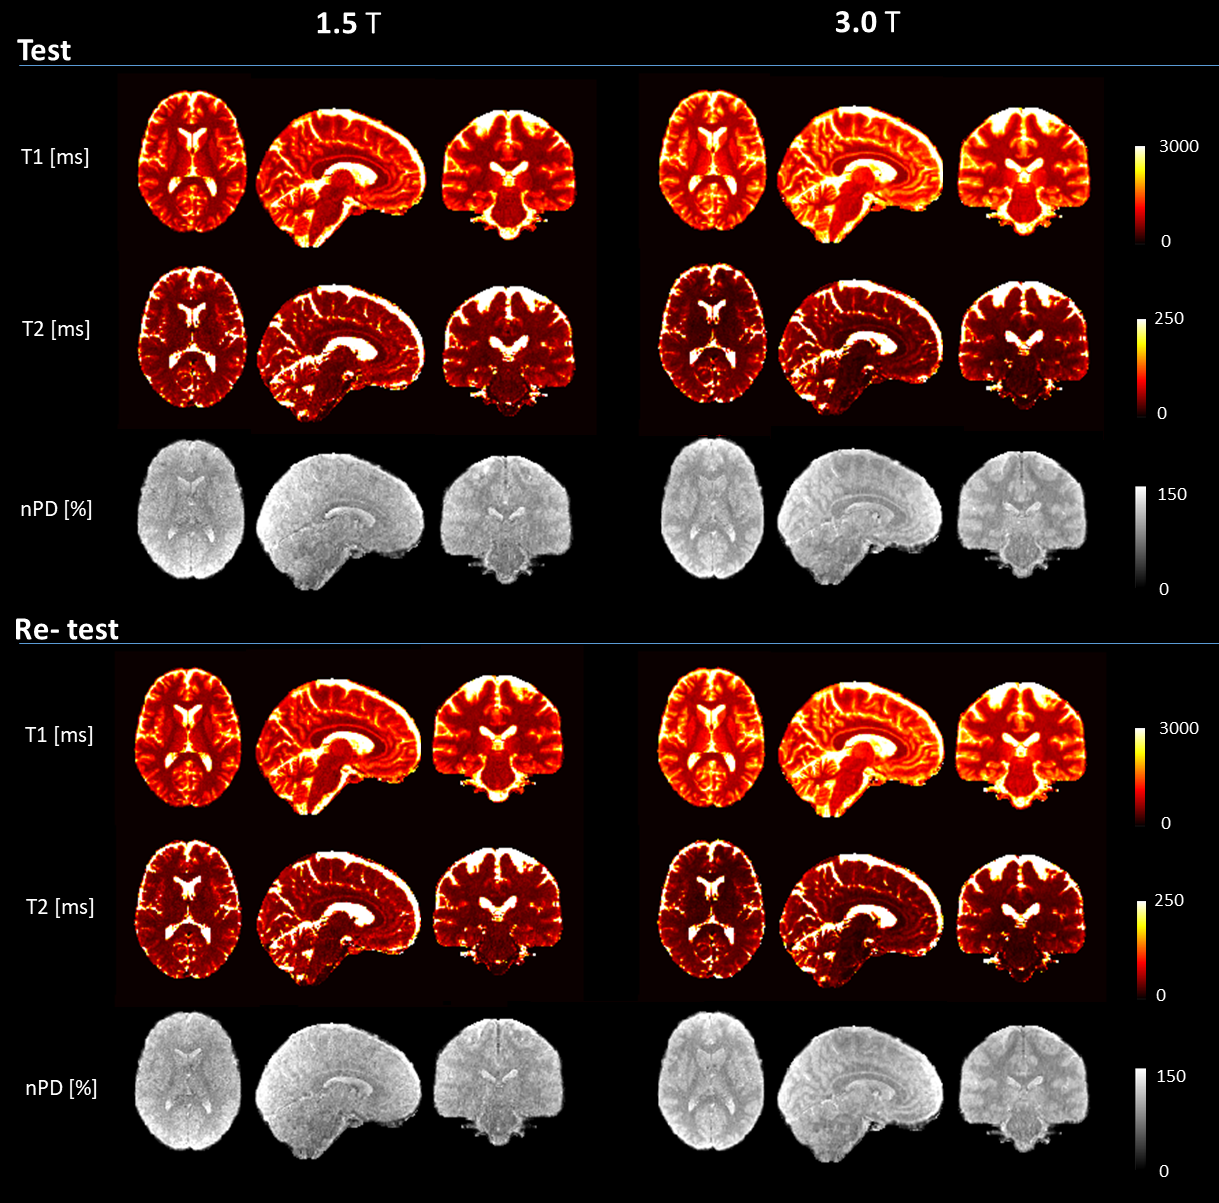
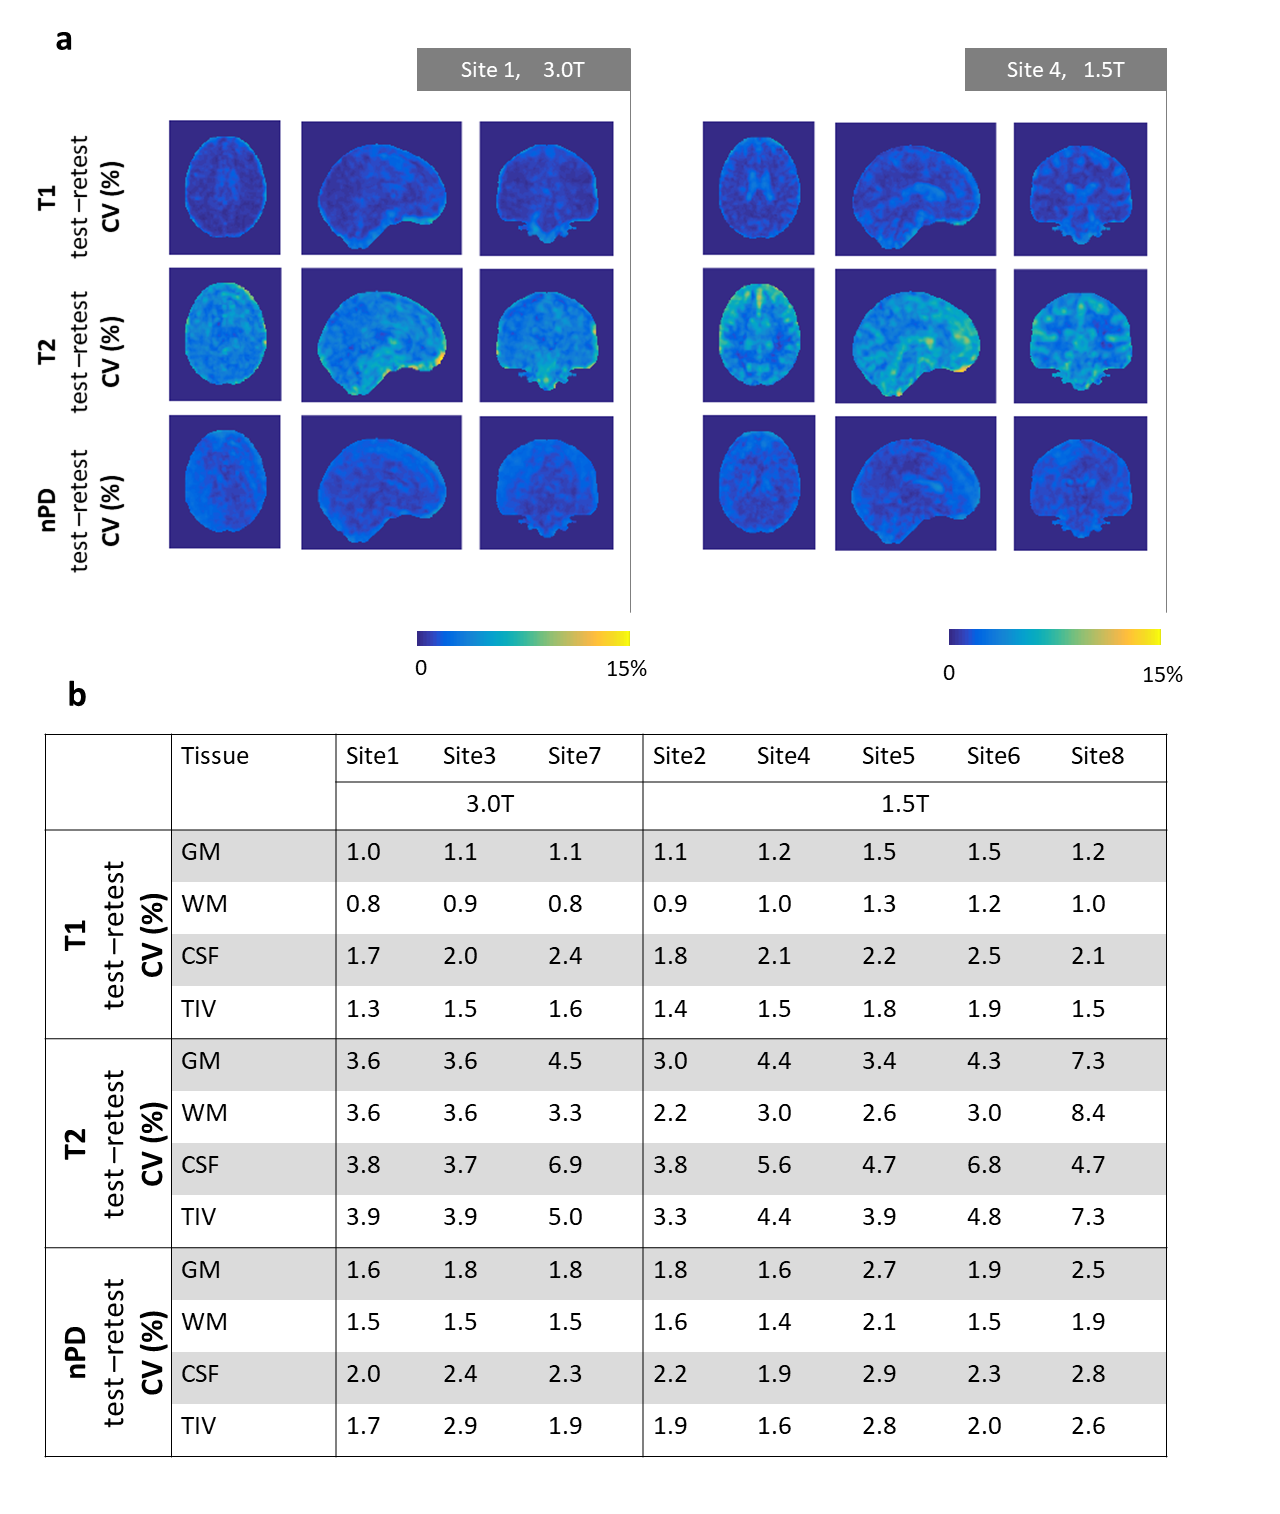
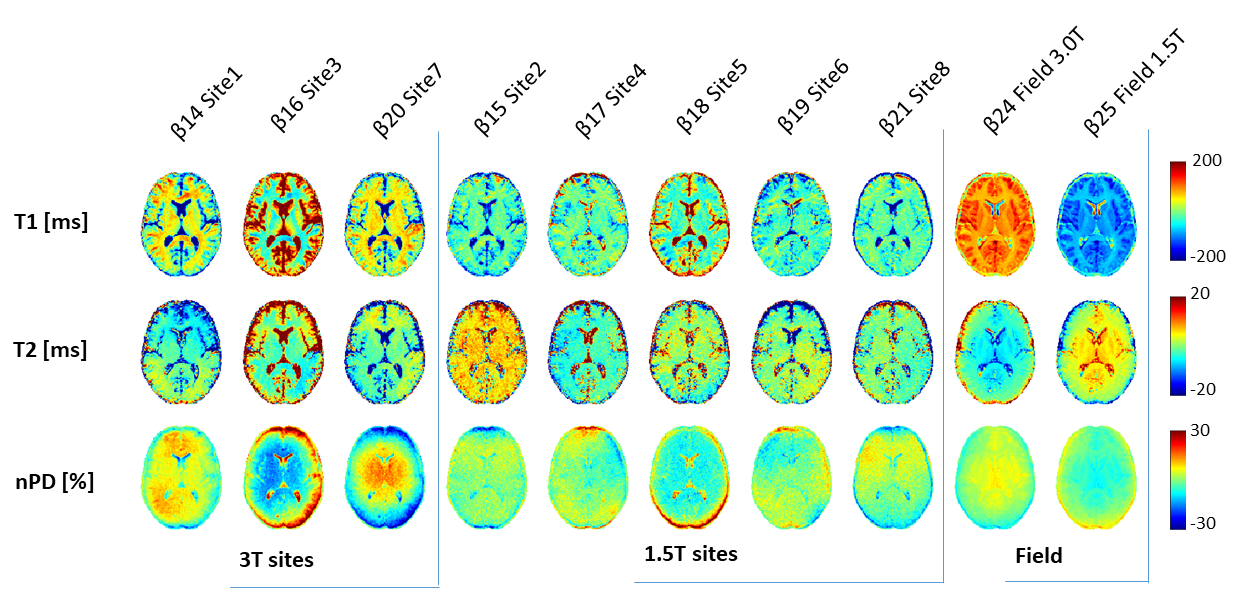
Sample co-registered MRF images are shown in Figure 3, showing fully-quantitative maps with a high anatomical detail and values within literature ranges. Voxel-wise coefficients of Variation (CV) between test and re-test are shown in Figure 4, showing solid matter repeatability CVs under 2% for nPD andT1, and 5% for T2 (with the exception of site 8 with CV around 8%). Figure 5 shows the biases associated with field strength and each individual scanner. Biases associated with site were under 10% for T1 and T2 in solid matter compartments. T1 showed uniform bias, while T2 displayed the bias pattern typical of B1+ effects at 3.0T, where PDn bias spatial distribution was consistent with the different receiver coil profiles.Discussion:
We assessed repeatability and reproducibility of 3D MRF at eight separate imaging systems, which included both 1.5 T and 3.0 T. Importantly, our assessment was not limited to regions-of-interest, but estimated voxel-wise performance; variability was assessed using coefficients-of-variation, bias using a GLM analysis. Reproducibility values were in agreement with a similar analysis performed on 2D MRF data4, while repeatability values were improved by approximately a factor of two. This was perhaps due to the smaller registration errors and partial volumes, as well as higher SNR efficiency. The data here presented were in line with other quantitative assessments of repeatability and reproducibility in the literature using other common mapping techniques12,13,14. Iterative reconstructions, the inclusion of B1+ or B1- in the model, and a full characterization of the systems (such as gradient delay and trajectory estimation) may further improve the robustness of these 3D MRF quantifications.In conclusion, three-dimensional MRF with spiral projection k-space trajectory obtains detailed parametric maps with highly repeatable and reproducible nPD, T1 and T2 values.
Acknowledgements
Support from the Italian Ministry of Health and the Tuscany Region under the project “Ricerca Finalizzata”, Grant n. GR-2016-02361693. Funding from the EMPIR Programme 18HLT05 QUIERO Project, co-financed by the Participating States and from the European Union’s Horizon 2020 Research and Innovation Programme.
References
1. Ma D, Gulani V, Seiberlich N, et al. Magnetic resonance fingerprinting. Nature. 2013;495(7440):187-192.
2. Y. Jiang, D. Ma, N. Seiberlich, et al. MR fingerprinting using fast imaging with steady state precession (FISP) with spiral readout. Magn. Reson. Med., 74 (2015), pp. 1621-1631
3. Y. Jiang, D. Ma, K.E. Keenan et al. Repeatability of magnetic resonance fingerprinting T1 and T2 estimates assessed using the ISMRM/NIST MRI system phantom. Magn. Reson. Med., 78 (2017), pp. 1452-1457
4. Buonincontri G, Biagi L, Retico A, et al. Multi-site repeatability and reproducibility of MR fingerprinting of the healthy brain at 1.5 and 3.0T. Neuroimage 2019;195:362-372.
5. Korzdorfer G, Kirsch R, Liu K, et al. Reproducibility and Repeatability of MR Fingerprinting Relaxometry in the Human Brain. Radiology 2019;292(2):429-437.
6. Ma, D. et al. Fast 3D magnetic resonance fingerprinting for a whole-brain coverage. Magn. Reson. Med. 79, 2190–2197 (2018).
7. C. Liao, B. Bilgic, M.K. Manhard et al. 3D MR fingerprinting with accelerated stack-of-spirals and hybrid sliding-window and GRAPPA reconstruction NeuroImage, 162 (2017), pp. 13-22
8. Cao, X. et al. Fast 3D brain MR fingerprinting based on multi-axis spiral projection trajectory. Magn Reson Med 82, 289 (2019).
9. Ma D, Jones SE, Deshmane A, et al. Development of high‐resolution 3D MR fingerprinting for detection and characterization of epileptic lesions. J Magn Reson Imaging 2018;1–14.
10. Weigel, M. Extended phase graphs: Dephasing, RF pulses, and echoes - pure and simple. J. Magn. Reson. Imaging (2014). doi:10.1002/jmri.24619
11. J. Ashburner. SPM: a history. Neuroimage, 62 (2012), pp. 791-800
12. B.A. Landman, A.J. Huang, A. Gifford et al. Multi-parametric neuroimaging reproducibility: a 3-T resource study. Neuroimage, 54 (2011), pp. 2854-2866
13. C.M. Bauer, H. Jara, R. Killiany, et al Whole brain quantitative T2 MRI across multiple scanners with dual echo FSE: applications to AD, MCI, and normal aging Neuroimage, 52 (2010), pp. 508-514
14. S.C. Deoni, S.C. Williams, P. Jezzard et al. Standardized structural magnetic resonance imaging in multicentre studies using quantitative T1 and T2 imaging at 1.5 T Neuroimage, 40 (2008), pp. 662-671
Figures