0870
Liver Dixon MR Fingerprinting: T1, T2, T2* and fat fraction tissue characterization1Biomedical Engineering Department, School of Biomedical Engineering and Imaging Sciences, King's College London, London, United Kingdom, 2Biomedical Imaging Center, Pontificia Universidad Católica de Chile, Santiago, Chile, 3Millennium Nucleus for Cardiovascular Magnetic Resonance, Santiago, Chile, 4Philips Healthcare, London, United Kingdom, 5Instituto de Ingeniería Matemática y Computacional, Pontificia Universidad Católica de Chile, Santiago, Chile, 6Millennium Nucleus Center for the Discovery of Structures in Complex Data, Chile, Santiago, Chile
Synopsis
Quantitative T1, T2, T2* and fat fraction (FF) maps are promising imaging biomarkers for the assessment of liver disease. Magnetic Resonance Fingerprinting has been recently proposed for fast T1, T2 and M0 mapping of the liver, however in the presence of high iron or fat concentrations corrections using separately acquired T2* and FF maps are needed. Here we propose a novel approach which enables simultaneous liver T1, T2, T2* and FF maps from a single ~15s breath-hold scan. The proposed approach was evaluated on phantoms, 8 healthy subjects and 2 patients in comparison to conventional mapping techniques.
Introduction
Quantitative T1, T2, T2* and fat fraction (FF) maps are promising imaging biomarkers for the assessment and follow-up of liver disease, which includes characterization of tumors, iron overload, lipid content and fibrosis1. Magnetic Resonance Fingerprinting (MRF2) has been recently proposed for fast T1, T2 and M0 mapping of the liver3. However in the presence of high iron or fat concentrations, the T1 measurements are inaccurate and corrections using separately acquired T2* and FF maps have been proposed1,4. These maps are acquired sequentially with different spatial resolution and potentially at different respiratory positions. Here we proposed a novel approach which enables simultaneous liver T1, T2, T2* and FF mapping in a single ~15s breath-hold scan.Methods
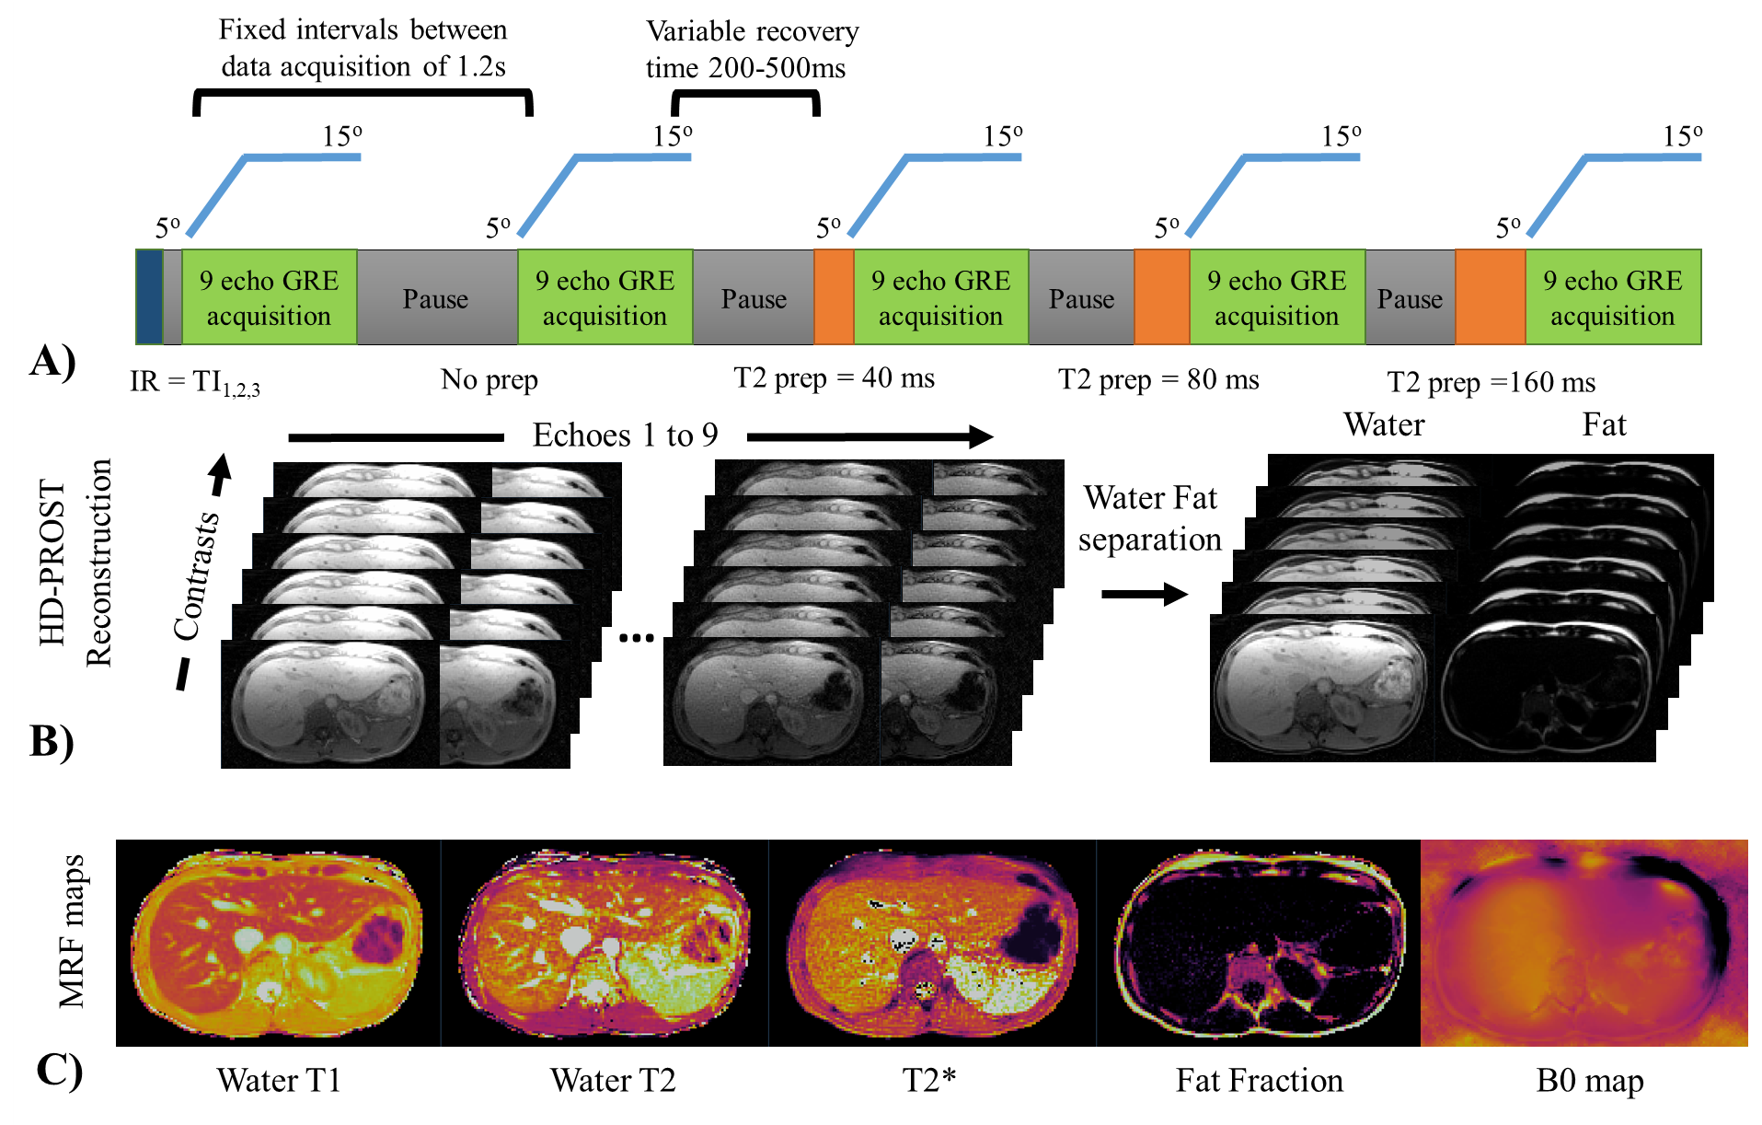
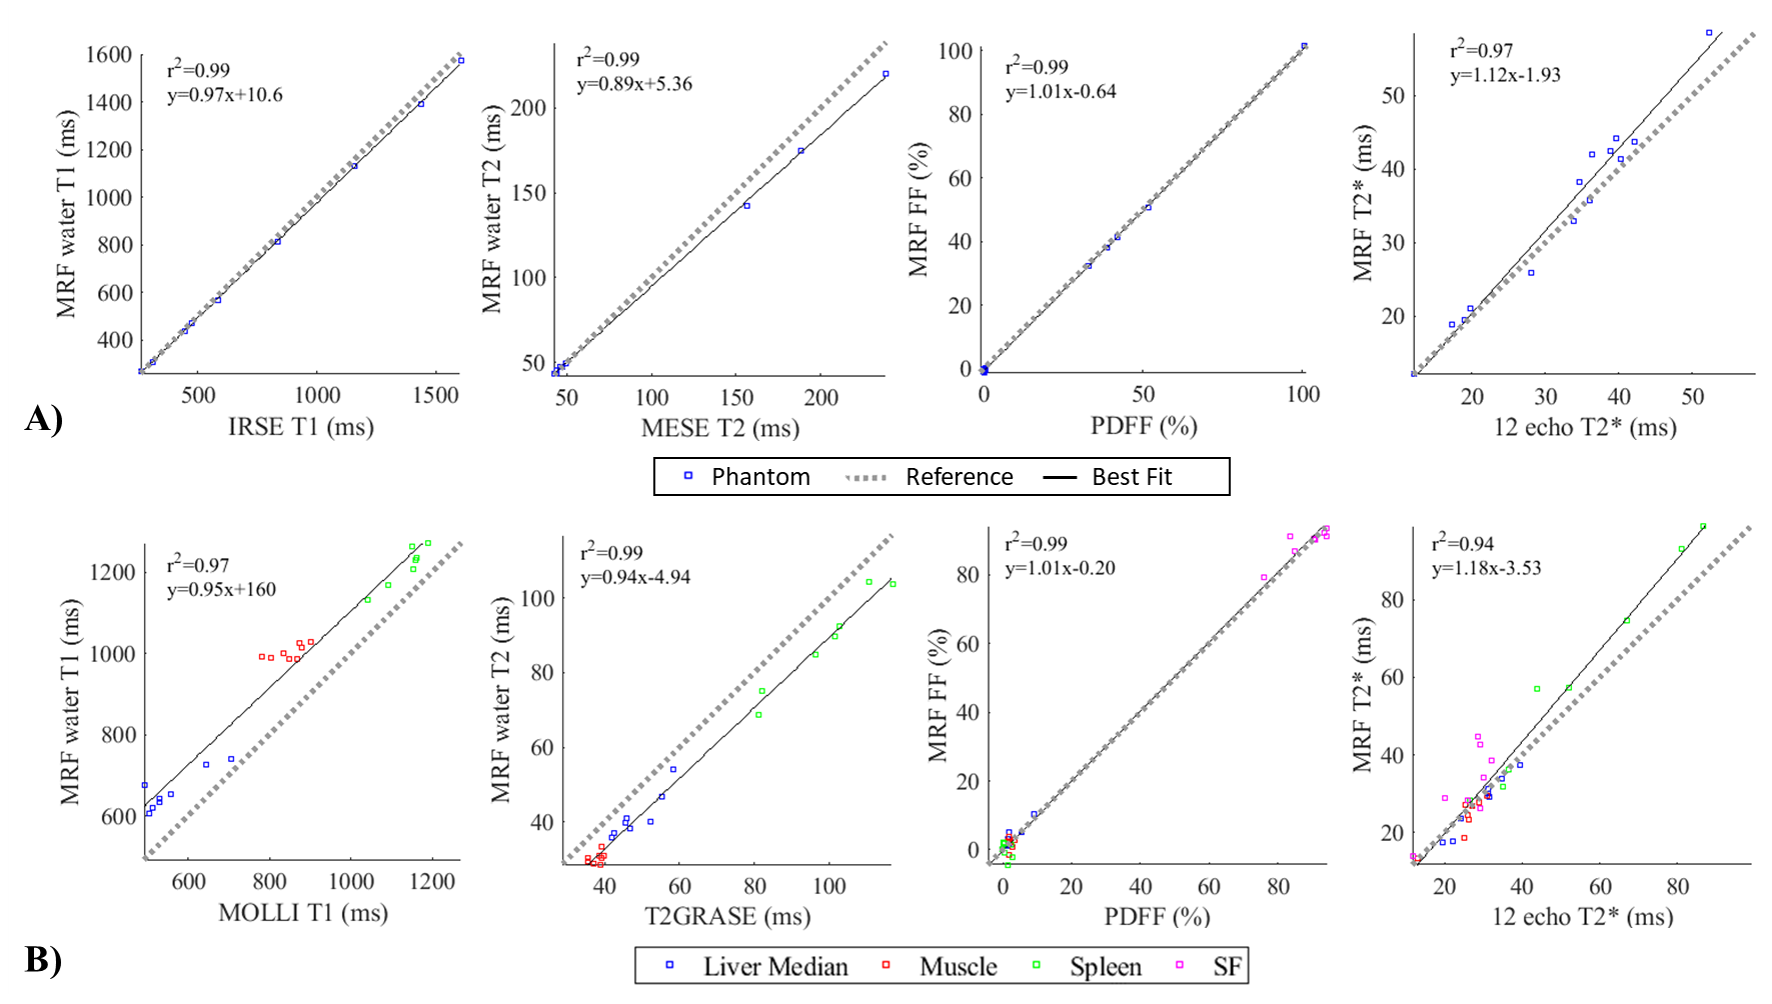
A gradient echo (GRE) liver MRF sequence with nine bipolar readouts per TR, low flip angles (5-15o), varying magnetisation preparation and golden angle radial trajectory5,6 is proposed (Fig.1A). The proposed liver MRF acquisition includes nine inversion recovery (IR) and T2 preparation (T2prep) pulses (IR12ms, noPrep, T2prep40ms, T2prep80ms, T2prep160ms, IR300ms, noPrep, T2prep40ms, T2prep80ms, T2prep160ms, IR12ms, noPrep) with varying recovery time (~200-500ms) between each acquisition of 700ms duration (Fig.1A). Reconstruction is performed using dictionary-based SVD (singular value decomposition) temporal compression and patch-based multi-contrast reconstruction (HD-PROST)7. Graph-cut water/fat separation8 is used to estimate T2* and B0 from the first singular image. These estimates are fixed and used to recover the water and fat singular images from the 9 echoes singular images (Fig.1B)6. T1, T2 and M0 maps are obtained through dot product matching of the singular images for both water and fat, whereas the FF map is obtained from the water and fat M0 maps. Measurements were performed on a 1.5T scanner (Ingenia, Philips Healthcare) in a standardized T1/T2 phantom9, a water/fat partial volume in-house phantom, 8 healthy subjects (age: 31.5 ± 4 years, body mass index (BMI): 25.1 ± 3.7 kg/m2) and 2 patients (age: 55 and 65 years, BMI : 27.8 and 33.2 kg/m2), and compared to conventional spin echo (IRSE and MESE) and T2*/FF8 (12 echo GRE) measurements in phantom and T1 (MOLLI), T2 (T2GRASE) and T2*/FF (12 echoes GRE) maps acquired in three separate breath-holds in-vivo. Liver MRF acquisition parameters were: TR/TE1/ΔTE= 20/1.5/2ms, 2x2mm2 resolution, 8mm slice thickness, FOV= 496x496mm2, acq. time = 14.4s. Region of interest (ROI) analysis was performed for each phantom vial, liver (median of four regions to avoid bias due to the potential presence of blood vessels), subcutaneous fat (SF), muscle and the spleen.Results
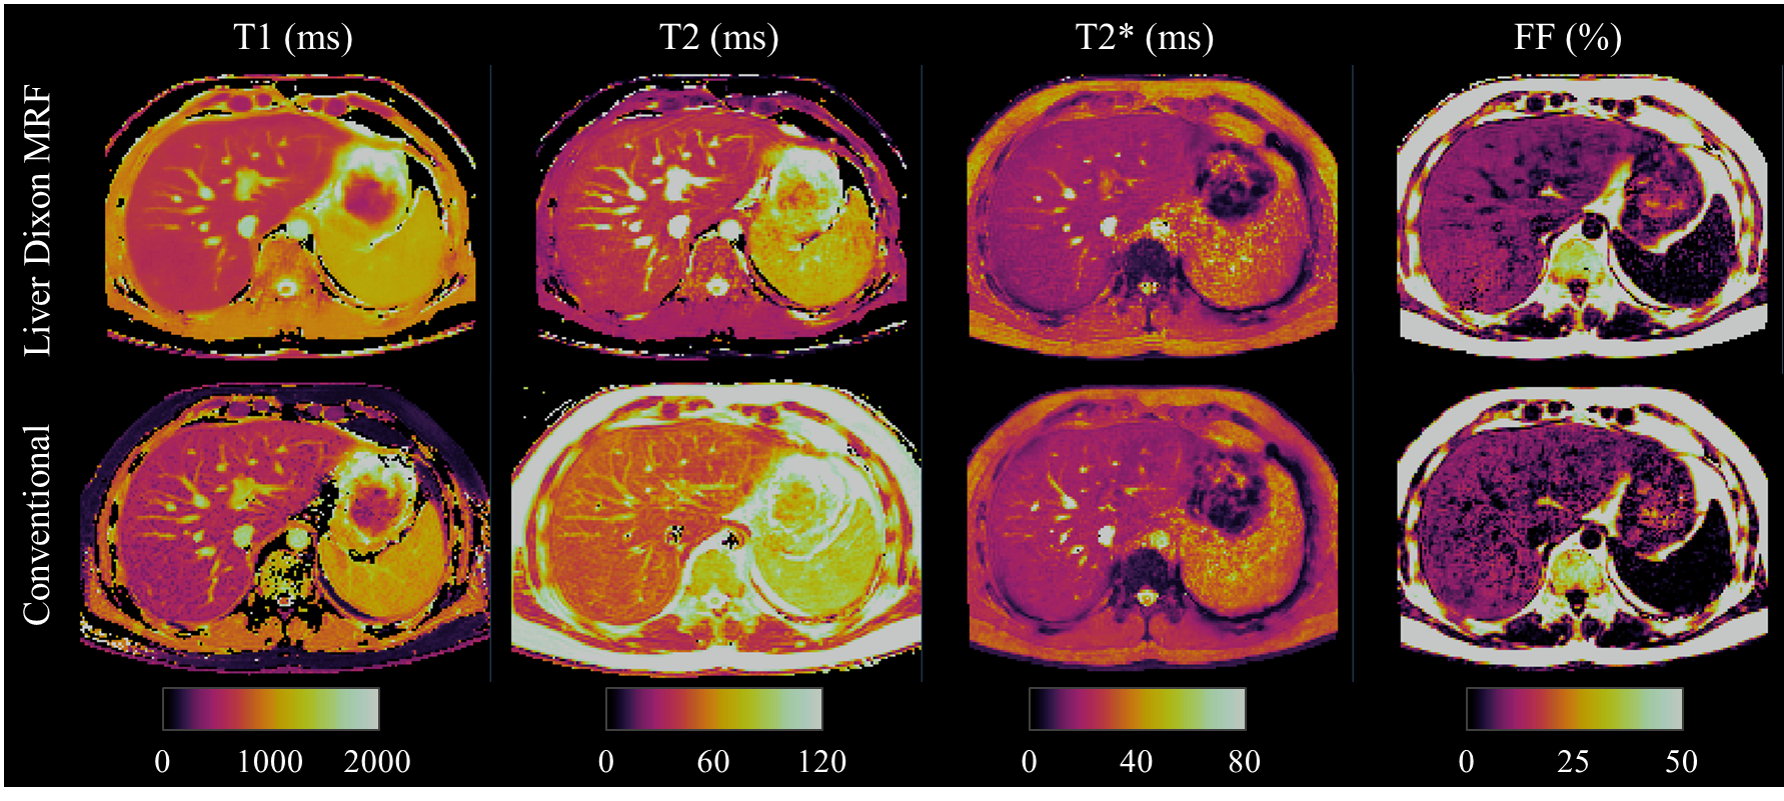
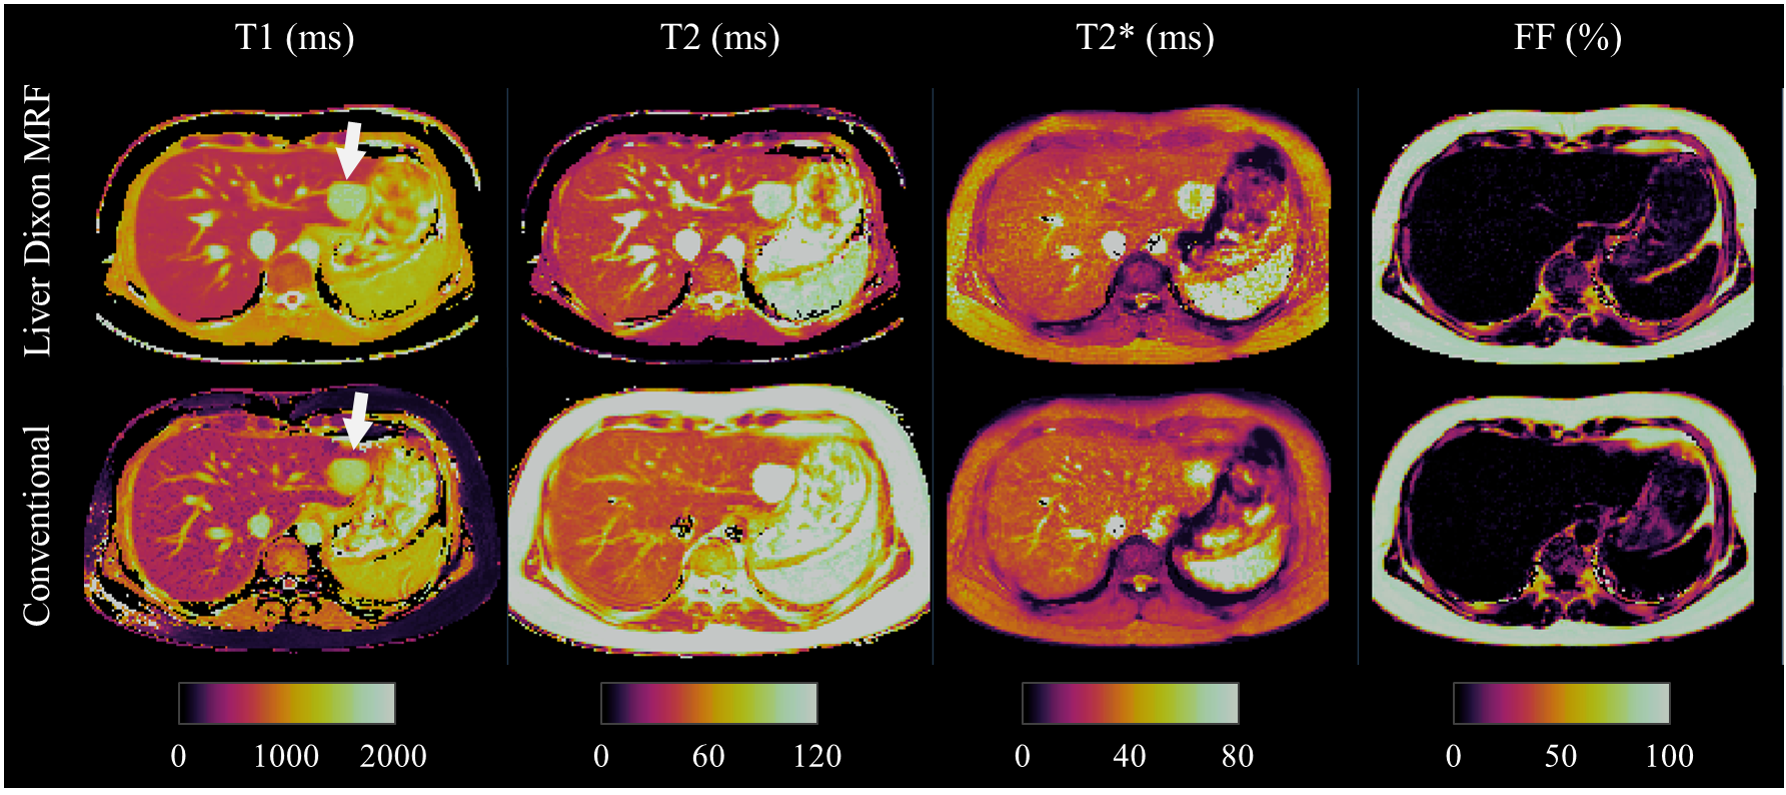
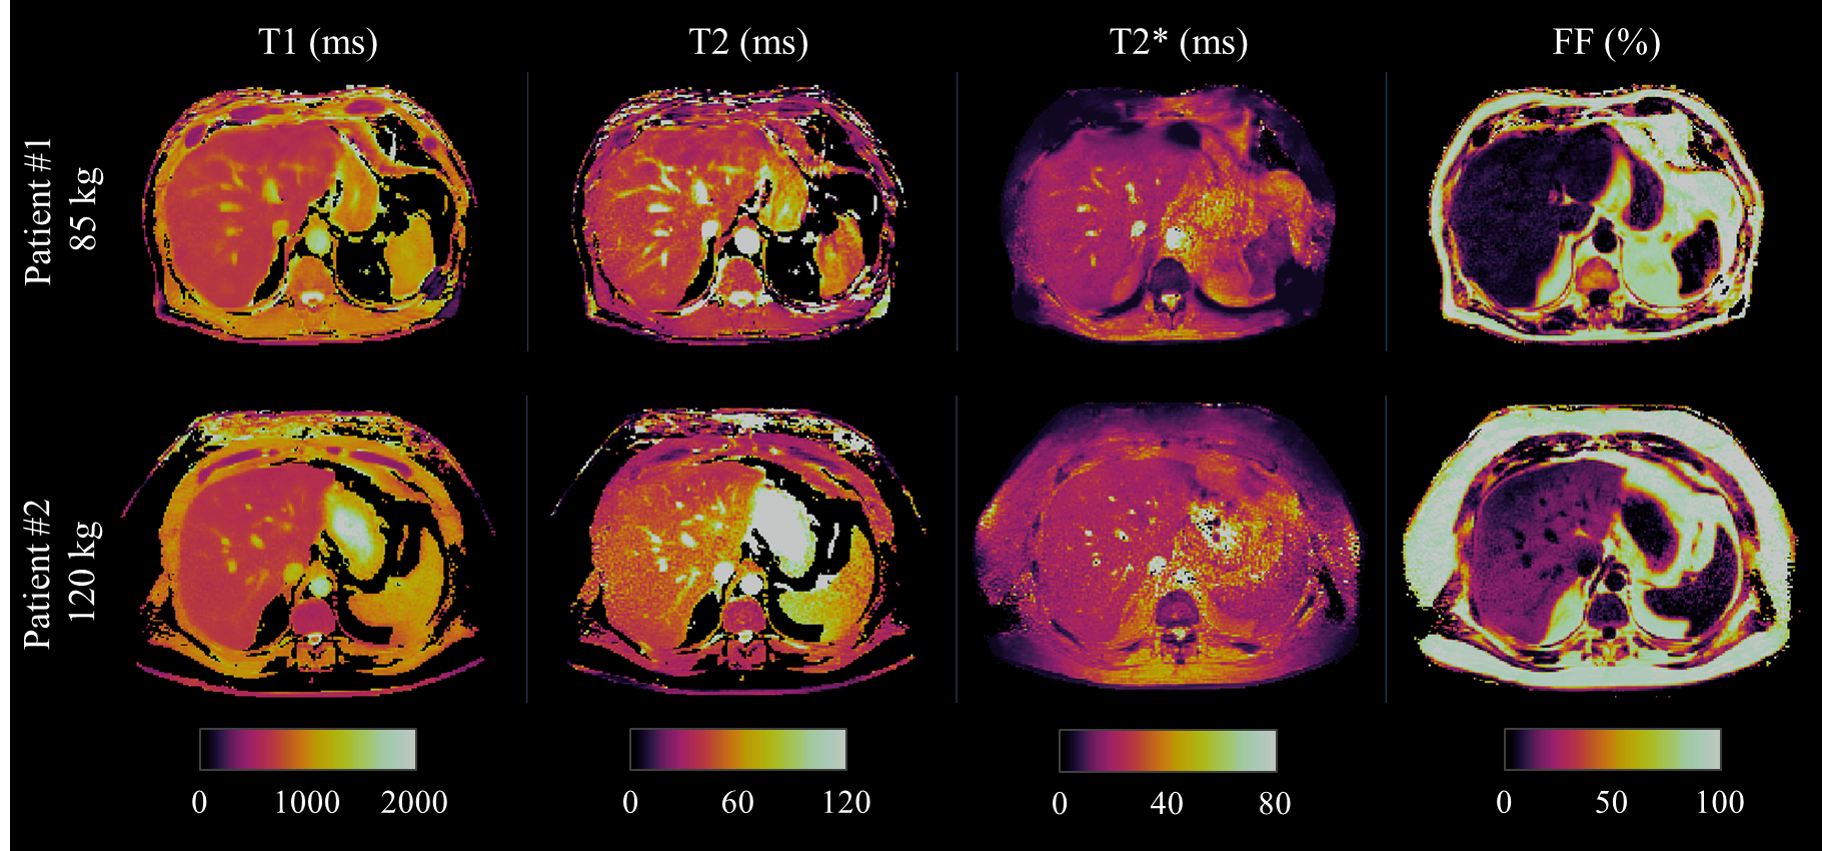
Phantom results with the proposed approach correlate highly (R2>0.97) with the reference measurements for all parameters (Fig.2.A). Figure 2.B shows correlation plots between conventional and proposed in-vivo measurements with lines of best fit for the four parameters of interest. In-vivo map comparisons between conventional and proposed liver MRF measurements for two healthy subjects are shown in Figure 3 and 4 (with slightly elevated FF and a benign hemangioma respectively). In healthy subjects, biases of 110ms, -8.4ms, 2.3ms and 0.05% for T1, T2, T2* and FF respectively were measured when compared to conventional measurements. The difference between measurement methods was statistically significant (p<0.05) for T1, T2 and T2* but not for FF. T1 overestimation compared to MOLLI and underestimation of T2 are consistent with previous MRF findings5,10. Remaining differences between the proposed liver MRF and conventional in-vivo measurements could be explained due to differences in respiratory position, field inhomogeneities, magnetisation transfer and diffusion effects. Two patients scanned during clinical routine are shown in Figure 5, one of which presented high BMI (33.2kg/m2) and elevated FF in the liver (median of 15.25%).Conclusion
A novel 9-echo liver MRF sequence allows for quantitative multi-parametric liver tissue characterization in a single breath-hold scan. Future work will aim to validate the proposed approach in patients with liver disease.Acknowledgements
This work was supported by EPSRC (EP/L015226/1, EP/P001009/1, EP/P032311/1) and Wellcome EPSRC Centre for Medical Engineering (NS/ A000049/1). CSL and CA received funding from Millennium Science Initiative of the Ministry of Economy, Development and Tourism, Government of Chile, grant Nucleus for Cardiovascular Magnetic Resonance and grant Millennium Nucleus Center for Discovery of Structures in Complex Data. CSL was partially funded by Fondecyt #11160728. CA was partially funded by Fondecyt Postdoctorado 2019 #3190763. CSL and CA were funded by CONICYT PCI-REDES180090.References
1. Banerjee, R. et al. Multiparametric magnetic resonance for the non-invasive diagnosis of liver disease. Journal of Hepatology 60, 69–77 (2014).
2. Ma, D. et al. Magnetic resonance fingerprinting. Nature 495, 187–92 (2013).
3. Chen, Y. et al. MR Fingerprinting for Rapid Quantitative Abdominal Imaging. Radiology 279, 278–286 (2016).
4. Tunnicliffe, E. M., Banerjee, R., Pavlides, M., Neubauer, S. & Robson, M. D. A model for hepatic fibrosis: the competing effects of cell loss and iron on shortened modified Look-Locker inversion recovery T 1 (shMOLLI- T 1 ) in the liver. Journal of Magnetic Resonance Imaging 45, 450–462 (2017).
5. Hamilton, J. I. et al. Investigating and reducing the effects of confounding factors for robust T1 and T2 mapping with cardiac MR fingerprinting. Magnetic Resonance Imaging 53, 40–51 (2018).
6. Jaubert, O. et al. Water/Fat Dixon Cardiac Magnetic Resonance Fingerprinting. Magnetic Resonance in Medicine In Press, (2019).
7. Bustin, A. et al. High-Dimensionality Undersampled Patch-Based Reconstruction (HD-PROST) for Accelerated Multi-Contrast Magnetic Resonance Imaging. Magnetic Resonance in Medicine 81, 3705–3719 (2019).
8. Hernando, D., Kellman, P., Haldar, J. P. & Liang, Z.-P. Robust water/fat separation in the presence of large field inhomogeneities using a graph cut algorithm. Magnetic Resonance in Medicine 63, 79–90 (2010).
9. Captur, G. et al. A T1 and ECV phantom for global T1 mapping quality assurance: The T1 mapping and ECV standardisation in CMR (T1MES) program. Journal of Cardiovascular Magnetic Resonance 18, W14 (2016).
10. Hamilton, J. I. et al. MR fingerprinting for rapid quantification of myocardial T1, T2, and proton spin density. Magnetic Resonance in Medicine 77, 1446–1458 (2017).
Figures