0869
An attempt to understand why we measure longer relaxation times in quantitative muscle MRI using MRF than using conventional methods1Leiden University Medical Center, Leiden, Netherlands, 2Philips Research Hamburg, Hamburg, Germany
Synopsis
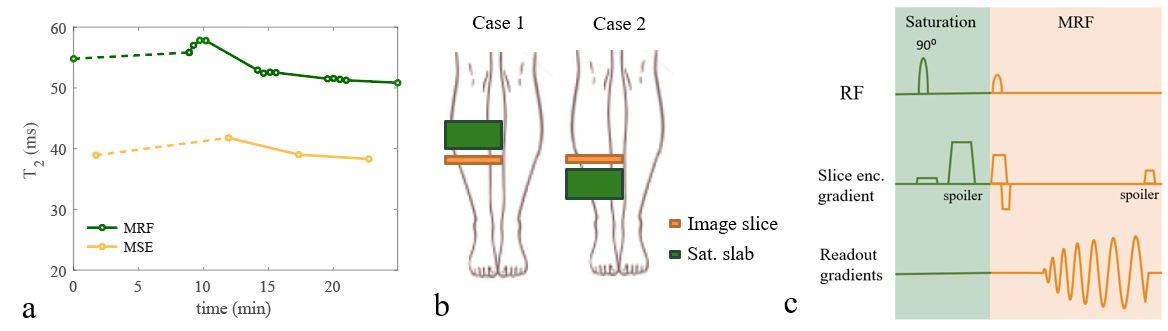
Fast relaxation time quantification is important in dynamic muscle studies and can be achieved using Magnetic Resonance Fingerprinting (MRF). The T2 values in muscle measured with MRF are consistently higher than those measured with the conventionally used multi-echo turbo-spin-echo (MSE) method, while T1 values are closer to reference measurements. We hypothesize that this increase can in part be attributed to an increased sensitivity of MRF to flow compared to MSE. In this work we test the sensitivity of MRF to flow in muscle by saturating a slab at different distances above the imaging slice for variable suppression of inflowing spins.
Introduction
Fast relaxation time quantification is important in dynamic muscle studies1. Recently it was shown that Magnetic Resonance Fingerprinting2 (MRF) can provide T1, T2, M0 and FF (fat fraction) maps simultaneously in approximately 15 seconds per slice3, supporting time-resolved exercise studies4. The water T2 values in muscle measured with MRF, however, were consistently higher (~31% difference) than those measured with the conventionally used multi-echo turbo-spin-echo (MSE) method5 (Figure 1a), even when high time-bandwidth RF pulses are used in MRF. MRF T1 values in muscle were much closer to those obtained with the reference inversion recovery (IR) method (~7% difference). Other studies have also found a mismatch between MRF and standard techniques6,7, but the source of these discrepancies is not yet understood. One clear difference between MRF and MSE is the much larger number of excitation pulses used for MRF compared to MSE. During such a long excitation/sampling period new spins that flow into the imaging slice will contribute to the final MRF signal. Therefore, our hypothesis is that the increased MRF water T2 in muscle can in part be attributed to an increased sensitivity to flow-related processes compared to MSE. In this work we perform initial in-vivo experiments to test the sensitivity of MRF to in-flow in muscle. We do this by applying a spatial saturation pulse at different distances above the imaging slice for variable suppression of inflowing spins. We investigate the difference in estimated T1/T2 values with respect to those obtained with a saturation pulse below the imaging slice, to eliminate magnetization transfer (MT) effects.Methods
Experiments were performed with informed consent obtained, using an Ingenia 3T MR system (Philips Healthcare) equipped with a quadrature transmit 16-channel receive knee coil. For one volunteer the sensitivity to flow was analyzed at rest by adding a spatial saturation pulse to each of the individual MRF pulses, suppressing a 60 mm thick region (saturation slab) above or below the imaging slice at five different distances (5,10,15,20,50 mm). The scan was repeated with a zero degree RF saturation tip angle for reference. The setup is schematically shown in Figure 1b-c. In another volunteer the MRF T1/T2 values were compared with the conventional MSE/IR method.MRF definition: A pattern of 1000 flip angles8, was used preceded by an inversion pulse. The TEs alternated between 3.45 ms and 2.30 ms, with constant flip angle for alternating TEs to enable chemical shift encoding3. The TR/RF-phase was fixed to 20 ms/0°.
Data acquisition: MRF data were acquired using a spoiled SSFP sequence with a spiral sampling scheme and the following scan parameters: FOV 230x230 mm2, resolution 1.31x1.31x10 mm3, 8 ms spiral read-out, undersampling factor 20, scan time 20s. MSE data were acquired using a CPMG readout with 17 echoes: TR/TE/ΔTE 3000/8/8 ms, and analyzed using a tri-exponential fit9. IR data were acquired with spectral pre-saturation fat suppression and TR/TSE factor = 5s/16.
Dictionary and Matching: The dictionary was calculated using the extended phase graph formalism10. 123,645 signal evolutions were simulated with T1/T2/B1+ factors ranging from 20-2000ms/10-500ms/0.5-1.2, respectively. Before calculating T1, T2 and M0 maps in the matching process, the fat signal was removed from the water signal following the procedure described in ref. 3.
Results
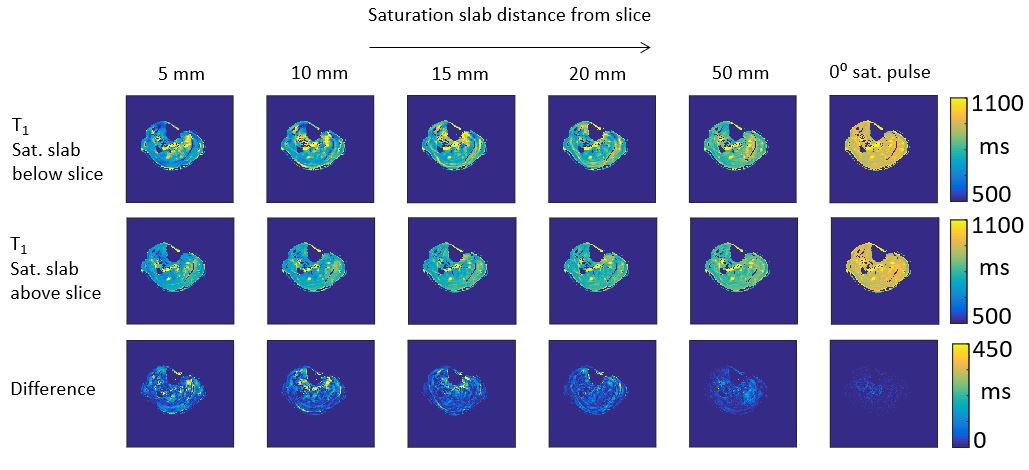
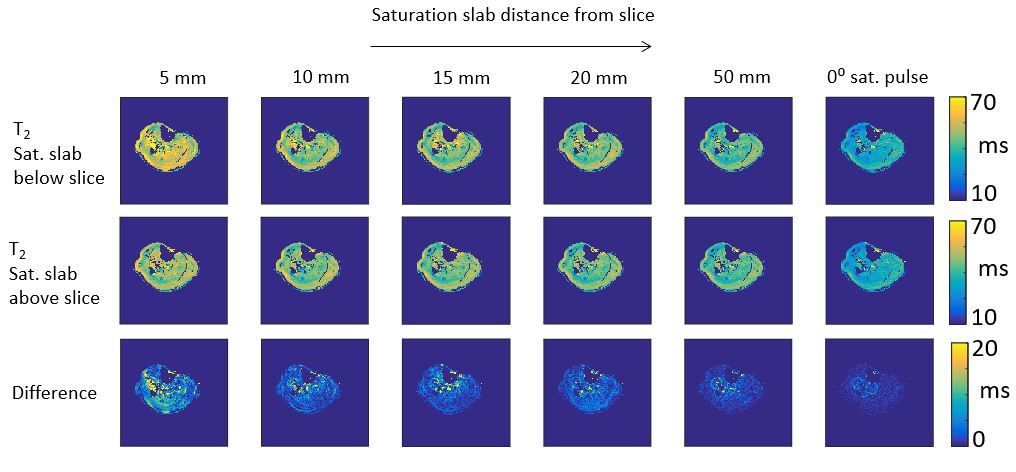
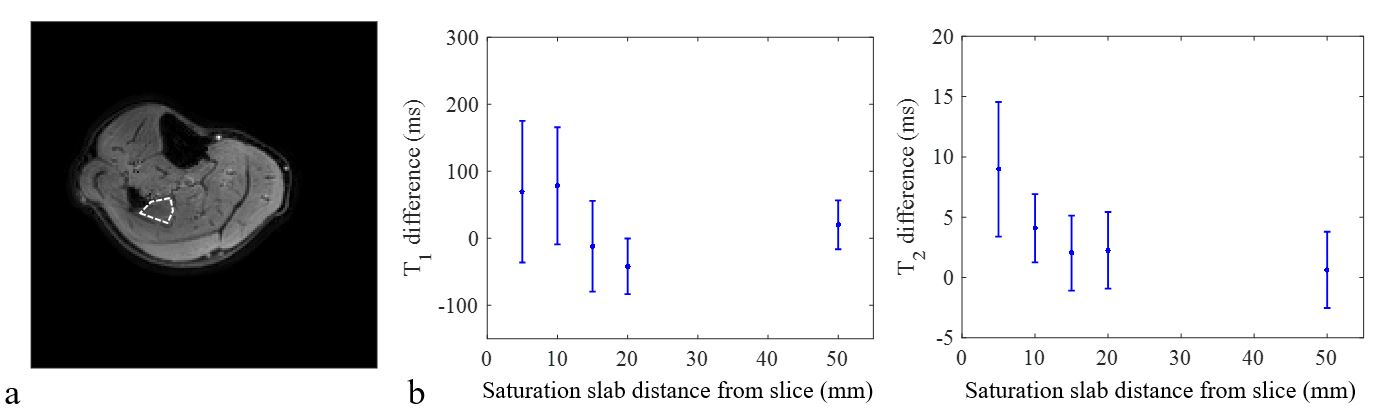
Figure 2 shows the T1 maps for the saturation slab below or above the imaging slice at different distances. The values in the T1 map increase when the saturation pulse is switched off (0⁰ RF saturation angle) due to MT effects. As the saturation slab is moved closer to the imaging slice, the T1 values decrease further, both due to increased MT and suppressed flow effects. Assuming a symmetric MT spectrum, the difference T1 maps (suppression below-suppression above slice), show larger differences when the saturated slab is closer to the imaging slice. Figure 3 shows similar results for the T2 maps. Figure 4 summarizes the difference T1 and T2 values averaged over an ROI (Figure 4a) in the soleus muscle, also showing larger differences and standard deviations for smaller distances of the saturation slab to the imaging slice: up to ~75/9 ms for mean T1/T2, respectively.Discussion
The comparison between saturating a region below and above the imaging slice during the MRF scan allows us to eliminate symmetric MT effects and other confounding symmetric effects that might be present in this set up. The remaining difference in T1 and T2 indicates that there is a measurable effect of flow of spins into the imaging slice. This difference is associated with an increase in both the estimated T1 and T2 values in the analyzed ROI in the soleus muscle. The numbers confirm that percentually muscle T2 (~28%) is much more affected by flow than muscle T1 (~8%). Future work should examine any non-symmetric effects as confounding factors.Conclusion
We have shown a strong indication for a non-negligible effect of flow-related processes on the matched parameter maps in muscle MRF. Such flow effects can lead to a small increase in the estimated water T1, but a much larger increase in estimated water T2 in muscle, and can therefore be an explanation for the overestimation of T2 values measured with MRF compared to those measured with MSE.Acknowledgements
This project was funded by the European Research Council Advanced Grant 670629 NOMA MRI.References
1. Varghese, J et al. Rapid assessment of quantitative T1, T2 and T2* in lower extremity muscles in response to maximal treadmill exercise. NMR in Biomedicine. 2015;28(8):998–1008.
2. Ma, D et al. Magnetic Resonance Fingerprinting. Nature. 2013;495(7440):187–192.
3. Koolstra, K et al. Water-Fat Separation in Spiral Magnetic Resonance Fingerprinting using Conjugate Phase Reconstruction. 27th ISMRM in Paris. 2018; 0681.
4. Marty, B et al. Physiological and Pathological Skeletal Muscle T1 changes quantified using a fast inversion-recovery radial NMR imaging sequence. Scientific reports. 2019;9(1):6852.
5. Forbes, S et al. Magnetic Resonance Imaging and Spectroscopy Assessment of Lower Extremity Skeletal Muscles in Boys with Duchenne Muscular Dystrophy: A Multicenter Cross Sectional Study. PLOS ONE. 2014;9(9):1–8.
6. Marty, B et al. MR fingerprinting for water T1 and fat fraction quantification in fat infiltrated skeletal muscles. Magnetic Resonance in Medicine. 2019; 10.1002/mrm.27960.
7. Ma, D et al. Slice Profile and B1 Corrections in 2D Magnetic Resonance Fingerprinting (MRF). Magnetic Resonance in Medicine. 2017;78(5):1781–1789.
8. Sommer, K et al. Towards predicting the encoding capability of MR fingerprinting sequences. Magnetic Resonance Imaging. 2017; 41:7–14.
9. Azzabou, N et al. Validation of a Generic Approach to Muscle Water T2 Determination at 3T in Fat-Infiltrated Skeletal Muscle. Journal of Magnetic Resonance Imaging. 2015;41:645–653.
10. Scheffler, K. A pictorial Description of Steady-States in Rapid Magnetic Resonance Imaging. Concepts in Magnetic Resonance. 1999;11(5):291–304.
Figures