0865
Exploring multi-functions of MRI in PDT: imaging-guided tumor therapy, follow-up monitoring and early evaluation of therapeutic efficacy1Shanghai public health clinical center, Fudan University, Shanghai, China, 2The Institute for Biomedical Engineering & Nano Science, Tongji University, Shanghai, China
Synopsis
Estimating the gross tumor volume by measuring the physical diameters of the tumor with calipers is a common method for evaluating the efficacy of photodynamic therapy (PDT). In this study, the optimal time for determining the efficacy of PDT treatment based on morphological and functional magnetic resonance (MR) imaging techniques is determined.
Objective
To explore and determine the role of morphological and functional MR imaging techniques in evaluating the efficacy of Photodynamic therapy (PDT) treatment.Methods
PDT is a therapeutic method in which a photosensitizer reacts with a light of a corresponding wavelength to produce a photodynamic reaction to produce singlet oxygen, thereby killing tumor cells. In this study, the protein-mediated biomimetic synthesis was used to incubate Gd nanoparticles and load Ce6 photosensitizer, allowing such obtained Gd@HbCe6 nanoparticles to simultaneously deliver Gd and photodynamic agent to the tumor tissues.1. In vivo MR imaging: In this study, paramagnetic Gd element was selectively incorporated into the nanoparticles to provide MR imaging-guided PDT. The SE T1-weighted MR imaging of 4T1 tumor-bearing mice were conducted on the 3.0 T MRI scanner with a receiver coil for mouse. The background MR images of blank mice were obtained first. Then, the mice were intravenously administrated with Gd@HbCe6 suspended in normal saline. Subsequently, the T1-weighted images of tumor were acquired at six time points, namely 0.5 h, 1 h, 2 h, 4 h, 6 h, and 24 h after the injection of Gd@HbCe6.
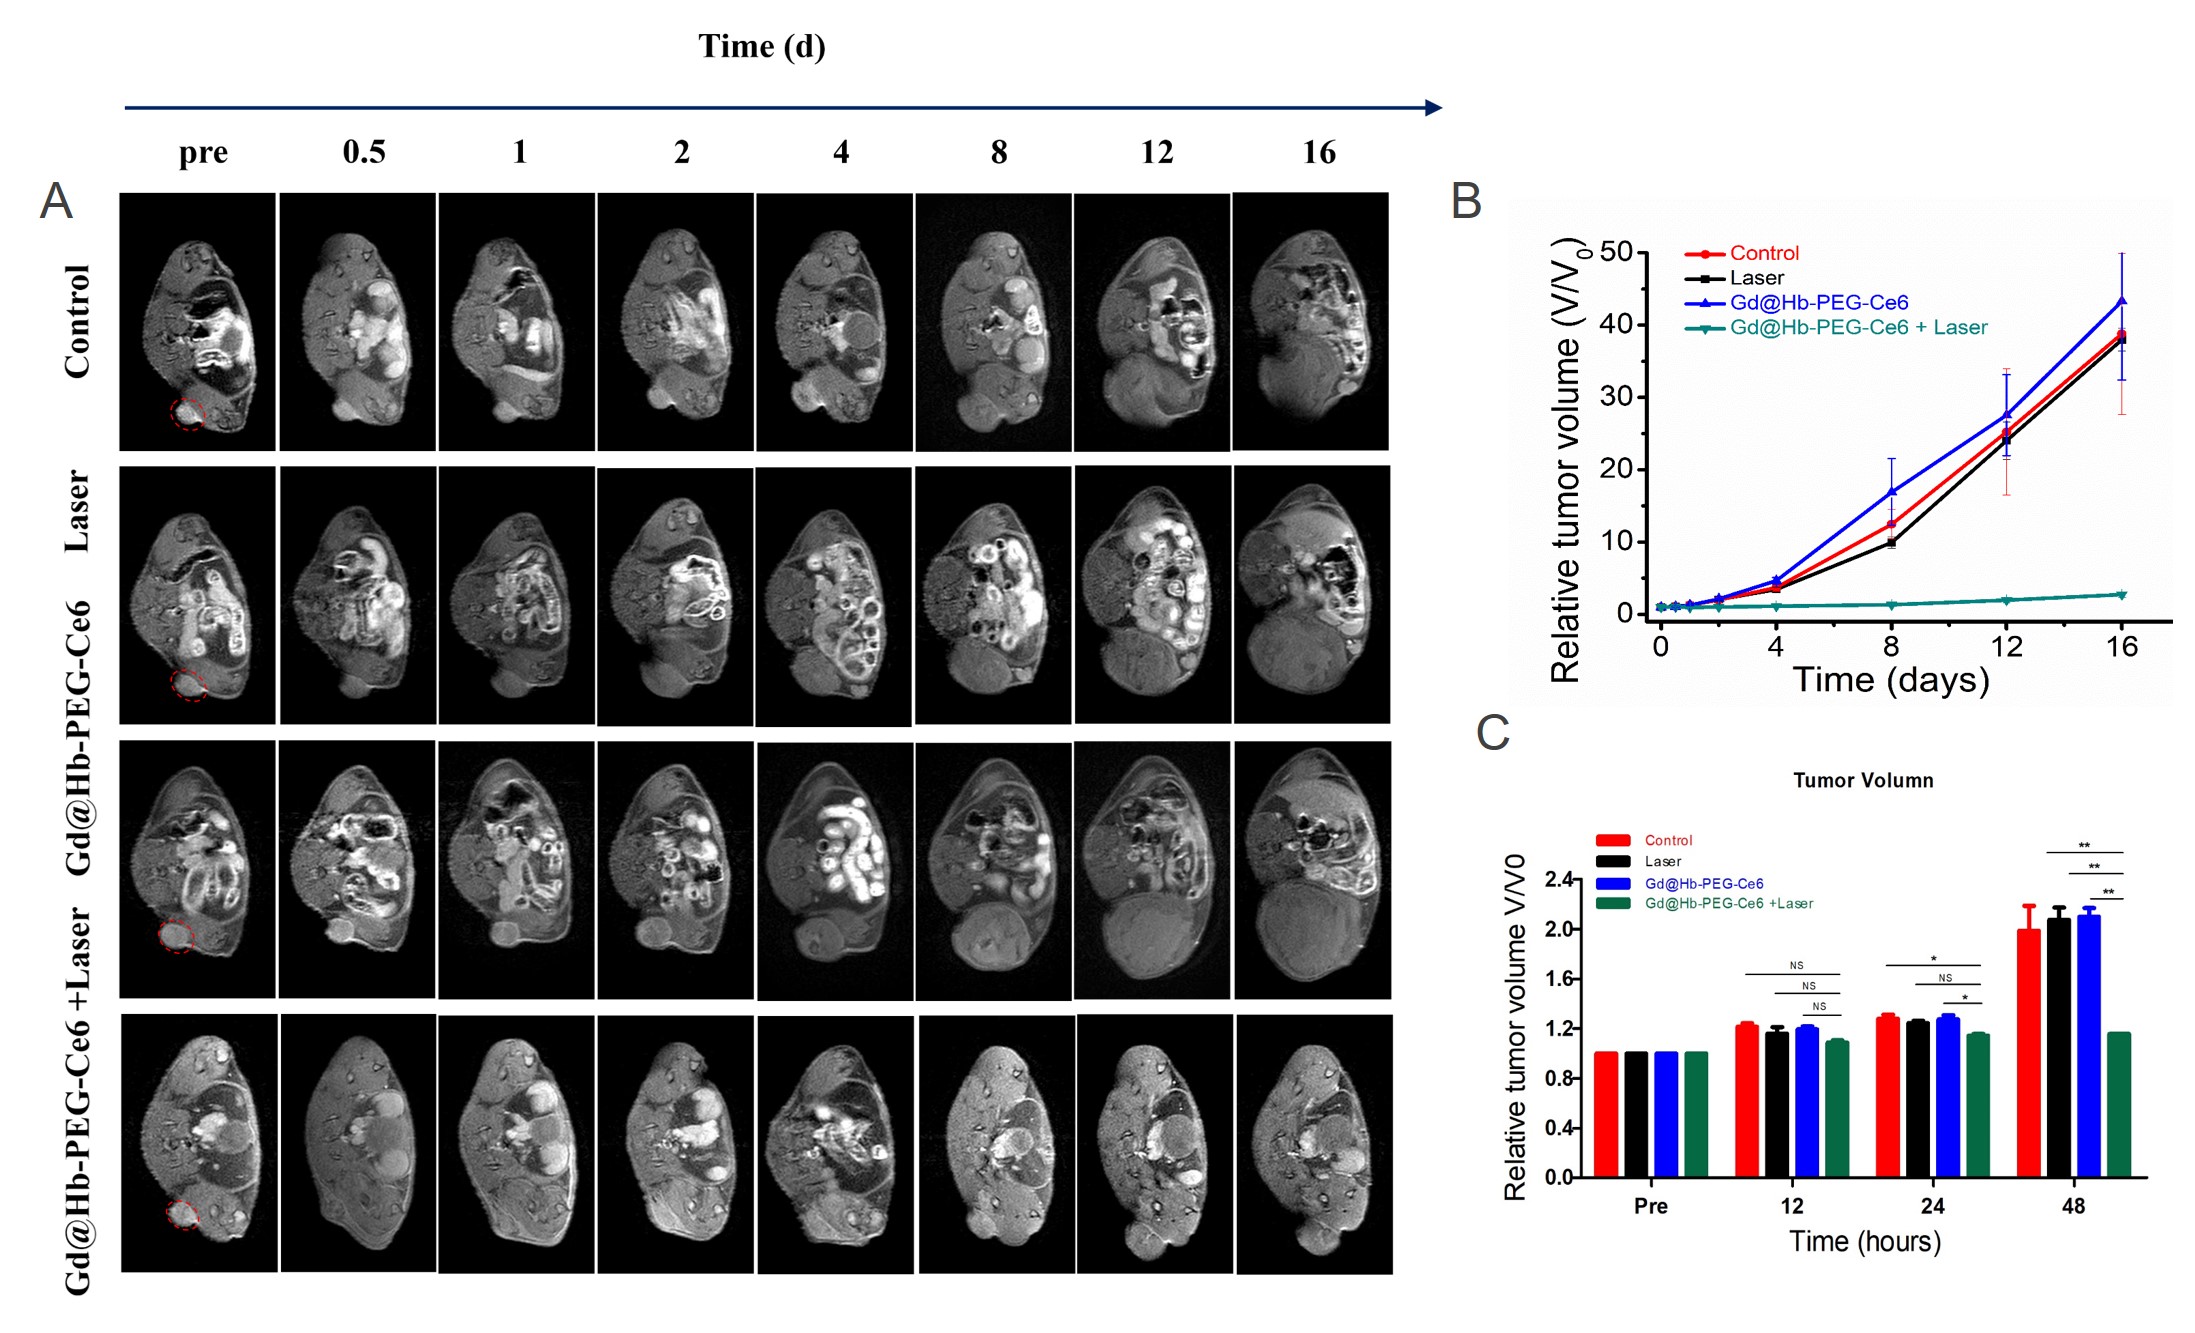
2. In vivo PDT: The tumor-bearing mice were divided into 4 groups randomly (n = 4). Each group received different treatments as follows: (1) Saline injection; (2) Laser irradiation; (3) Gd@HbCe6 nanoparticles injection; (4) Gd@HbCe6 nanoparticles injection with laser irradiation. Then, the SE T1-weighted MR images of tumor were recorded for observing the size of tumors before treatment and at seven time points; 0.5 d, 1 d, 2 d, 4 d, 8 d, 12 d, and 16 d after the treatment. The maximum height (a), maximum width (b), and maximum anteroposterior diameter (c) of the tumor were measured at the maximum transverse position of the MR and at the sagittal position. The volume of the tumor was measured according to the designed formula: volume=a*b*c. The one-way analysis of variance (ANOVA) was used to compare the differences of mean relative tumor volume among groups. At the end of the experiment, the mice were sacrificed and the tumors were removed for further study.
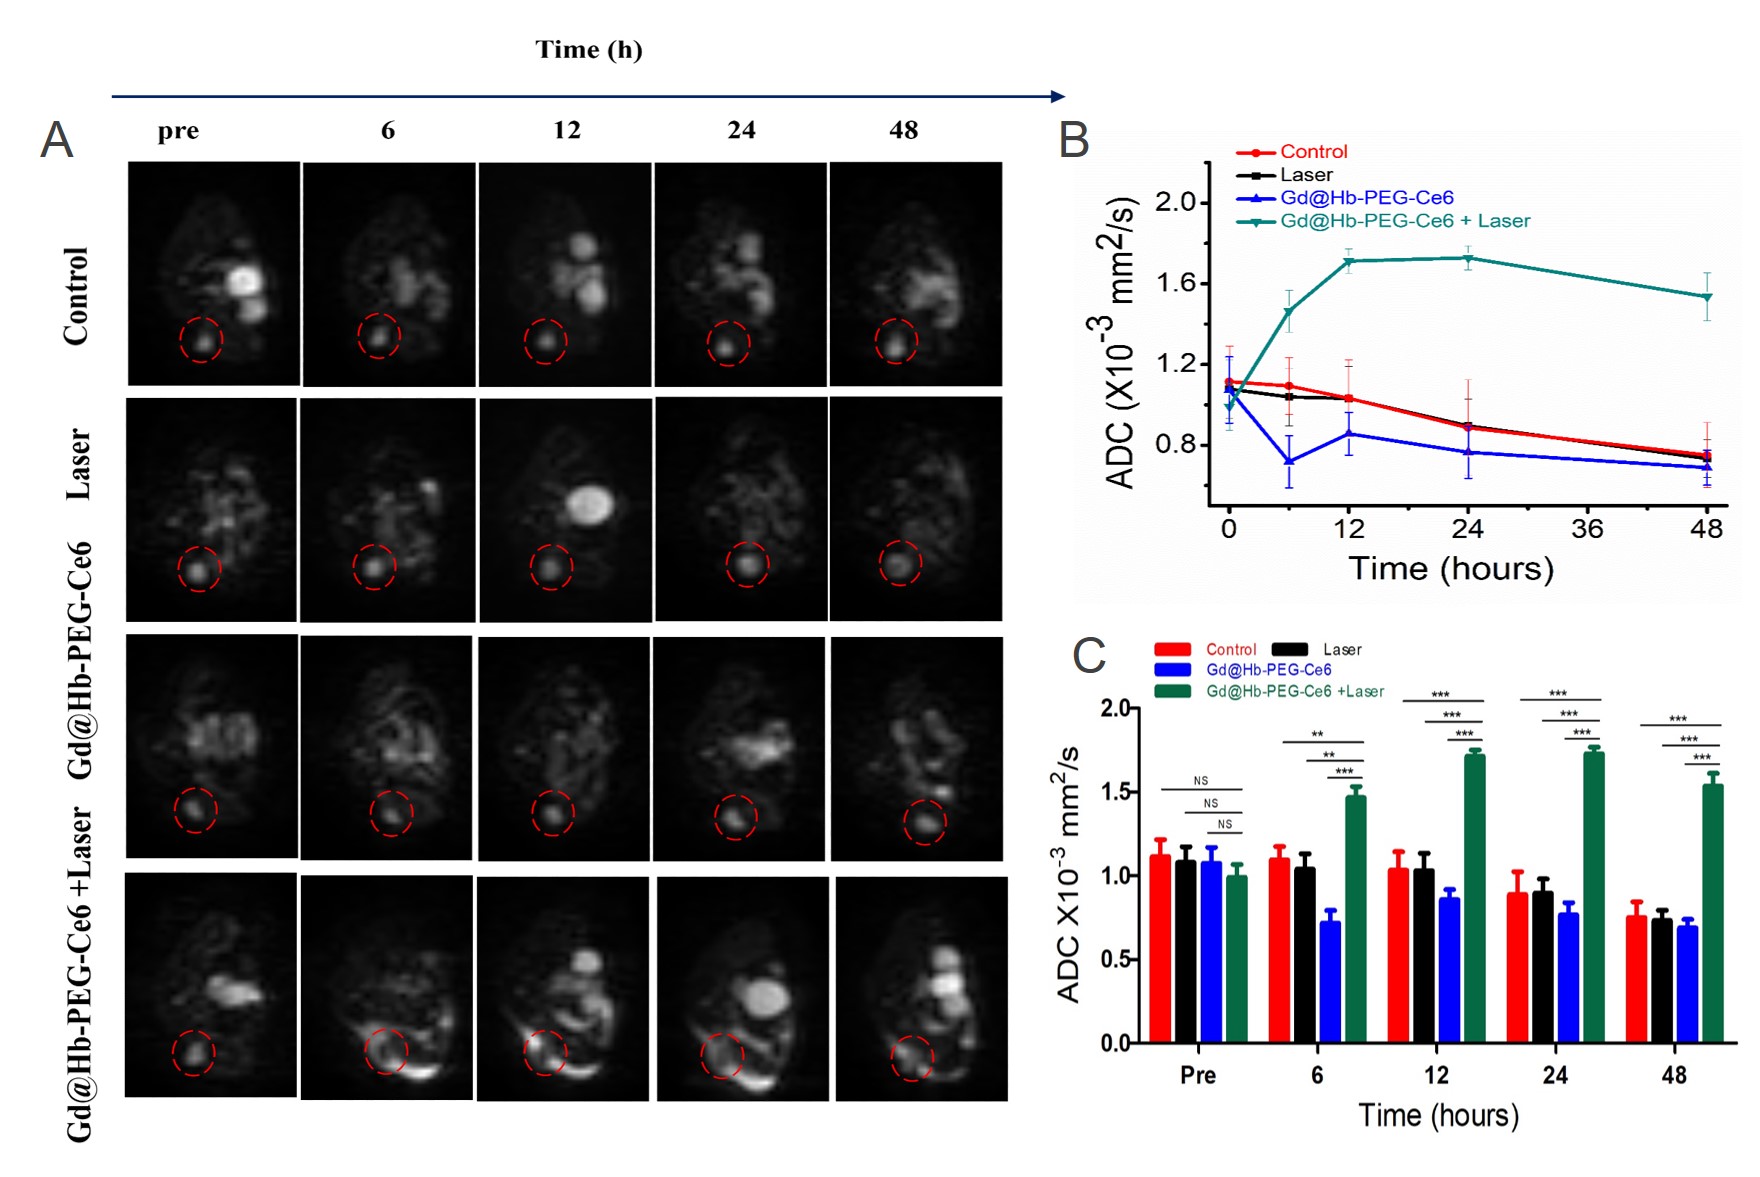
3. Diffusion-weighted imaging (DWI) for the early evaluation of tumor therapeutic efficacy: The multi-shot echo-planar imaging technique was conducted on the 3.0 T MRI scanner with a receiver coil for mouse to acquire DW images. Apparent diffusion coefficient (ADC) maps were then constructed automatically and used for the measurement of ADC values.
4. ADC measurement and data analysis: The ADC value in the tumor was calculated by drawing a ROI that cover the whole tumor. The one-way ANOVA was applied to compare the differences of the mean ADC values among groups.
Results and Discussion
1. Figure 1 clearly shows a gradual increase in tumor signal intensity after intravenous injection and a decrease beginning at 2 h post-injection. The maximal tumor uptake happens at 1 h post-injection.2. After confirming of MRI-guided tumor addressing by Gd@HbCe6 nanoparticles, PDT was performed. At 2h after intravenous administration of Gd@HbCe6 nanoparticles, the mice bearing 4T1 tumor were exposed to PDT. The volumes of tumors during treatment were accurately measured by MR imaging to assess therapeutic efficacy. As shown in the Figure 2A, 2B and 2C, the tumor volumes of the mice from the control group show significant increases during the observation time of treatment, while the growth of tumors in the PDT group are obviously inhibited. It should be noted that after statistic analysis of the tumor volumes, the therapeutic efficacy can be reflected at day 2 after treatment by MR imaging of tumor morphology.
3. In order to earlier evaluate the efficacy of PDT, functional MRI was carried out. As shown in the Figure 3A, the lesion areas of four groups present high signal intensity on DWI map before treatment. During the observation time of treatment, the lesion areas of mice from the groups show high signal intensity on DWI map with a gradual decrease of ADC values (Figure 3A and 3B). While in the PDT group, the lesion areas consistently show low intensity on DWI map after treatment and the ADC values are higher than that of pretreatment. The statistics results further show that compared with the control groups, the ADC values of the PDT group at different time points are statistically significant higher after treatment (Figure 3C). With the results of ADC values, the early therapeutic efficacy of Gd@HbCe6 nanoparticles-based PDT is quantitatively confirmed at 6 h post PDT, which is much earlier than that (day 2 post PDT) evaluated by structural MR imaging.
Conclusion
With MRI, the PDT treatment efficacy of Gd@HbCe6 were evaluated by functional MR imaging besides the morphologic MR imaging technique,and the optimal time for determining the efficacy of PDT treatment based on morphological and functional MR imaging techniques was determined.Acknowledgements
This research was supported by the National Natural Science Foundation of China (81922035, 81871399, 81801823, 81571742).References
1. Zheng, X.-Y.; Zhao, K.; Tang, J.; Wang, X.-Y.; Li, L.-D.; Chen, N.-X.; Wang, Y.-J.; Shi, S.; Zhang, X.; Malaisamy, S., Gd-Dots with Strong Ligand–Water Interaction for Ultrasensitive Magnetic Resonance Renography. ACS nano 2017, 11 (4), 3642-3650.
2. Bonekamp, S.; Corona‐Villalobos, C. P.; Kamel, I. R., Oncologic applications of diffusion‐weighted MRI in the body. Journal of Magnetic Resonance Imaging 2012, 35 (2), 257-279.
3. Yoshikawa, M. I.; Ohsumi, S.; Sugata, S.; Kataoka, M.; Takashima, S.; Mochizuki, T.; Ikura, H.; Imai, Y., Relation between cancer cellularity and apparent diffusion coefficient values using diffusion-weighted magnetic resonance imaging in breast cancer. Radiation medicine 2008, 26 (4), 222-226.
Figures