0863
Altered Brain and Gut in Alzheimer’s Disease Model Using Diffusion MRI and Intestinal Bacteria Gene Analysis1National Yang-Ming University, Taipei, Taiwan, 2Taipei Medical Unversity, Taipei, Taiwan
Synopsis
Microbiota-gut-brain axis, a bidirectional communication, was proposed as an important role in Alzheimer’s disease (AD). However, the correlation between gut microbiota and brain microstructure in AD remained unclear. Triple-transgenic mouse models of AD were used to investigate brain-behavior-gut-microbiome interaction. Diffusion MRI, behavior tasks, and intestinal bacteria gene analysis were applied in this study. The findings implied that the altered brain microstructure and atypical distribution of gut microbiota were associated with the cognitive dysfunction in AD.
Introduction
Alzheimer’s disease (AD) is the most common type of dementia with main characteristics including beta amyloid (Aβ) plaques and neurofibrillary tau tangles in the brain1. Brain circuits have been shown to be greatly involved in AD2, including the Papez circuit3 and the limbic circuit4. Previous studies reported that treating the gastrointestinal symptoms may reduce the behavioral or emotional deficits in AD, which implied that brain-behavior-gut-microbiome interaction played an important role in AD5. The interaction between brain and gut has been elaborated in bidirectional ways: (a) Neural signals were transmitted via the autonomic nervous system to the gut, subsequently causing the change of microbiota distribution and activity6, 7. (b) Metabolic production of microbiota was carried and absorbed by the blood system, contributing to the effect of brain regulation afterwards8. However, the correlation among gut microbiota, behavioral performance, and brain microstructure in AD is still unclear9. In this study, we applied diffusion MRI, behavioral task and intestinal bacteria gene analysis to the triple-transgenic mouse models of AD (3×Tg-AD), which, too, demonstrated Aβ, tau and tangle pathologies, just as AD patients exhibited the behavioral phenotypic aspects10. We hypothesized that the altered brain microstructure and atypical distribution of gut microbiota were associated with the cognitive performance in AD animal model.Methods
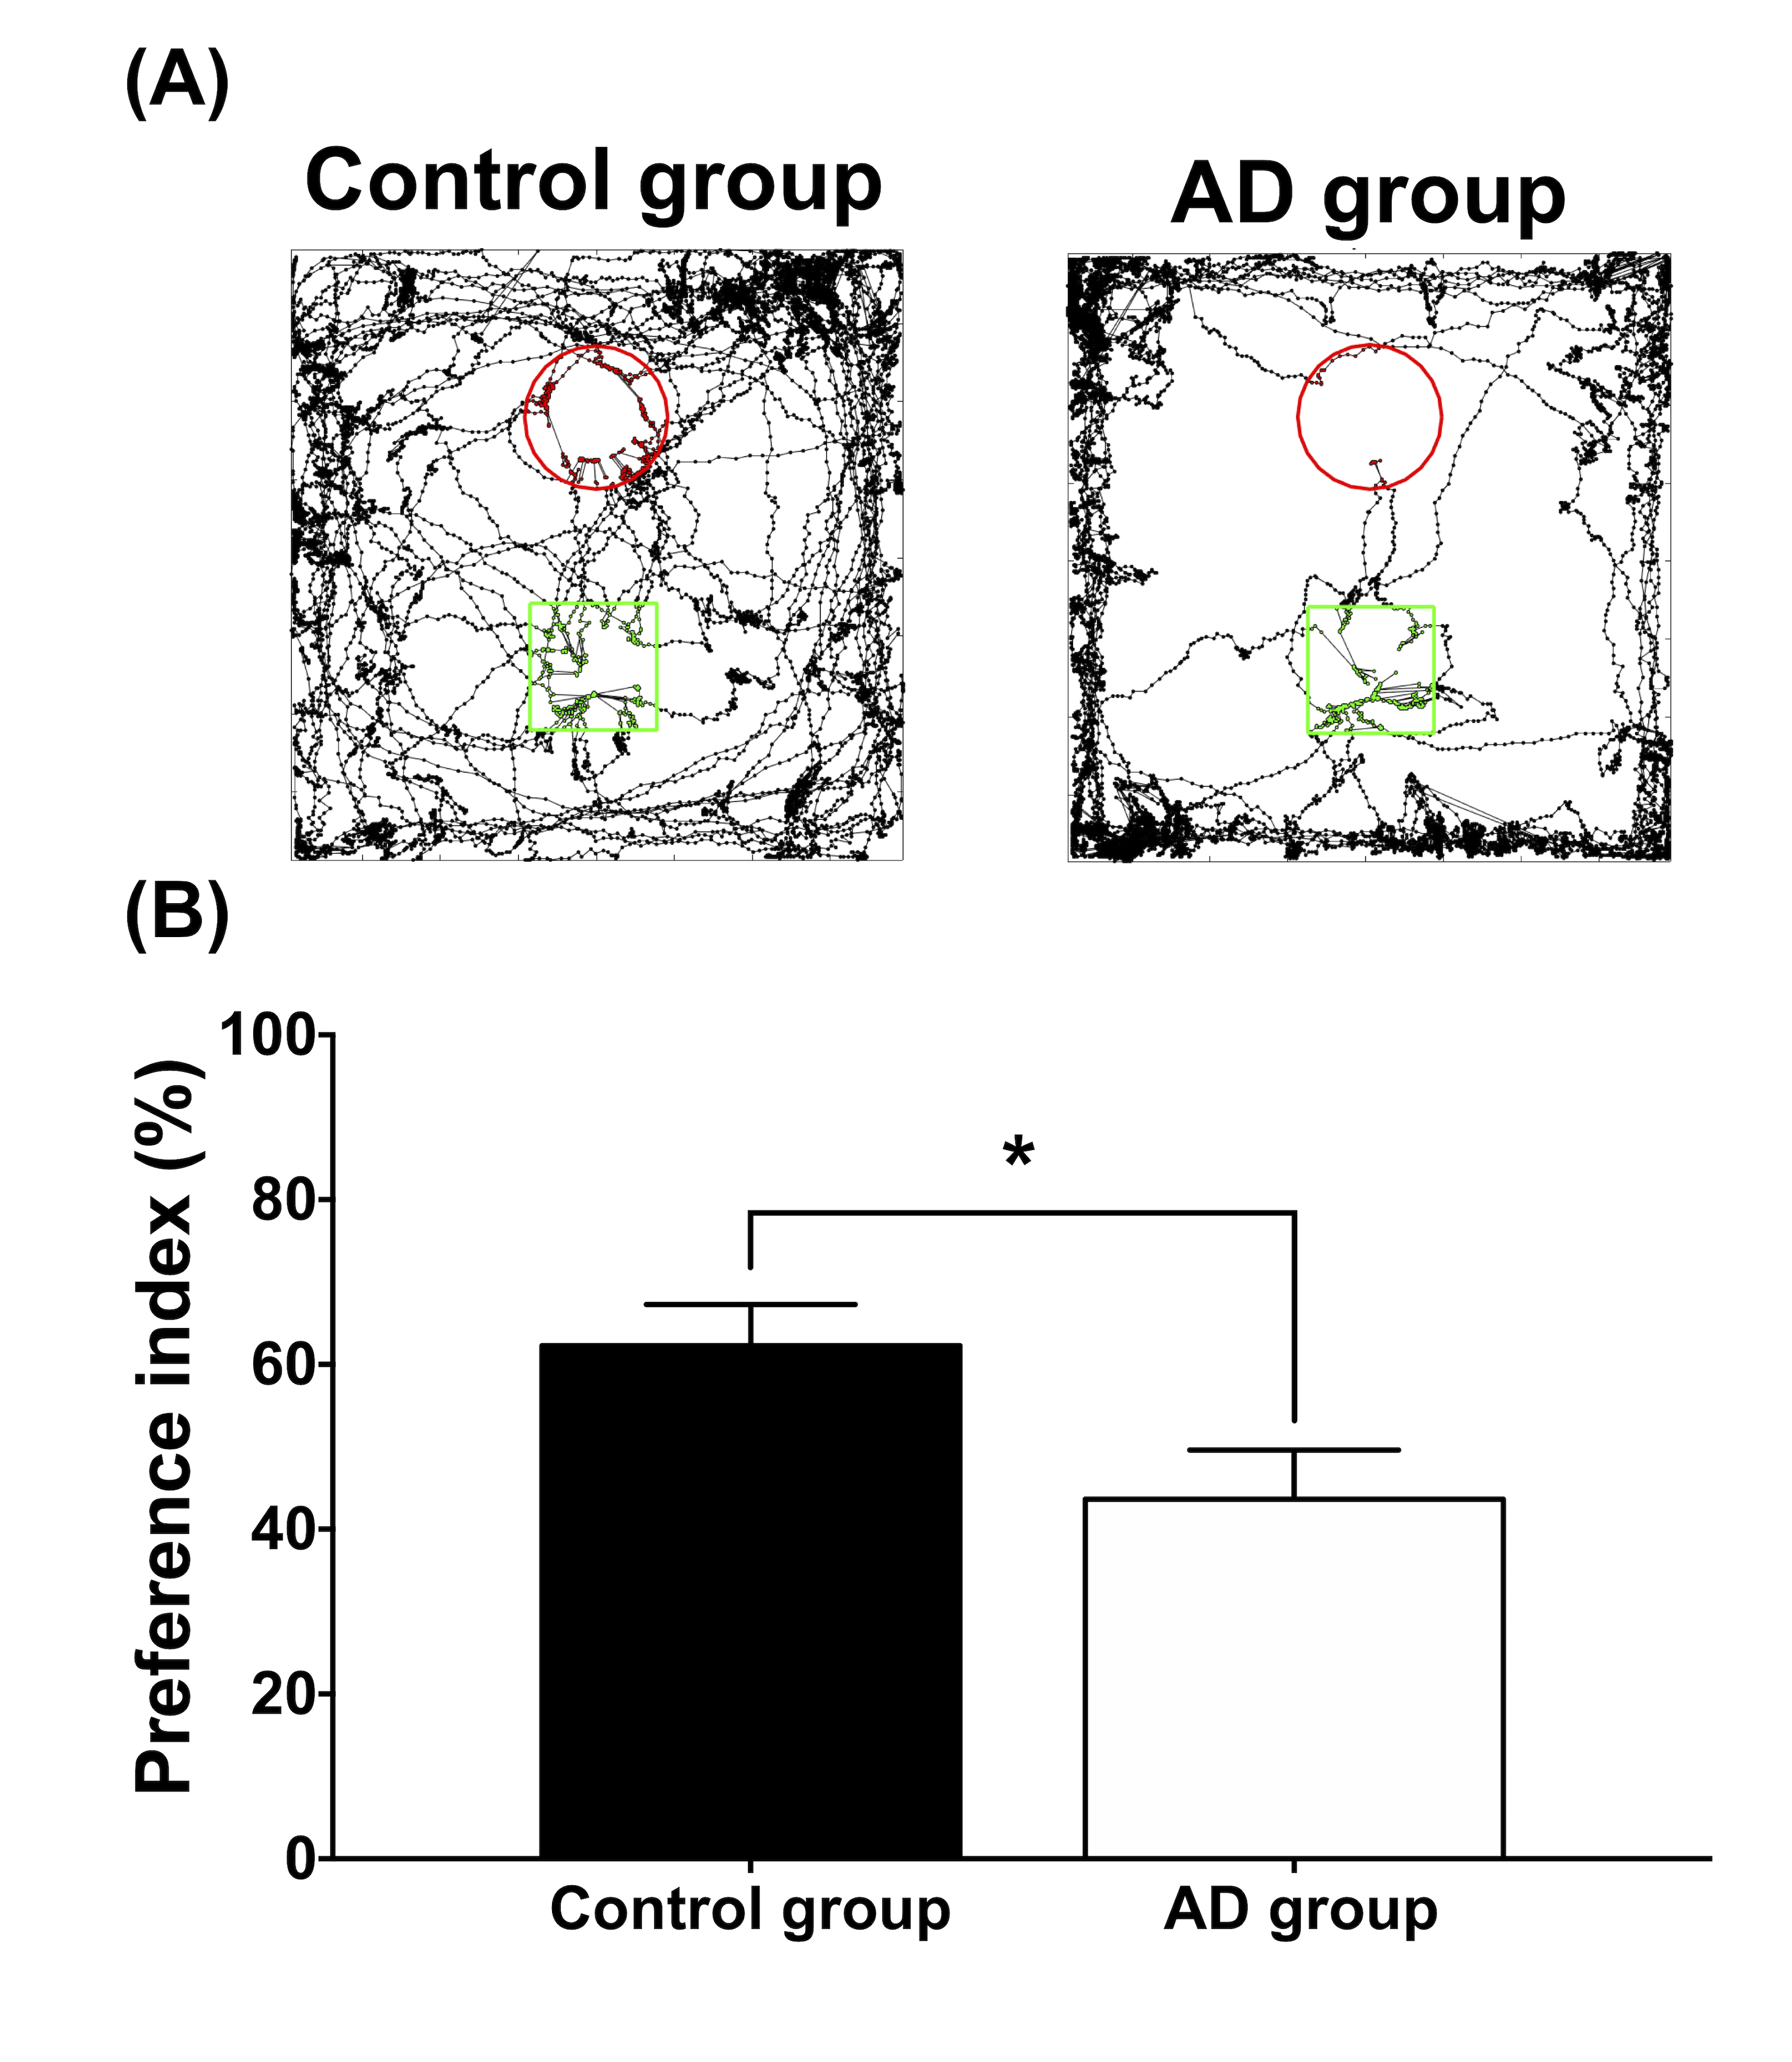
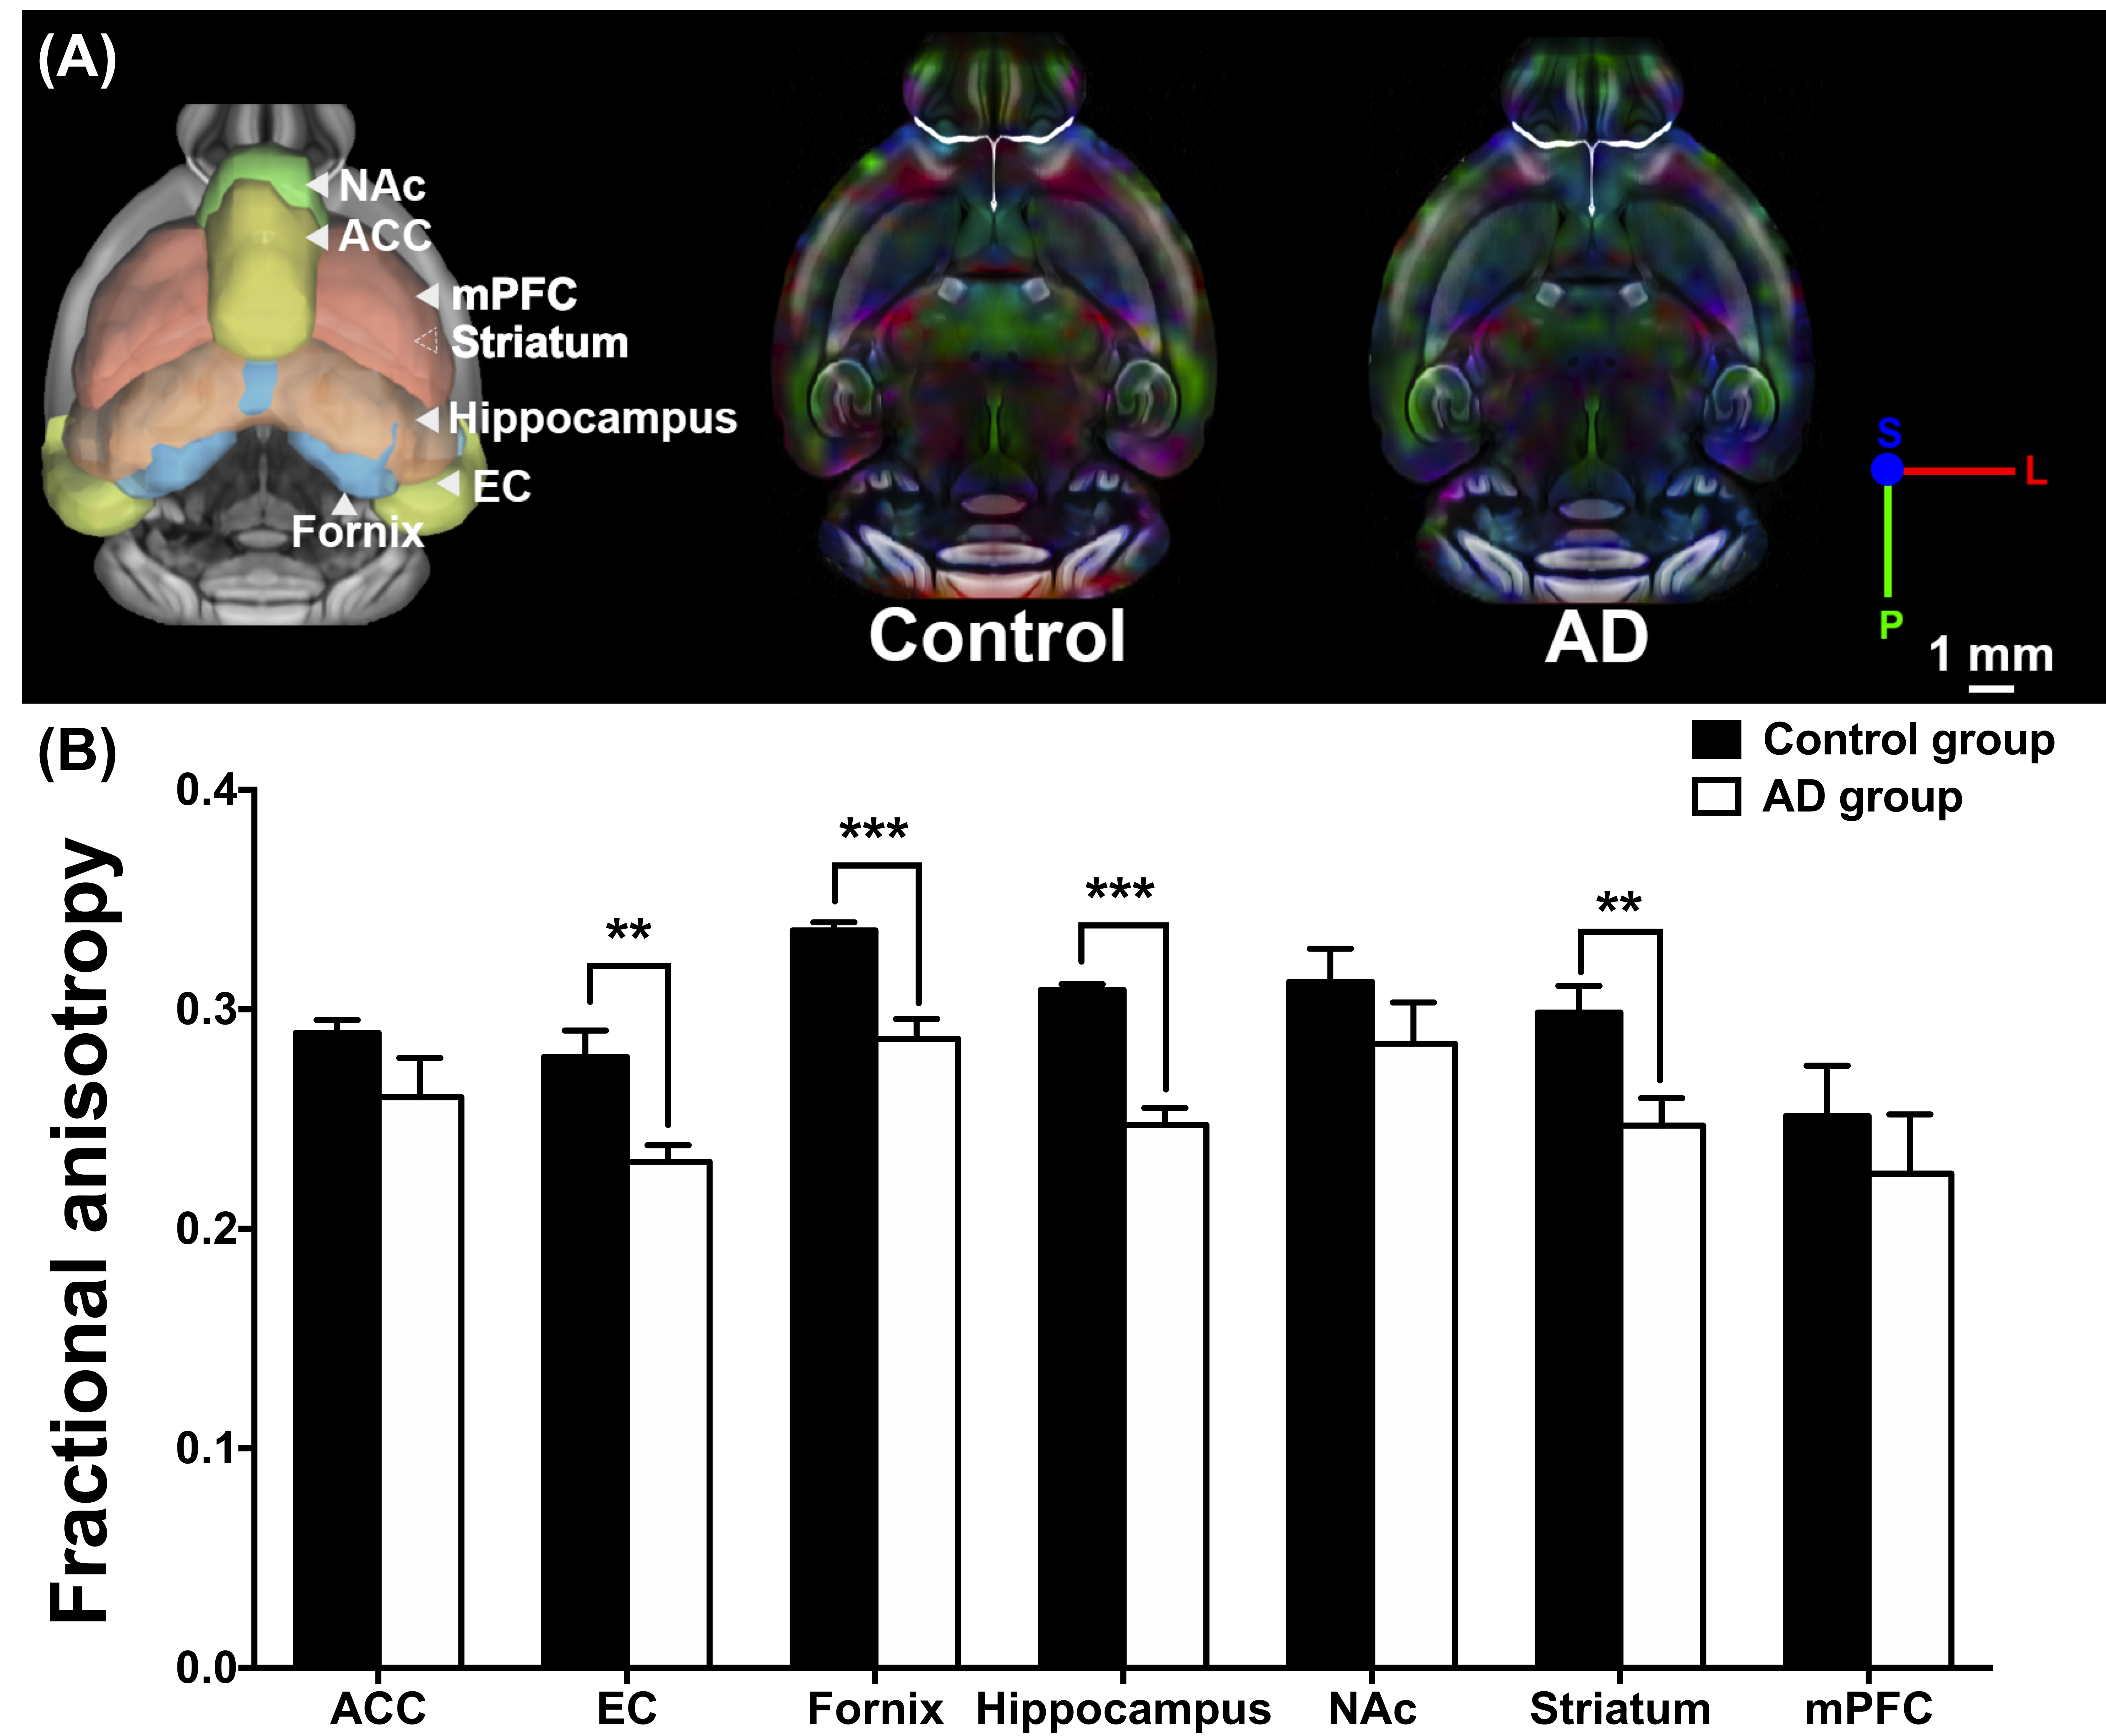
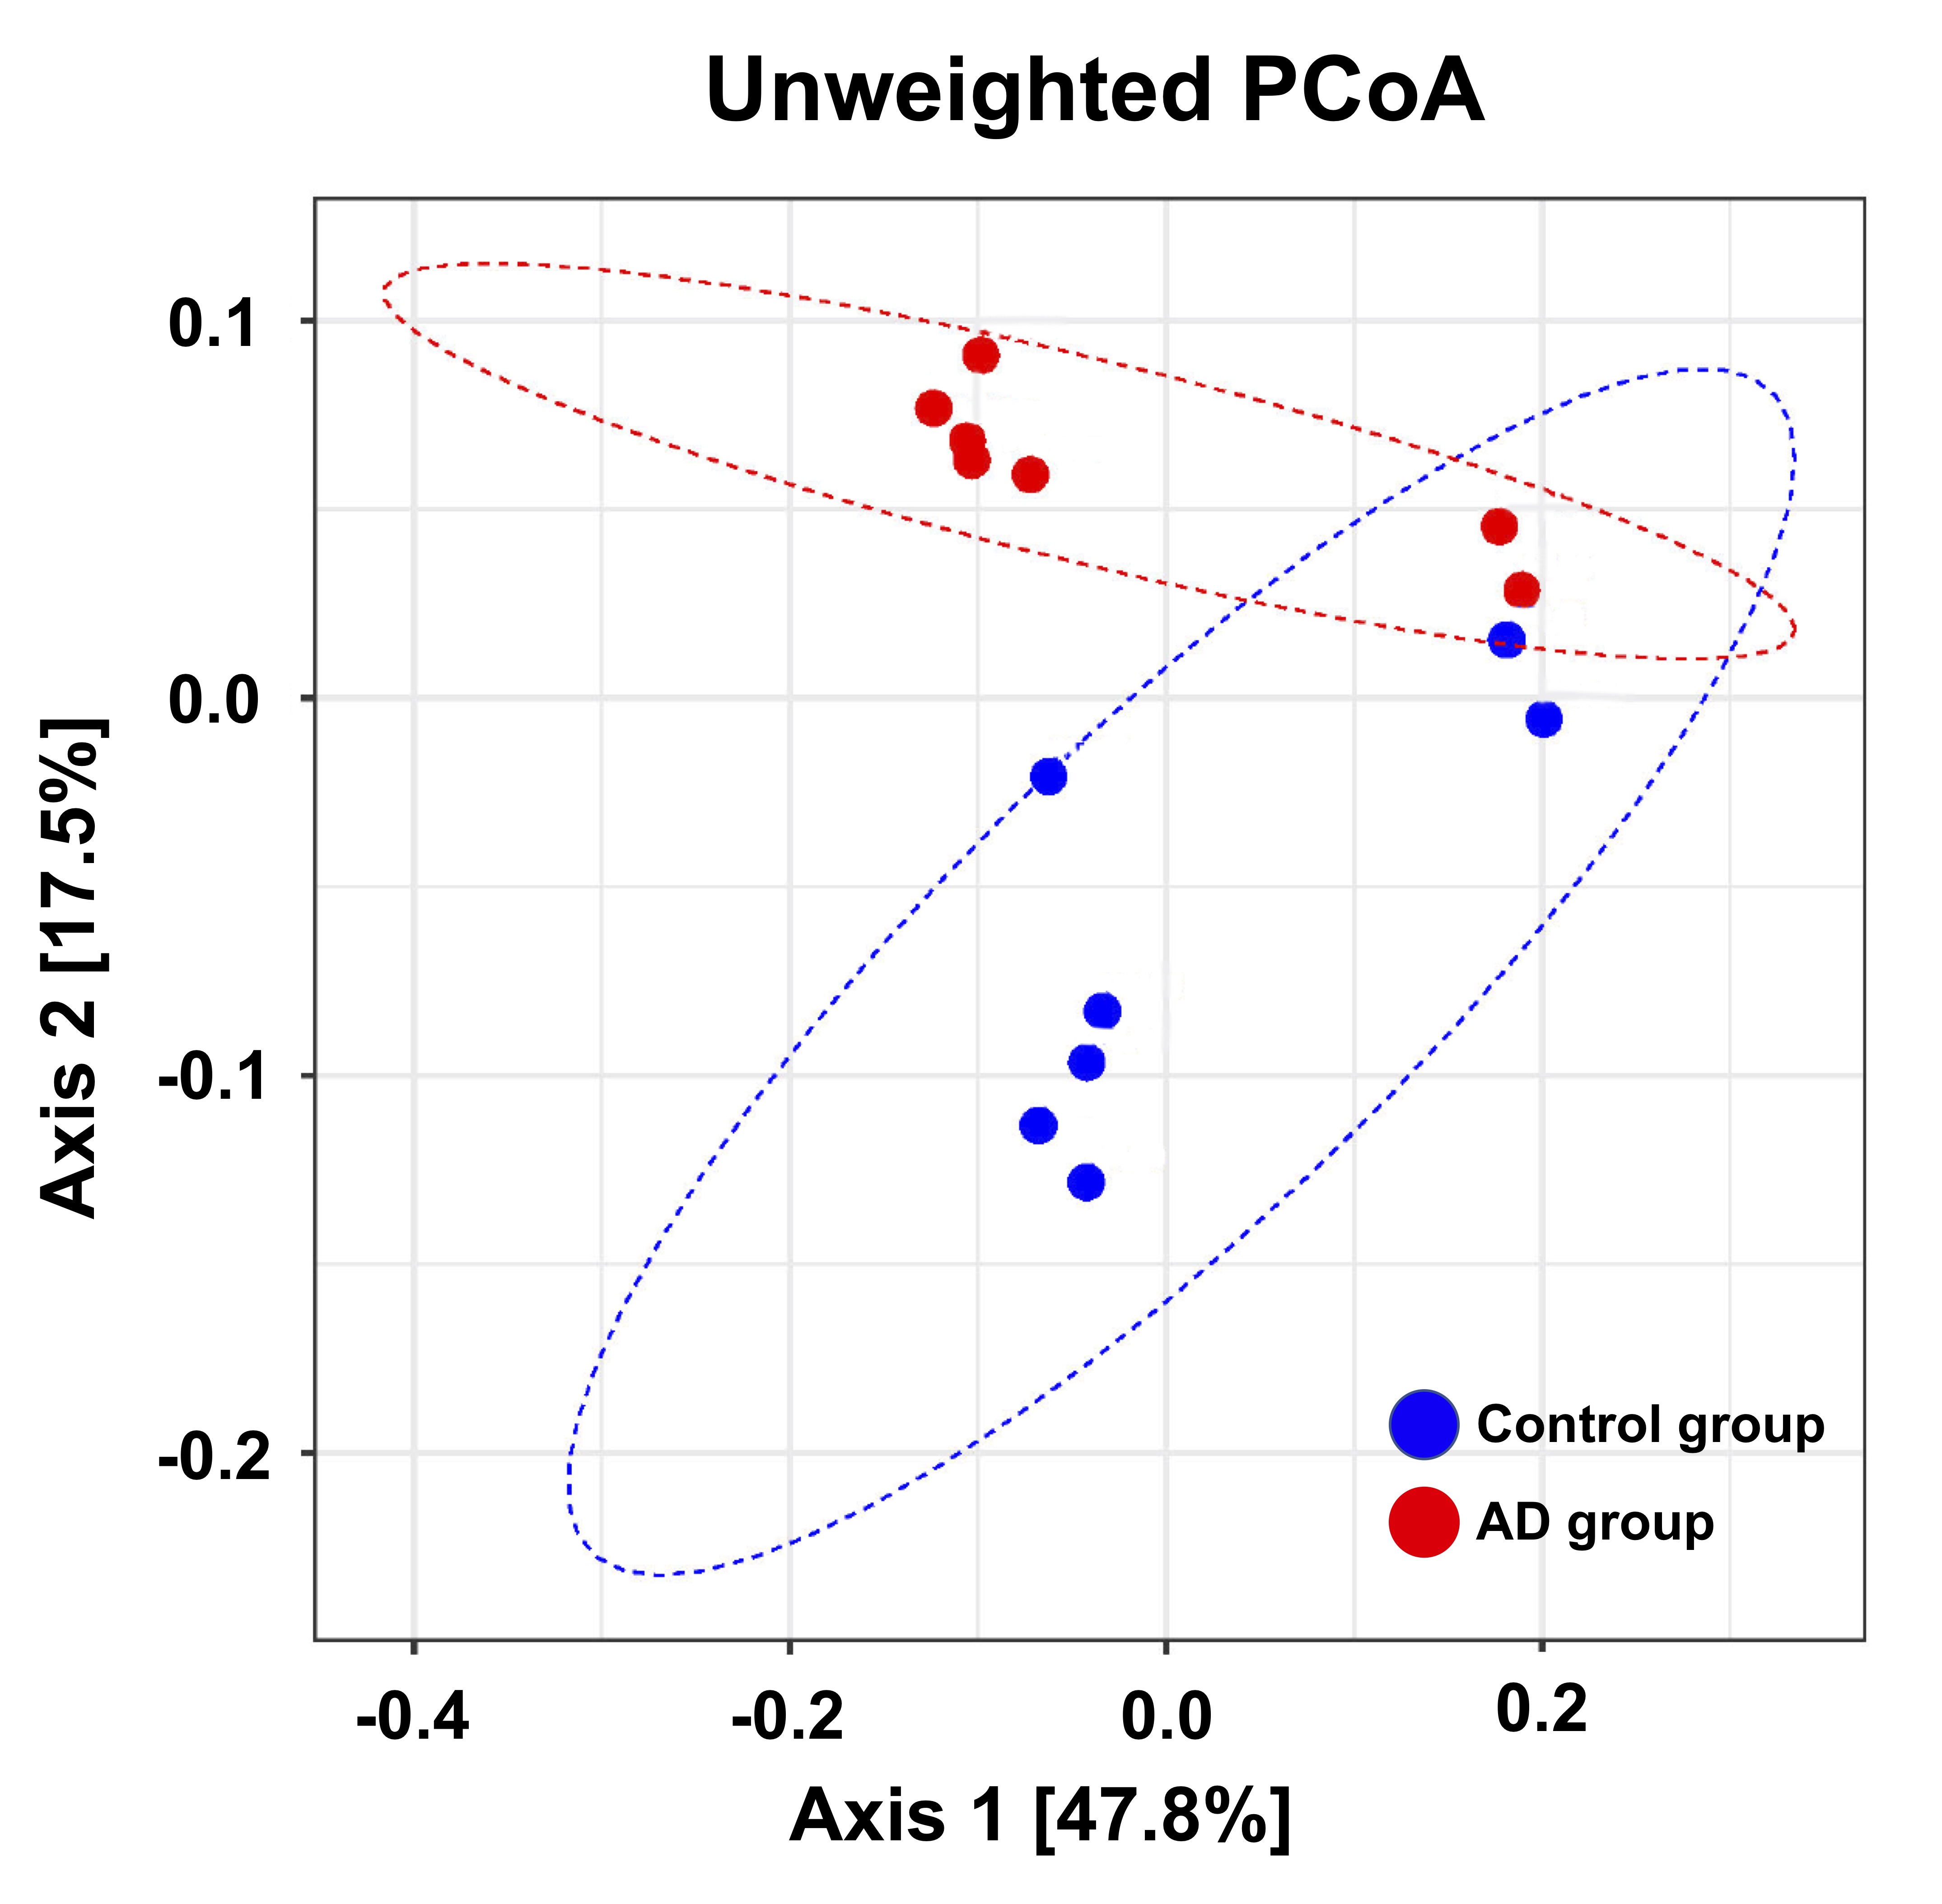
Adult male B6129SF1/J mice (weight 20 ± 5 g, N = 7) were used as the control group, and adult male 3×Tg-AD mice (weight 20 ± 5 g, N = 7) were used as AD animal models. Both groups were housed in the animal facility under 12:12-h light/dark cycle with controlled temperature at 22 ± 2°C. Novel object recognition (NOR) task, in which the rodents’ ability to recognize a novel object in the environment was evaluated11, was performed over the course of habituation day, training day, and testing day. On the habituation day, the mice were placed into a test field without any objects. Subsequently, sample objects were presented during the training day for the mice’s memory retention before the testing day, on which one of the familiar objects was replaced by a novel one. A preference index (PI) was calculated using the formula: PI = (n) / (n+f), where n = time with novel objects and f = time with familiar objects12. Whole brain images were acquired from a 7 Tesla Bruker MRI (Bruker Biospec 70/30 USR, Ettlingen, Germany). Diffusion tensor images (DTI) were acquired through the DTI EPI Spin-Echo sequence (TR / TE=3750 / 40.28 ms, FOV = 20 × 20 mm2, Matrix: 50 × 50). Regions of interest (ROIs) were identified in reference to the C57BI/6j mouse atlas13 and Allen mouse atlas14, including anterior cingulate cortex (ACC), entorhinal cortex (EC), fornix, hippocampus, nucleus accumbens (NAc), striatum and medial prefrontal cortex (mPFC). DTI analysis was conducted via DSI Studio (http://dsi-studio.labsolver.org), and the white matter integrity in each targeted ROI was determined by averaging the fractional anisotropy (FA) values within the contour of each ROI. The fecal samples were collected for microbiome analysis. After DNA extraction, the sample was applied to the Illumina MiSeq® System for 16S rRNA Sequencing, and the beta diversity by unweighted UniFrac principal coordinates analysis (PCoA) and the taxonomy assignment were analyzed by linear discriminant analysis effect size (LEfSe) method.Results
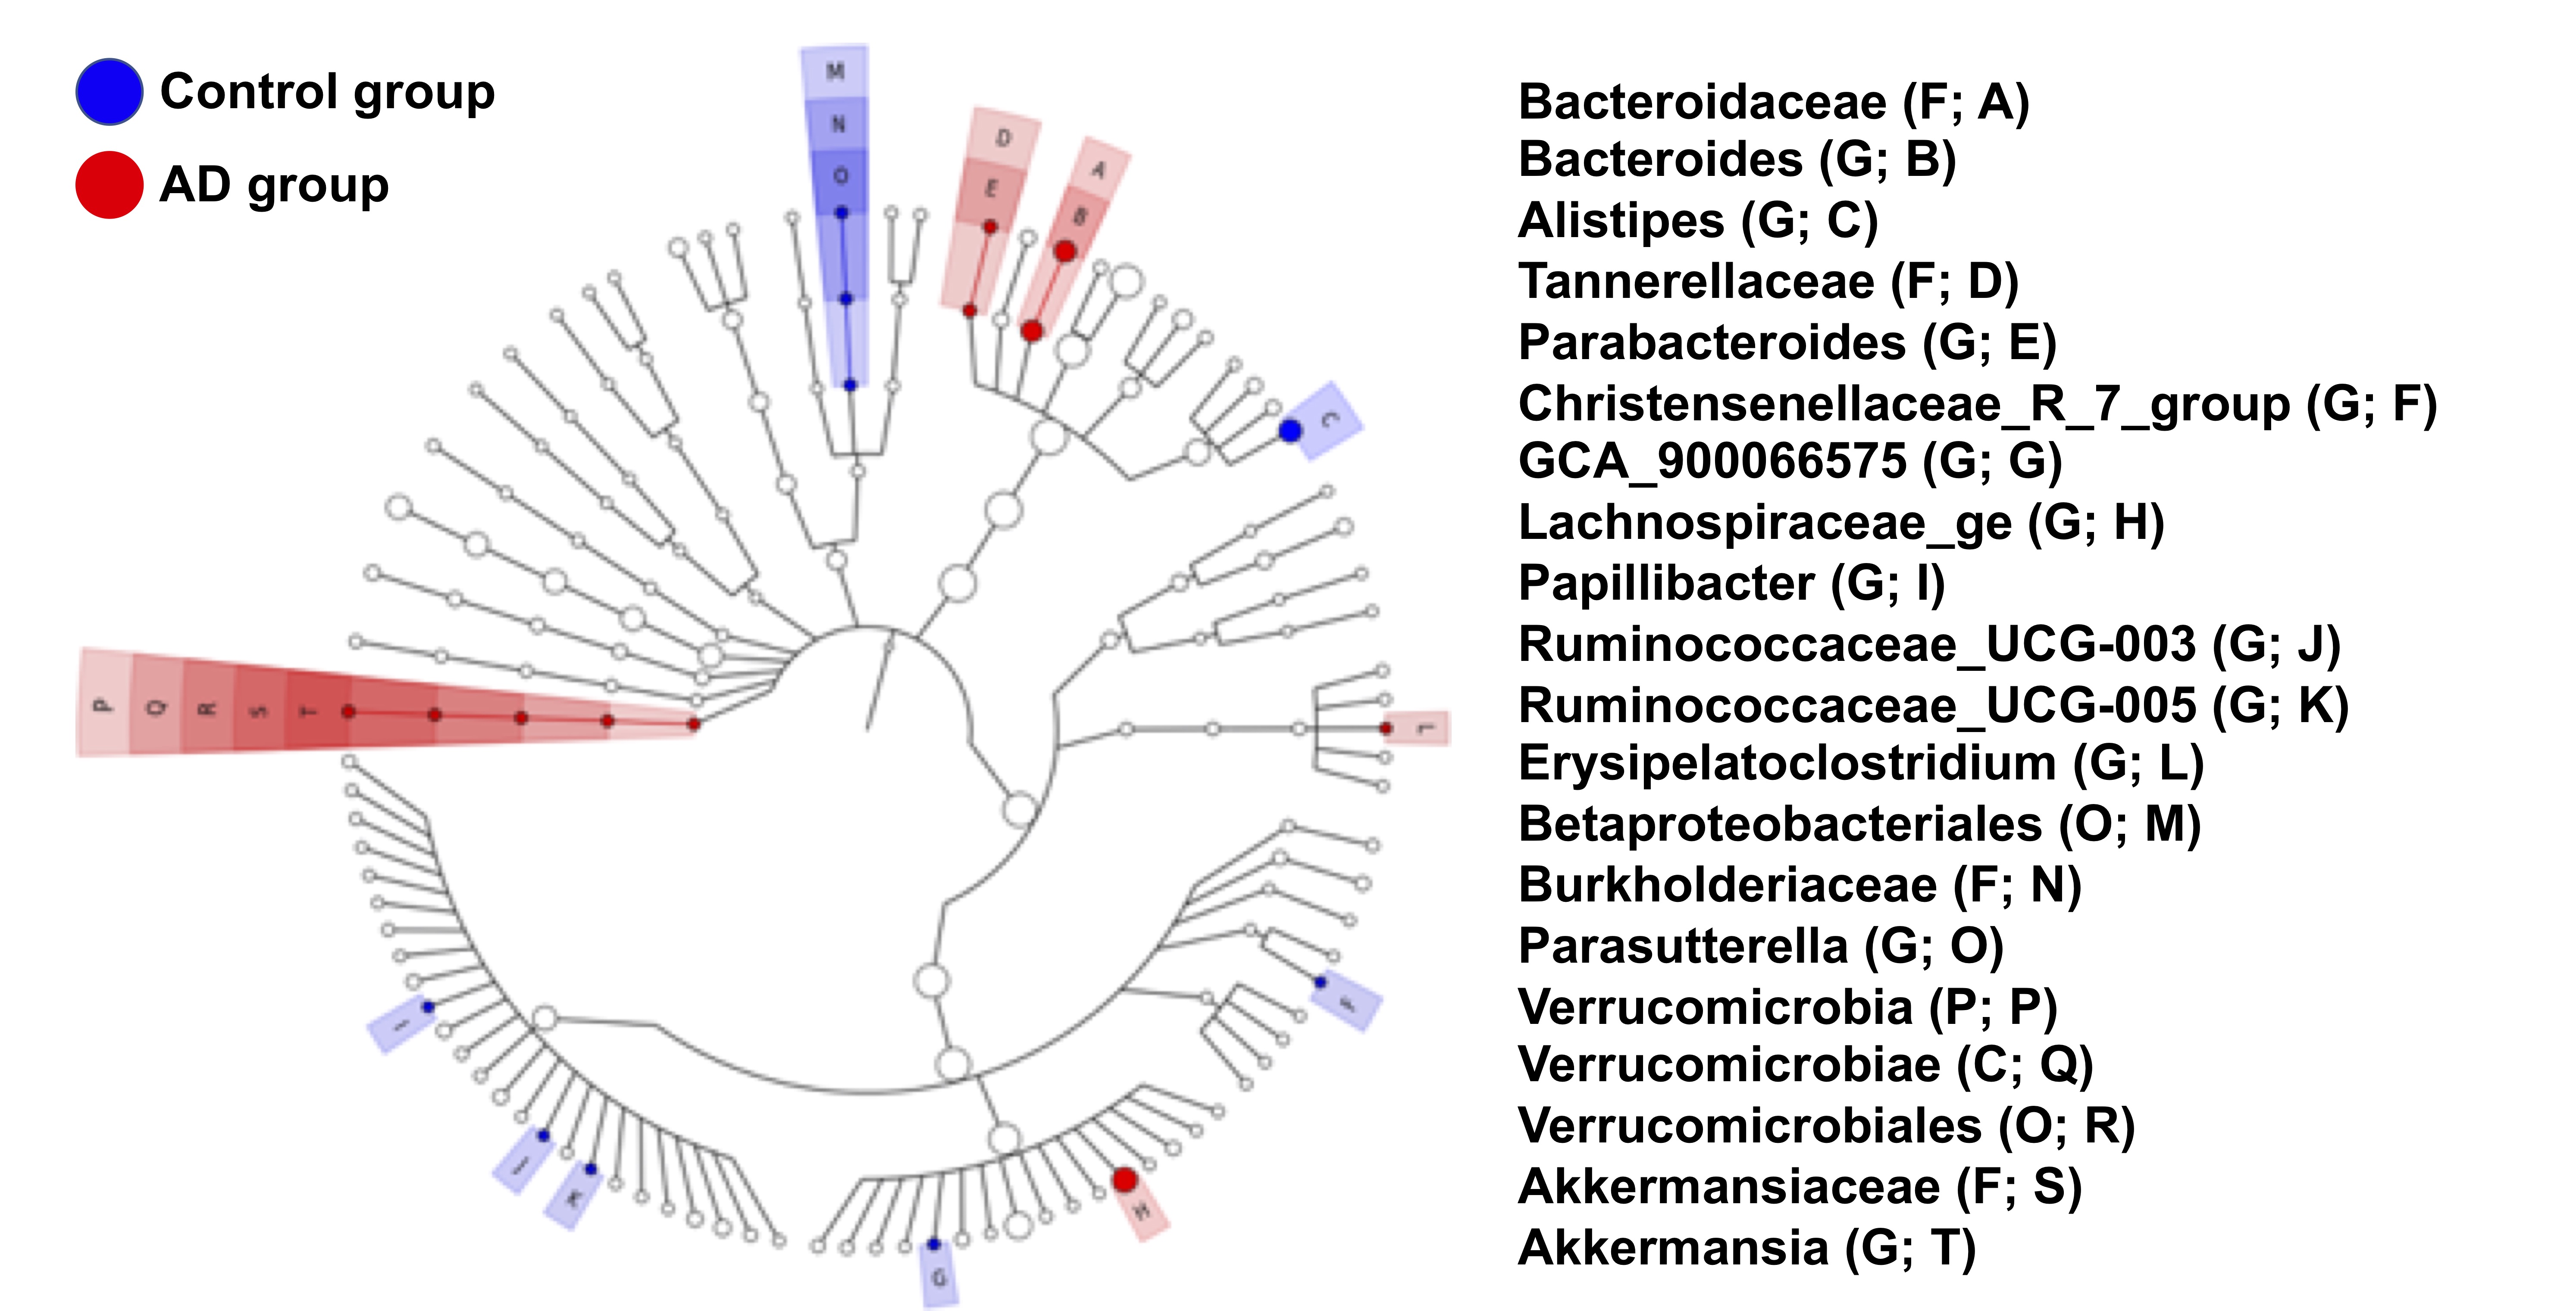
In the NOR task, AD group showed significantly lower PI as compared to the control group (Figure 1). Also, average FA values in EC, fornix, hippocampus, and striatum largely decreased in the AD group compared with the control group (Figure 2). Furthermore, through the beta diversity analysis of gut microbiota in the AD group and control group, a substantial difference between the two groups was observed in the total distribution of gut microbiota (Figure 3). In family-level LEfSe analysis, Burkholderiaceae in the AD group was greatly lower than that in the control group. Nevertheless, the AD group exhibited considerably higher Bacteroidaceae and Tannerellaceae than the control group (Figure 4).Discussion
Poorer cognitive performance was displayed in the AD group as compared to the control group. We found white matter integrity altered in EC, fornix, hippocampus, and striatum in AD group, and the AD group exhibited lower proportion of Burkholderiaceae and higher proportion of Bacteroidaceae and Tannerellaceae. These four brain regions in Papez circuit and limbic circuit modulated memory and learning, which may be associated with the cognitive dysfunction in AD15-17. In previous studies, the proportion of Bacteroidaceae18, Tannerellaceae19, and Burkholderiaceae20 was associated with cognitive functions. Our findings supported our hypothesis that the altered brain microstructure and atypical distribution of the gut microbiota were associated with the cognitive dysfunction in AD.Conclusion
In this study, we clarified the differences of the brain-behavior-gut-microbiome interaction between the AD and control groups. Based on the findings, we assume that the altered brain microstructure and atypical distribution of gut microbiota may be parts of biomarkers of AD.Acknowledgements
No acknowledgement found.References
1. Sperling, R.A., et al., Functional alterations in memory networks in early Alzheimer’s disease. Neuromolecular medicine, 2010. 12(1): p. 27-43.
2. Jin, Y., et al., 3 D tract‐specific local and global analysis of white matter integrity in A lzheimer's disease. Human brain mapping, 2017. 38(3): p. 1191-1207.
3. Kalus, P., H. Braak, and E. Braak, The presubicular region in Alzheimer's disease: topography of amyloid deposits and neurofibrillary changes. Brain research, 1989. 494(1): p. 198-203.
4. Braak, H. and E. Braak, Alzheimer's disease affects limbic nuclei of the thalamus. Acta neuropathologica, 1991. 81(3): p. 261-268.
5. Itzhaki, R.F., et al., Microbes and Alzheimer’s disease. Journal of Alzheimer's disease: JAD, 2016. 51(4): p. 979.
6. Al Omran, Y. and Q. Aziz, The brain-gut axis in health and disease, in Microbial Endocrinology: The Microbiota-Gut-Brain Axis in Health and Disease. 2014, Springer. p. 135-153.
7. Collins, S.M., M. Surette, and P. Bercik, The interplay between the intestinal microbiota and the brain. Nature Reviews Microbiology, 2012. 10(11): p. 735.
8. Clarke, G., et al., Minireview: gut microbiota: the neglected endocrine organ. Molecular endocrinology, 2014. 28(8): p. 1221-1238.
9. Quigley, E.M., Microbiota-brain-gut axis and neurodegenerative diseases. Current neurology and neuroscience reports, 2017. 17(12): p. 94.
10. Oddo, S., et al., Triple-transgenic model of Alzheimer's disease with plaques and tangles: intracellular Aβ and synaptic dysfunction. Neuron, 2003. 39(3): p. 409-421.
11. Leger, M., et al., Object recognition test in mice. Nature protocols, 2013. 8(12): p. 2531.
12. Antunes, M. and G. Biala, The novel object recognition memory: neurobiology, test procedure, and its modifications. Cognitive processing, 2012. 13(2): p. 93-110.
13. Dorr, A., et al., High resolution three-dimensional brain atlas using an average magnetic resonance image of 40 adult C57Bl/6J mice. Neuroimage, 2008. 42(1): p. 60-69.
14. Lein, E.S., et al., Genome-wide atlas of gene expression in the adult mouse brain. Nature, 2007. 445(7124): p. 168.
15. Ballarini, T., et al., Neuropsychiatric subsyndromes and brain metabolic network dysfunctions in early onset Alzheimer's disease. Human brain mapping, 2016. 37(12): p. 4234-4247.
16. Duran-Aniotz, C., G. Martínez, and C. Hetz, Memory loss in Alzheimer's disease: are the alterations in the UPR network involved in the cognitive impairment? Frontiers in aging neuroscience, 2014. 6: p. 8.
17. Acosta-Cabronero, J. and P.J. Nestor, Diffusion tensor imaging in Alzheimer's disease: insights into the limbic-diencephalic network and methodological considerations. Frontiers in aging neuroscience, 2014. 6: p. 266.
18. Bajaj, J.S., et al., Modulation of the metabiome by rifaximin in patients with cirrhosis and minimal hepatic encephalopathy. PloS one, 2013. 8(4): p. e60042.
19. Chou, H.-C., The Association of Gut Microbiome Composition and Parkinson’s Disease in Patient Cohort of Central California. 2019, UCLA.
20. Bajaj, J.S., The role of microbiota in hepatic encephalopathy. Gut microbes, 2014. 5(3): p. 397-403.
Figures