0862
Grading bladder urothelial carcinoma using a non-Gaussian fractional order calculus diffusion model1Radiology, Tongji Hospital, Tongji Medical College, Huazhong University of Science and Technology, Wuhan, China, 2Center for MR Research, University of Illinois at Chicago, Chicago, IL, United States, 3Department of Bioengineering, University of Illinois at Chicago, Chicago, IL, United States, 4Department of Radiology, University of Illinois at Chicago, Chicago, IL, United States, 5Department of Neurosurgery, University of Illinois at Chicago, Chicago, IL, United States
Synopsis
Diffusion-weighted imaging based on apparent diffusion coefficient (ADC) has been used for bladder urothelial carcinoma grading. However, a considerable overlap between the low- and high-grade bladder urothelial carcinoma has hindered its clinical acceptance. We employed high b-value diffusion imaging with a non-Gaussian fractional-order calculus (FROC) diffusion model for grading bladder urothelial carcinoma. Significant differences were observed in the FROC parameters D, β and μ, between the low- and high-grade urothelial carcinoma. The combination of the FROC parameters provided substantially better performance than ADC. These findings indicate a promising role of FROC parameters for characterizing bladder urothelial carcinoma and beyond.
Introduction
Bladder cancer (BC) remains one of the leading causes of cancer-related death worldwide1. The majority of BC are histologically classified as urothelial carcinoma, whose accurate grading is essential for effective patient management2. Diffusion-weighted imaging based on apparent diffusion coefficient (ADC) has been used for BC grading3,4. However, its clinical acceptance has been hindered by the considerable overlap of ADC values between the low- and high-grades5,6. Recently, a number of non-Gaussian diffusion models were proposed to probe the underlying tumor microstructures and microenvironment beyond what a simple ADC can provide7–9. One of these models is the fractional-order calculus (FROC) model7, which introduces a new set of parameters, D, β, and µ, that can be related to tissue cellularity, heterogeneity, and microenvironment, respectively. In this study, we have investigated the feasibility of using the FROC model parameters for grading urothelial carcinoma, and compare their performance with the conventional ADC.Methods
Patients: Under approval by the Institutional Review Board and with written informed consent, fifty-eight patients with pathologically confirmed urothelial carcinomas were included in this study. The patients were classified into two groups as low-grade (n = 21) and high-grade (n = 37) based on the 2004 World Health Organization classification system10.Image acquisition: All patients underwent MRI on a 3T scanner (GE MR750) with a 32-channel coil. A series of axial diffusion-weighted images were obtained using a single-shot spin-echo echo-planar imaging (EPI) sequence with multiple b-values of 01, 501, 801, 1001, 1501, 2001, 3002, 5002, 8002, 10004, 13004, 17006, 18006, 24006, 30008, and 360010 s/mm2 where the subscript denotes the number of averages. The other imaging parameters were: TR/TE = 2500/84 ms, FOV = 400 × 400 mm2, matrix size = 128 × 160, slice thickness = 4 mm, slice gap = 1 mm, separation between the Stejskal-Tanner gradient lobes (Δ) = 43.56 ms, duration of each diffusion gradient lobe (δ) = 32.2 ms, and the scan time = 6 - 8 min, depending on the number of slices to fully cover the anatomy.
Image analysis: The multi-b-value diffusion images were analyzed with the FROC model:
$$S = S_0exp[-D\mu^{2(\beta-1)}(\gamma G_d\delta )^{2\beta}(Δ- \frac{2\beta - 1}{2\beta + 1}\delta)],$$
where Gd represents the diffusion gradient amplitude, D (in units of mm2/s) is an anomalous diffusion coefficient, μ (in units of µm) is a spatial parameter, and β (dimensionless) is a spatial fractional order index that has been linked to intra-voxel tissue heterogeneity. For comparison, a conventional mono-exponential model was also used to compute ADC by using images from two b-values of 0 and 1000 s/mm2.
Statistical analysis: The regions-of-interest (ROIs) were placed by delineation along the tumor border on b = 1000 s/mm2 images over the largest area of the tumor. The mean values of the FROC parameters, D, β, and μ, and ADC over the ROIs were used for differentiation of low- and high-grade urothelial carcinomas. A non-parametric Mann-Whitney U test was used for the group comparison. This was followed by a receiver operating characteristic (ROC) analysis to compute the sensitivity, specificity, accuracy, and area-under-the-curve (AUC) of FROC model-based differentiation. The ROC analysis was performed by using both the individual FROC model parameters and their combination with the use of a logistic regression.
Results
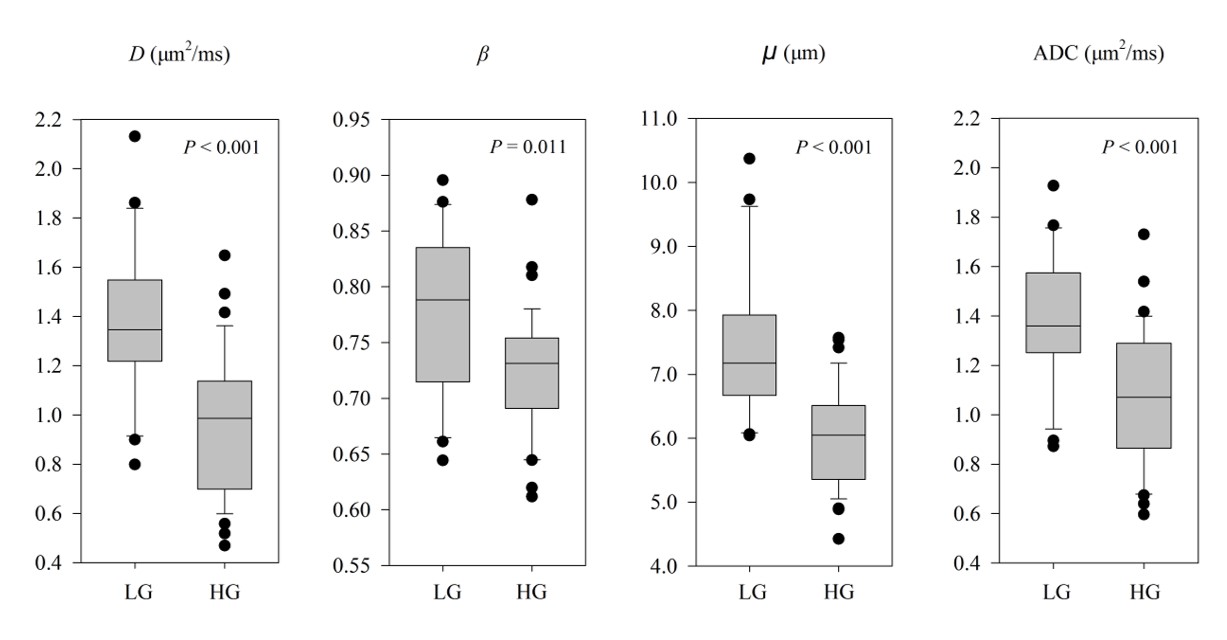
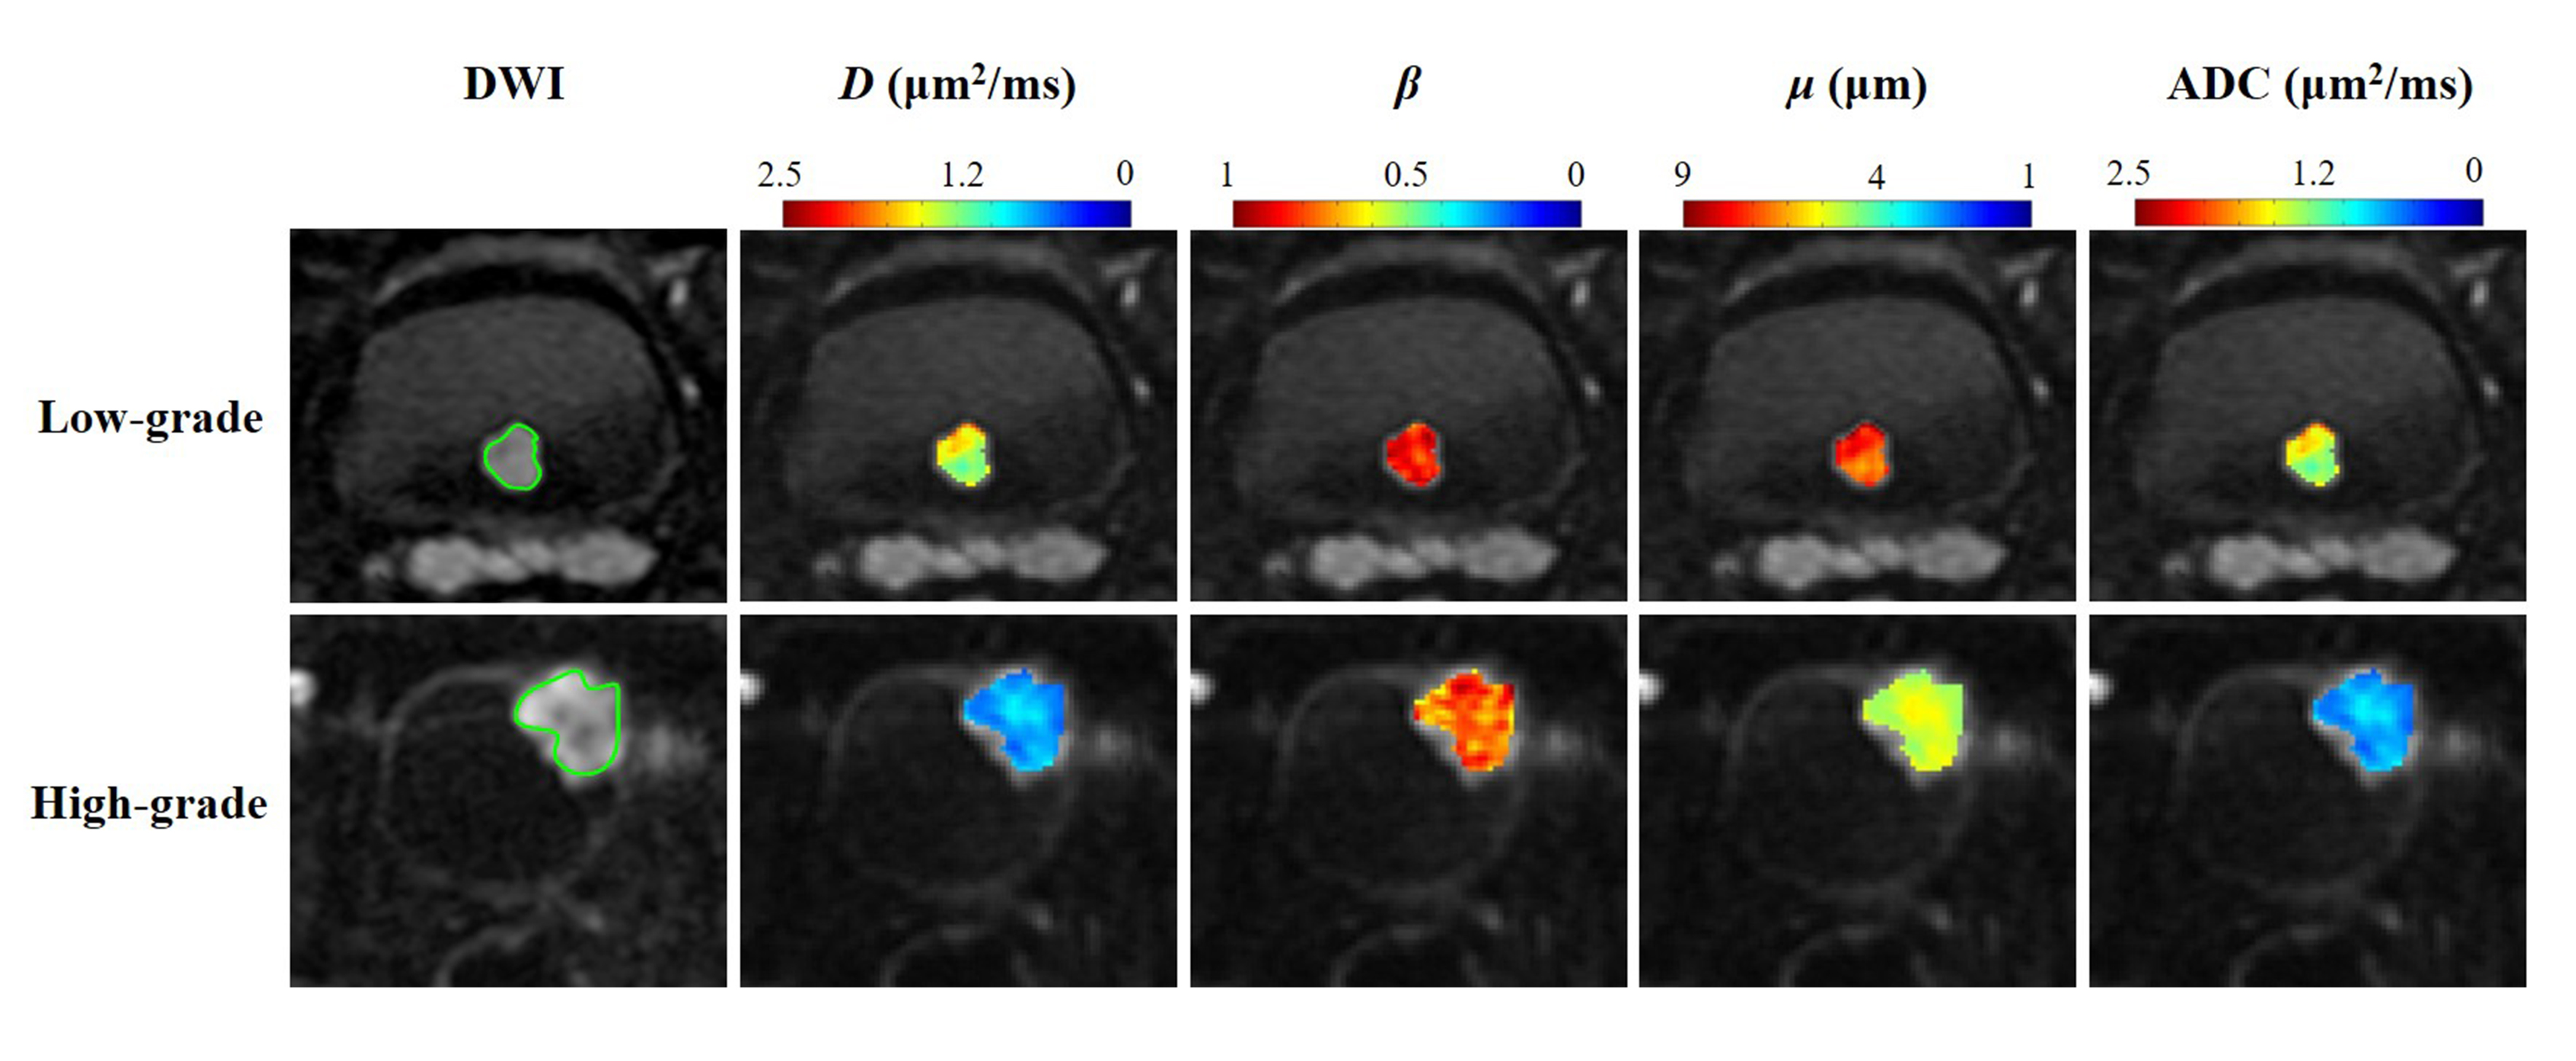
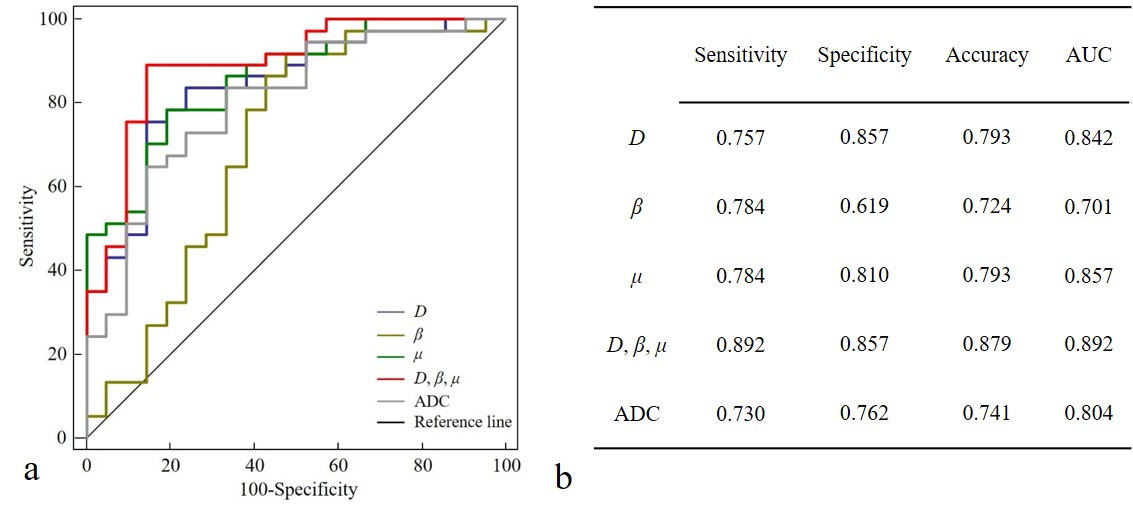
High-grade urothelial carcinomas exhibited statistically significantly lower values than the low-grade carcinomas in all parameters: D (0.96 ± 0.29 versus 1.38 ± 0.31 µm2/ms, p < 0.001), β (0.72 ± 0.05 versus 0.78 ± 0.07, p = 0.011), µ (6.01 ± 0.79 versus 7.45 ± 1.17 µm, p < 0.001), and ADC (1.08 ± 0.27 versus 1.40 ± 0.26 µm2/ms, p < 0.001) as summarized by the box-and-whiskers plots in Figure 1. Figure 2 shows the maps of D, β, and µ from one representative patient in the low-grade tumor (top row) and high-grade tumor (bottom row). The D, β, and µ maps all exhibited lower mean values in the high-grade tumor than those in the low-grade tumor. As shown in Figure 3, the combination of the FROC parameters (D, β, µ) yielded the highest sensitivity (0.892), specificity (0.857), accuracy (0.879), and AUC (0.892), which outperformed ADC in all metrics.Discussion and Conclusion
We have shown that high b-value diffusion imaging using the non-Gaussian FROC model can differentiate low- and high-grade bladder urothelial carcinomas with superior performance to that of ADC. While all diffusion parameters investigated yielded statistically significant differences between the low- and high-grade tumor groups, the combination of the FROC parameters substantially improved the diagnostic accuracy from 0.741 to 0.879. These findings suggest a promising role of the non-Gaussian diffusion parameters, such as those from the FROC model, for characterizing bladder urothelial carcinoma and beyond.Acknowledgements
References
1. Bray F, Ferlay J, Soerjomataram I, et al. Global cancer statistics 2018: GLOBOCAN estimates of incidence and mortality worldwide for 36 cancers in 185 countries. CA Cancer J Clin 2018;68(6):394–424.
2. Babjuk M, Böhle A, Burger M, et al. EAU Guidelines on Non–Muscle-invasive Urothelial Carcinoma of the Bladder: Update 2016. Eur Urol 2017;71(3):447–61.
3. Kobayashi S, Koga F, Kajino K, et al. Apparent diffusion coefficient value reflects invasive and proliferative potential of bladder cancer. J Magn Reson Imaging 2014;39(1):172–8.
4. Wang Y, Hu D, Yu H, et al. Comparison of the Diagnostic Value of Monoexponential, Biexponential, and Stretched Exponential Diffusion-weighted MRI in Differentiating Tumor Stage and Histological Grade of Bladder Cancer. Acad Radiol 2019;26(2):239–46.
5. Avcu S, Koseoglu MN, Ceylan K, et al. The value of diffusion-weighted MRI in the diagnosis of malignant and benign urinary bladder lesions. Br J Radiol 2011;84(1006):875–82.
6. Lin WC, Chen JH. Pitfalls and limitations of diffusion-weighted magnetic resonance imaging in the diagnosis of urinary bladder cancer. Transl Oncol 2015;8(3):217–30.
7. Zhou XJ, Gao Q, Abdullah O, et al. Studies of anomalous diffusion in the human brain using fractional order calculus. Magn Reson Med 2010;63(3):562–9.
8. Sui Y, Wang H, Liu G, et al. Differentiation of Low- and High-Grade Pediatric Brain Tumors with High b -Value Diffusion-weighted MR Imaging and a Fractional Order Calculus Model . Radiology 2015;277(2):489–96.
9. Karaman MM, Sui Y, Wang H, et al. Differentiating low- and high-grade pediatric brain tumors using a continuous-time random-walk diffusion model at high b-values. Magn Reson Med 2016;76(4):1149–57.
10. Ele J.N., Sauter G., Epstein J.I., et al. Classification of Tumours. Pathology and Genetics of Tumours of the Urinary System and Male Genital Organs. IARC Press. Lyon. 2004.
Figures