0861
Multidimensional Diffusion MRI Assists Myelin-sensitive Bound Pool Fraction in Differentiating Microstructural Maturity of Primate Brains1Danish Research Centre for Magnetic Resonance, Centre for Functional and Diagnostic Imaging and Research, Copenhagen University Hospital Hvidovre, Hvidovre, Denmark, 2Neurosurgery, Medical College of Wisconsin, Milwaukee, WI, United States, 3Department of Biomedical Engineering, Vanderbilt University, Nashville, TN, United States, 4School of Optometry, Université de Montréal, Montreal, QC, Canada, 5Department of Nuclear Medicine, University of Southern Denmark, Odense, Denmark
Synopsis
Myelin-sensitive bound pool fraction (BPF) enables the tracking process of myelination in primate brains. The 3D BPF maps demonstrated rapid development of myelination from a 2-day-old brain to a 12-month-old brain and a slower increase from 12 months to 30 months. Even though the process of myelination is slow, multidimensional diffusion MRI indices are indeed helpful in significantly differentiating the microstructural maturity of primate brains. Our findings suggest that both indices, isotropic kurtosis (MKI, associated with cell density variance) and microscopic anisotropy (MKA, correlated with cell eccentricity) are significant imaging markers for microstructural differentiation in the development of primate brains.
Introduction
MRI enables non-invasive assessment of brain development. However, the contribution of different microstructural elements (e.g., myelin sheath, axon) in brain development creates ambiguity. Here, we investigate spatiotemporal developmental patterns of different brain microstructures in the primate brain. We first performed quantitative myelin-sensitive bound pool fraction (BPF) to track the development of myelination. Then multidimensional diffusion MRI1-3 was used to investigate how cell density variance and cell eccentricity contribute to spatiotemporal patterns of development.Methods
All MR images were acquired on a 7T Bruker BioSpin 70/20 MRI system with ParaVision 6.0.1 software. We scanned four ex-vivo brains taken from Vervet monkeys, ranging from 2 days to 30 months. The specimens were placed in a transmit-receive volume coil with a 72 mm inner diameter4,5.Myelin-sensitive Bound Pool Fraction (BPF): A 3D selective inversion-recovery prepared fast spin-echo sequence6 was implemented with the following parameters: TE = 6 ms, Echo Train = 16, isotropic spatial resolution 500 μm. The sequence was repeated 15 times with inversion times log-spaced from 3.5 to 2000 ms. Then the 15 voxel-wise image magnitudes were fitted to the Bloch-McConnell equations, describing longitudinal relaxation and magnetization transfer between water and macromolecular protons7. The fitted model parameters include the equilibrium magnetizations of the free pools M0f and the bound pools M0b. Then both pools were applied to define bound pool fraction, BPF = M0b/ (M0b+M0f). The previous study has demonstrated that BPF correlates with histological measures of myelin content7. Both MRI sequences and Matlab codes are available online (https://remmi-toolbox.github.io/).
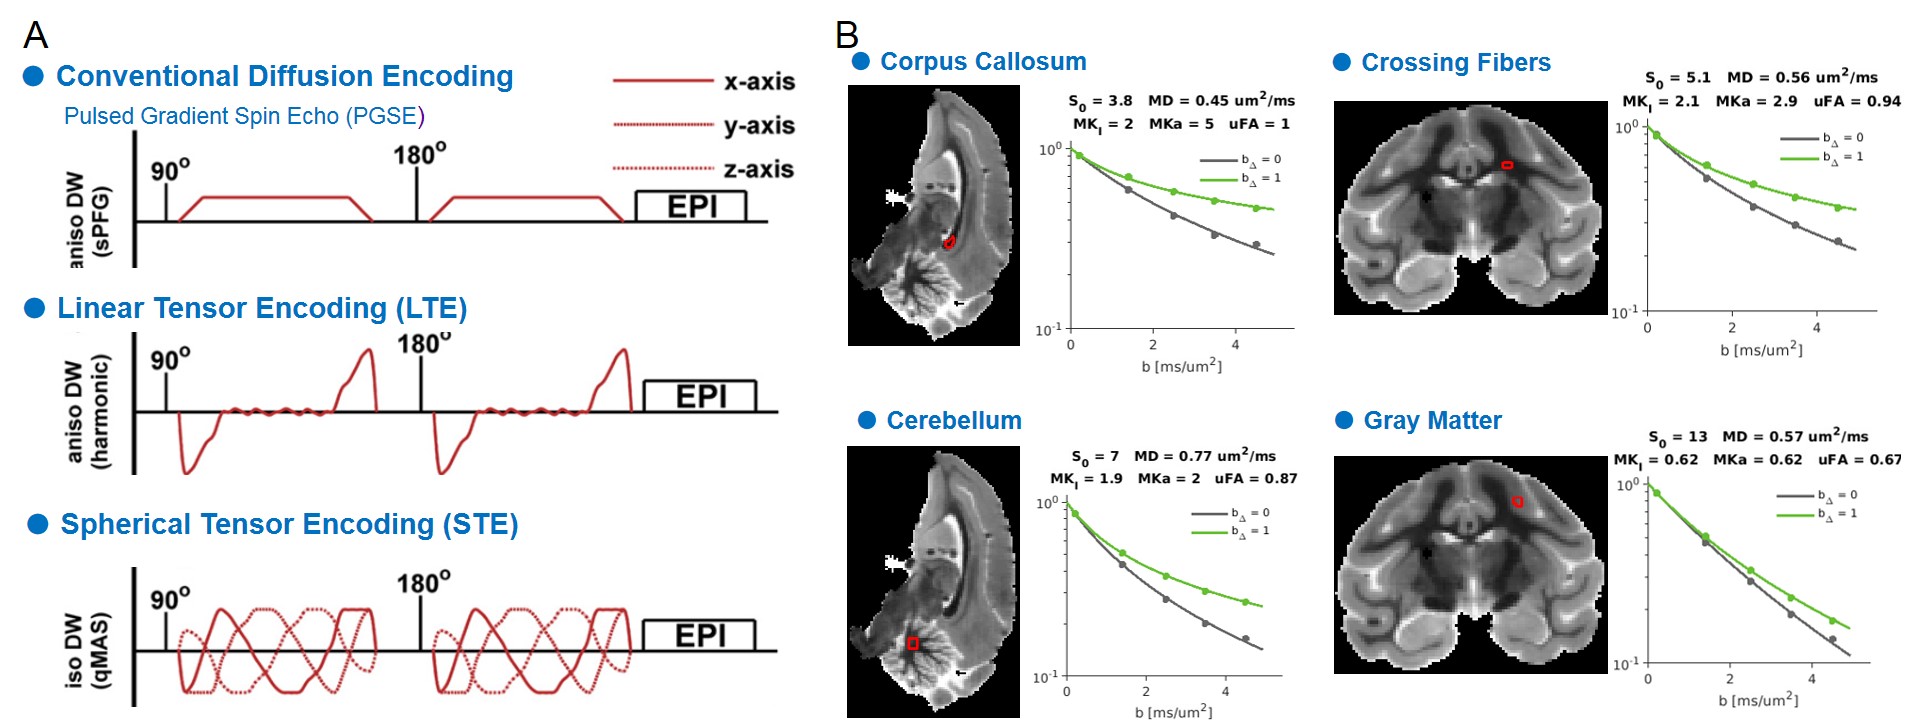
Multidimensional Diffusion MRI: A spin-echo sequence with linear tensor encoding (LTE) or spherical tensor encoding (STE) was repeated with 5 b-values2,3,8: 200, 1400, 2500, 3500, and 4500 s/mm2. The gradient waveforms of LTE and STE were performed with encoding time 25 ms. Images were acquired with the following parameters: TE, 71 ms; the repetition time, 8000 ms; in-plane resolution, 500 x 500 um2, slice thickness, 500 um. All multidimensional diffusion MRI indices were calculated by the online MD-dMRI Matlab toolbox (https://github.com/markus-nilsson/md-dmri). The indices include total mean kurtosis (MKT), isotropic kurtosis (MKI), anisotropic kurtosis (MKA), and microscopic fractional anisotropy (μFA).
Results
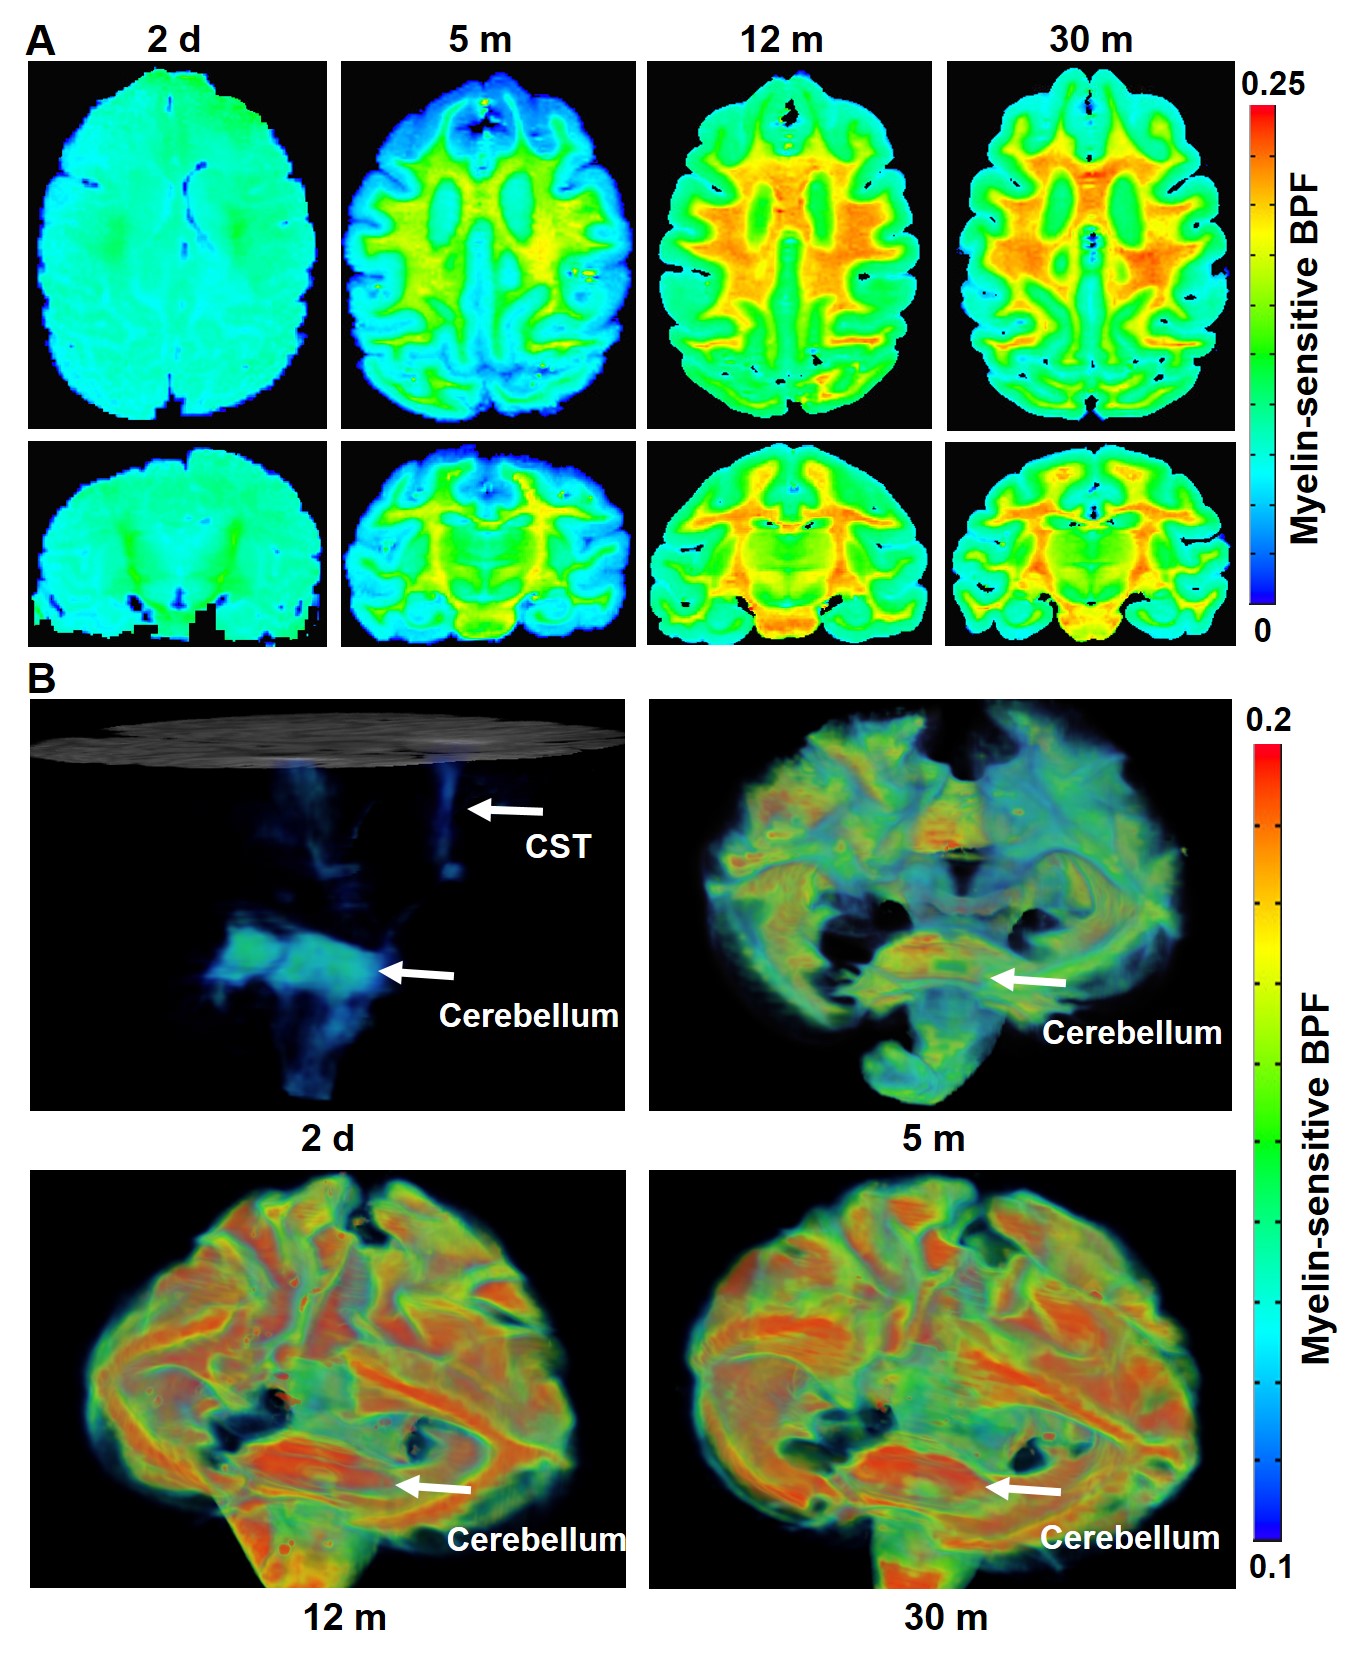
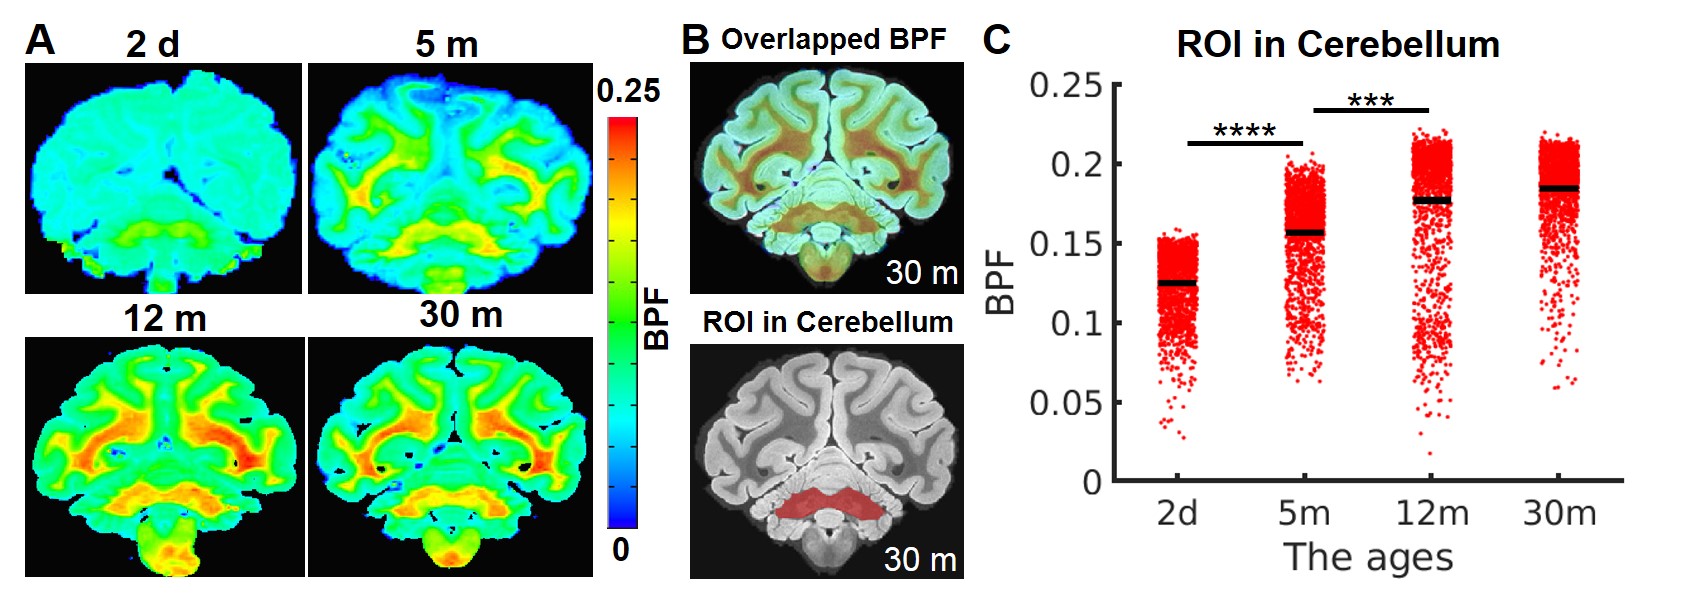
Myelin-sensitive BPF tracks the developmental processes of myelination in primate brains. We performed the quantitative BPF mapping in the four ex-vivo primate brains at four at post-natal ages 2 days (2d), 5 months (5m), 12 months (12m), and 30 months (30m). The 3D BPF maps (BPF >0.1) of the 2-day-old monkey (Figure 1B) demonstrate that the development of myelination starts in the cerebellum, pons, and corticospinal tract (CST). Then, the myelination proceeds to all white matter tracts and intracortical fibers of the cerebral cortex. In a previous report6, another quantitative imaging technique, myelin water fraction, also showed the consistent developmental trajectories of myelination in the human brain.The BPF values in the cerebellum ROI increase rapidly from 2-day-old brain to 12-month-old brain (Figure 2, Mann-Whitney U test, 2d vs. 5m: ****, p = 3.28 x 10-224; 5m vs.12m: ***, p = 2.65 x 10-125). However, from 12 months to 30 months, the BPF values show that the myelination process is almost similar to 30 months and proceeds at a slower but significant rate.
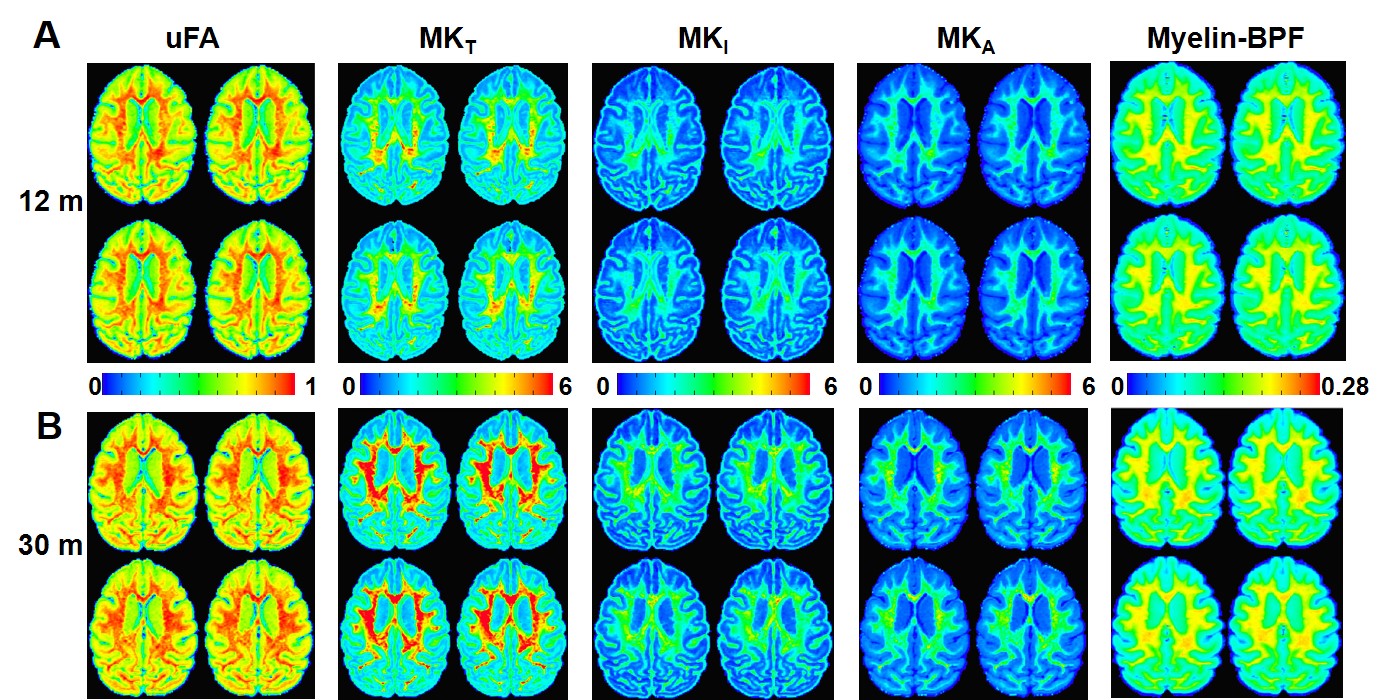
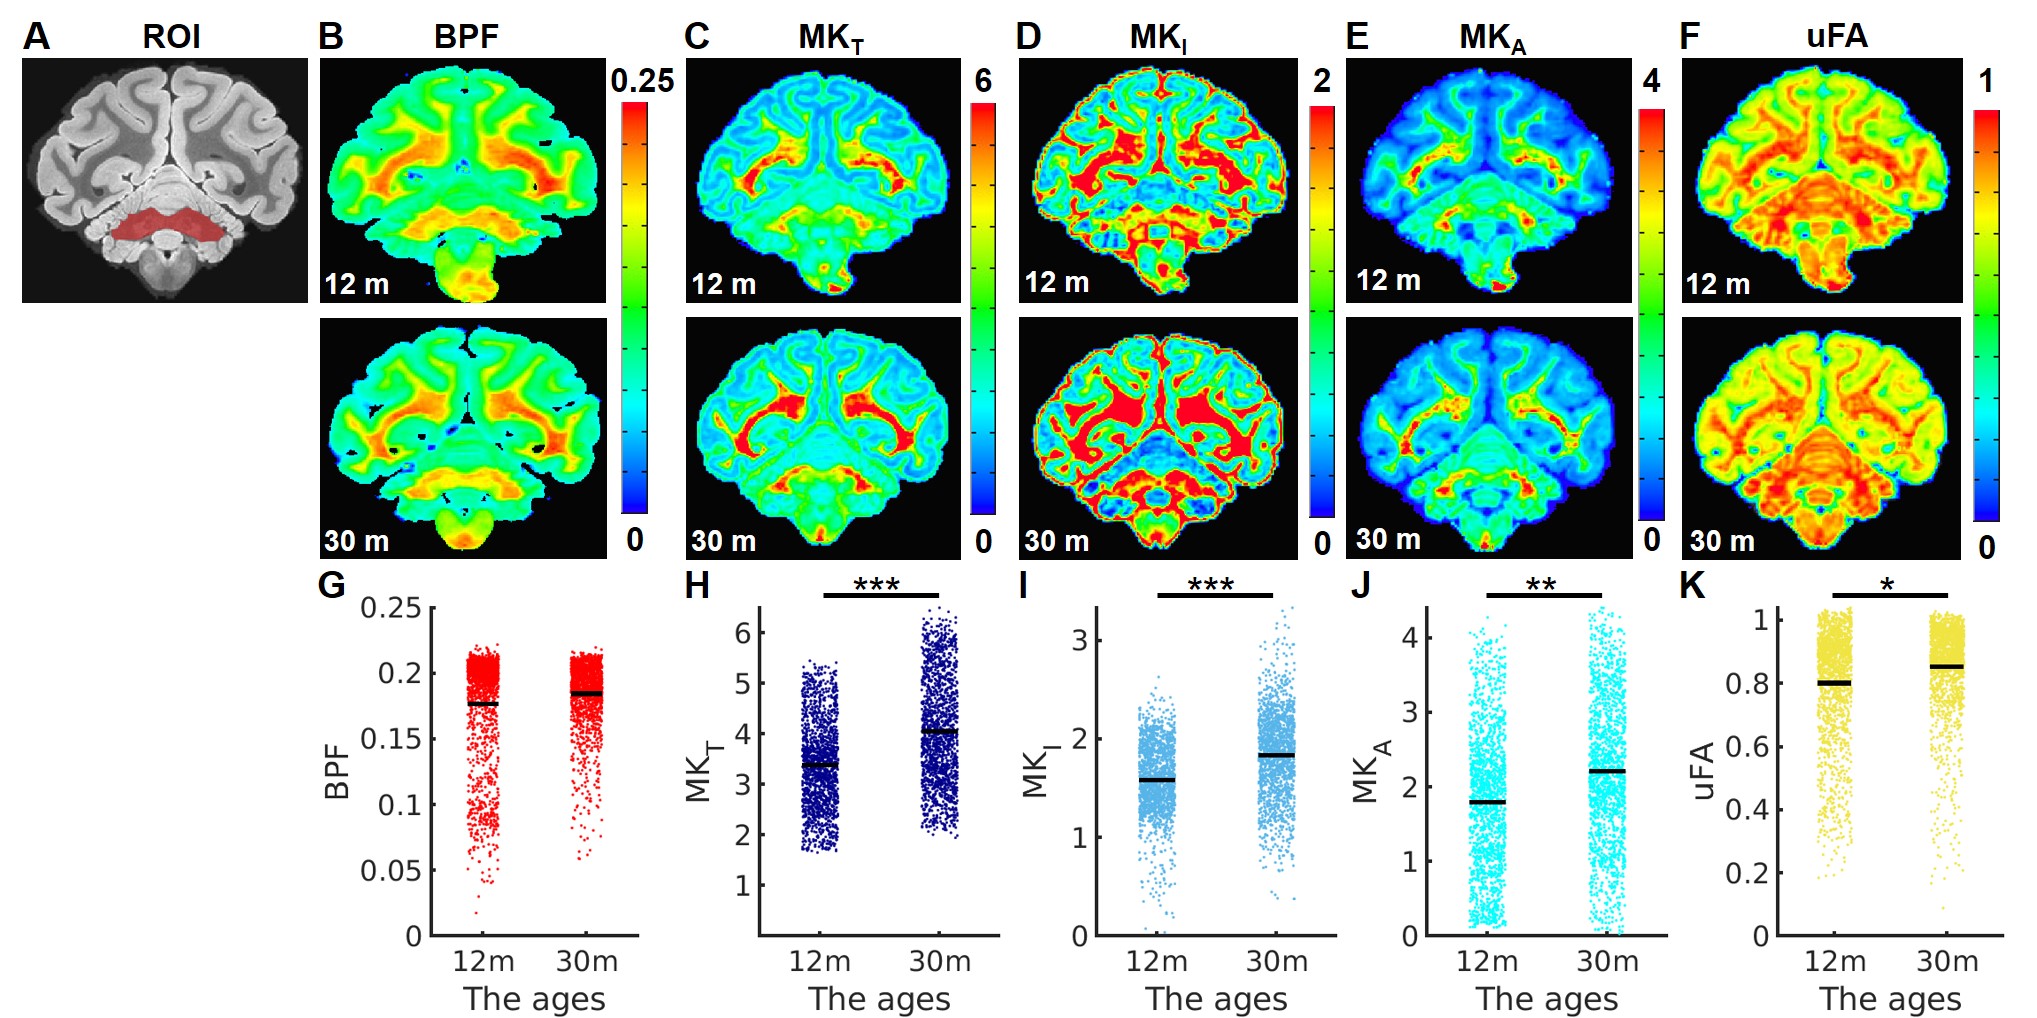
Multidimensional Diffusion MRI offers cell density variance (MKI) and cell eccentricity (MKA) in differentiating microstructural maturity. To better differentiate the maturation process during the stage of slow myelination, we examined two brains (12 months and 30 months) by using multidimensional diffusion MRI with linear tensor encoding (LTE) and spherical tensor encoding (STE) (Figure 3). Compared to the BPF maps, the total mean kurtosis (MKT), isotropic kurtosis (MKI), and anisotropy kurtosis (MKA) exhibit a significant difference in the ROI of the cerebellum between 12- and 30-month-old monkeys. (Figure 4, Figure 5, MKT: ***, p = 1.46 x 10-63; MKI: ***, p = 2.19 x 10-63; MKA: **, p = 1.86 x 10⁻³⁰).
Discussion
The significant changes in myelination of the primate brain occurred within the first 12 months for all brain regions. In contrast to the rapid rate of myelination, the BPF changes were slowly increased from 12 months to 30 months. Even though the myelination rate was lower during that period, both isotropic kurtosis (MKI) and anisotropy kurtosis (MKA) of the 30-month-old brain were significantly higher than that of the 12-month-old brain. Quantitative microscopy has reported that the isotropic kurtosis (MKI) was associated with cell density variance, and anisotropic kurtosis (MKA) only correlated to cell eccentricity3. Therefore, once myelination has reached maturity, other microstructures (e.g., axons) still contribute to brain development, indicated by the raising of cell density variance and cell eccentricity. Quantitative analysis of both BPF and multidimensional diffusion MRI indices provides further insight into the processes of different microstructural maturation.Conclusion
We performed myelin-sensitive BPF mapping to track the developmental processes of myelination in the primate brain. Myelination increases rapidly from 2 to 12 months and then slows down from 12 to 30 months. During this low myelination rate, the complementary multidimensional diffusion MRI adds cell density variance (isotropic kurtosis) and cell eccentricity (anisotropic kurtosis) to differentiate the microstructural maturity of the primate brain. We plan to acquire both BPF and multidimensional diffusion MRI on more brains from various age groups.Acknowledgements
YH acknowledges support from the European Union’s Horizon 2020 research and innovation programme under the Marie Skłodowska-Curie Grant Agreement No. 843352, the Lundbeck Foundation (R287-2018-479), and the Capital Region Research Foundation (No. A5657). TD has received funding from the Capital Region Research Foundation (No. A5657). HL has received funding from the European Research Council (ERC) under the European Union’s Horizon 2020 research and innovation programme (grant agreement No. 804746).References
1 Topgaard, D. Multidimensional diffusion MRI. J. Magn. Reson. 275, 98-113 (2017).
2 Lasič, S., Szczepankiewicz, F., Eriksson, S., Nilsson, M. & Topgaard, D. Microanisotropy imaging: quantification of microscopic diffusion anisotropy and orientational order parameter by diffusion MRI with magic-angle spinning of the q-vector. Frontiers in Physics 2, 11 (2014).
3 Szczepankiewicz, F. et al. The link between diffusion MRI and tumor heterogeneity: Mapping cell eccentricity and density by diffusional variance decomposition (DIVIDE). NeuroImage 142, 522-532 (2016).
4 Dyrby, T. B. et al. An ex vivo imaging pipeline for producing high‐quality and high‐resolution diffusion‐weighted imaging datasets. Hum. Brain Mapp. 32, 544-563 (2011).
5 Dyrby, T. B., Innocenti, G. M., Bech, M. & Lundell, H. Validation strategies for the interpretation of microstructure imaging using diffusion MRI. NeuroImage 182, 62-79 (2018).
6 Gochberg, D. F. & Gore, J. C. Quantitative magnetization transfer imaging via selective inversion recovery with short repetition times. Magnetic Resonance in Medicine: An Official Journal of the International Society for Magnetic Resonance in Medicine 57, 437-441 (2007).
7 West, K. L. et al. Myelin volume fraction imaging with MRI. NeuroImage 182, 511-521 (2018).
8 Lundell, H. et al. Multidimensional diffusion MRI with spectrally modulated gradients reveals unprecedented microstructural detail. Scientific Reports 9, 9026 (2019).
9 Deoni, S. C. et al. Mapping infant brain myelination with magnetic resonance
imaging. J. Neurosci. 31, 784-791 (2011).
Figures